Development of level of service standards for airport check-in facilities
Anderson Ribeiro Correia
Divisão de Engenharia de Infra-Estrutura Aeronáutica – Instituto Tecnológico de Aeronáutica
S. C. Wirasinghe
Civil Engineering Department – University of Calgary
ABSTRACT: In this paper we present a methodology for developing level of service (LOS) standards at airport passenger terminals based on user perceptions. The underlying concept of this methodology is a technique to derive quantitative values for passenger perceptions of service based on airport surveys. The check-in counter component is evaluated, considering as relevant factors that have a bearing on the user perceptions of LOS: processing time, waiting time and space available per person. The study uses data obtained from a passenger survey conducted at São Paulo/ Guarulhos International Airport. The results indicate that we can derive quantitative perception scales from qualitative survey data.
RESUMO: Neste trabalho é apresentada uma metodologia para o desenvolvimento de padrões de nível de serviço em terminais de passageiros em aeroportos em função da percepção dos usuários. O conceito fundamental desta metodo-logia é uma técnica para obter valores quantitativos para a percepção do serviço oferecido aos passageiros com base em pesquisas de campo em aeroportos. Particularmente o balcão de check-in é avaliado, considerando-se os seguintes fatores: tempo de processamento, tempo de espera e espaço disponível por usuário. O estudo utiliza dados obtidos a partir de uma pesquisa com passageiros conduzida no Aeroporto Internacional de São Paulo/Guarulhos. Os resultados indicam que se pode obter uma escala quantitativa de percepção a partir de dados qualitativos de uma pesquisa.
estimates made on the basis of conditions at airports in other countries are used without proper further evaluation. According to them, the issues of domes-tic traffic, in pardomes-ticular, deserve special attention in terms of Brazilian specifics.
Airport landside LOS and capacity have been topics of research interest over the past two decades or so. More recently, owing to the important nature of airport LOS issues, a number of studies have been initiated on the identification of the landside prob-lem in general, and on capacity and service measures in particular. Despite all the studies developed in the last decades, LOS analysis is in a rudimentary state of development in airport design, in comparison with highway engineering. In 1986 the FAA responded to concerns of inadequate understanding of landside ca-pacity constraints by commissioning a study (TRB, 1987) of ways to measure airport landside capacity. This study recognized that the capacity of any given landside facility cannot be evaluated without defin-ing acceptable LOS standards, but there was current-ly little agreement on how to do this.
This paper first presents a review of the literature on LOS evaluations. Second, a methodology for airport LOS evaluation is presented. The technique used is based on psychometric mathematical models for analyzing categorical data.
1 MOTIVATION
The motivation for developing landside level of ser-vice (LOS) measures is twofold. First, since one of the goals of landside planning is to improve, or at least maintain, the level of service experienced by the airport user, it is necessary to be able to mea-sure LOS in order to know whether this goal is be-ing achieved. Second, landside improvements rarely are without expense. To know whether a particular expenditure is justified, it is necessary to be able to measure the change in LOS resulting from it. Merely striving to meet arbitrary performance standards, without regard to the cost of doing so, is likely to lead to misallocation of resources (Gosling, 1988).
Establishing measures to evaluate operational per-formance of the airport landside and quality of ser-vice is one of the major problems facing the airlines and airport operators (Mumayiz, 1991). Humphreys and Francis (2000) affirm that LOS evaluation in US Airports have been undertaken at individual air-ports, with no standard method or reporting system for this on a national scale. Research is also needed in developing countries, mainly to generate refer-ences for planning airport infrastructure. In this re-gard Fernandes and Pacheco (2002) stress that the lack of studies in Brazil to enable parameters reflect-ing Brazilian conditions to be estimated means that
2 PREVIOUS STUDIES
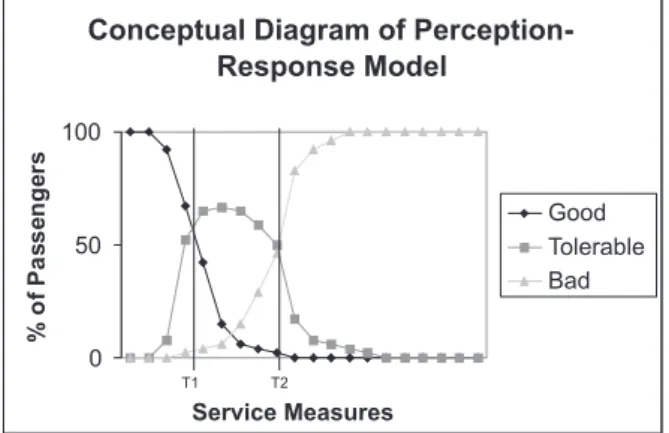
Airport LOS studies date from 1975 when Heathington and Jones (1975) examined 25 charac-teristics relevant to the airport passenger terminal. Some of these are availability of seating, walking distance, accessibility, orientation, waiting time and occupancy. During the last decades, many research-ers developed methods to evaluate LOS as func-tion of terminal characteristics and other factors. Paul (1981) followed the general idea presented by Heathington and Jones (1975). He presented a meth-odology for predicting passenger evaluations of air-port terminal facilities through the development of relationships between measures of passenger evalu-ation of the facility and factors that influence their evaluation. Another initiative to evaluate passenger perception of quality of service at airport terminals was developed by Mumayiz (1985). Utilizing a method called perception-response (P-R), he tried to empirically obtain LOS ranges as a function of pas-senger responses (Figure 1). The P-R methodology is detailed by Mumayiz and Ashford (1986). The main drawback of the mentioned methodology is that it allows the evaluation of only one attribute per time. Nevertheless, Ashford (1988) suggested that a strong interaction exists between space provision and time; that interaction cannot be obtained by the P-R concept as it has been presented. Mumayiz (1991) stated that a three-dimensional P-R concept could be developed accounting for the variations of delay and crowding, but, according to the author, no work has been done to support this hypothesis because of problems as-sociated with adequately interpreting and collecting passengers’ perceptions of crowdedness and space provided. In addition to that deficiency, recent LOS studies of airport passenger terminal processing com-ponents have shown that perceived and actual time revealed enormous discrepancies (Park, 1994; Park, 1999; Yen et al., 2001). Those discrepancies indicate that obtaining data by stated-preference technique must be used with caution.
Figure 1: Conceptual Diagram of Perception-Response Model (Mumayiz, 1985)
Müller (1987) proposed a framework for evaluat-ing quality of service at airport passenger terminals according to user perceptions, using a psychologi-cal spsychologi-caling technique. The objective of the research was to provide the support required to enable the transformation of the qualitative discrete passenger information into a quantitative continuum quality scale; it attempted to address the question of which are the relevant factors and their relative impor-tance in influencing the perception of overall ser-vice quality. They assumed that there is a consistent causal relationship between the measurable passen-ger experience at a facility (e.g., amount of time the passenger has to wait, degree of crowding, etc.) and the perceived quality of service. The modeling of passenger perception of the airport terminal quality of service considers that when passengers evaluate the quality of service a discriminal process enables them to place their perception of quality at a point on a quality scale. The modeling approach follows two steps. First it is considered that the passenger evalu-ates each terminal facility individually and secondly the overall terminal quality of service is evaluated; on this second step evaluation process, it is assumed that there is a causal relationship between facility ratings and the overall terminal quality of service rating. An attempt was made to evaluate passenger benefits in dollars when evaluating capacity expan-sions, which was possible through the exploration of the passenger value of time concept. Two impor-tant considerations can be observed with respect to the mentioned research:
1. Although the author has proposed a methodol-ogy for the evaluation of overall terminal LOS, he was not able to calibrate the mathematical equations with the available data, and no further study has been able to demonstrate the applicability of the method-ology to the overall terminal LOS evaluation.
2. The author provides a list of facilities impor-tance ratings, but no effort is spent to provide the adequate quality of service measures for each of them, e.g. information, aesthetics, security, curb, shops, eating facilities, etc. The only two measures employed on the study are waiting time and crowd-ing; obviously these measures can not account for the evaluation of many important facilities at the airport passenger terminal.
Concerning the survey, an attempt was made to observe passengers at the airport, thus collecting data in the form of experienced waiting time and crowding. As opposed to collecting actual stimulus, he collected average waiting times and crowding at every 15 minutes and then asked passengers to indi-cate in the survey the time they arrived at the airport. By the time indicated by the passengers he corre-lated this information with the average measures
collected every 15 minutes. There is one important issue that might arise: it is very difficult for passen-gers to note (at a 15 minutes precision) the time they arrived at the airport. Even if they could indicate that precisely, there is a possibility that passengers might spend some time at the parking, curbside, cir-culation, washroom or any other activity before get-ting into the check-in area. And this lag cannot be obtained by the survey developed.
Another important issue of the research em-ployed by Muller was that he asked passengers to provide an evaluation of quality of service for a spe-cific component as opposed to provide evaluation for specific measures (waiting time and crowding). When correlating user responses of the components’ quality of service with two measures, the data needs were very high. If the method proposed has to be ap-plied using three or four measures at the same time, the application would be impractical. Finally, pas-sengers provided the responses through a mail-back questionnaire. In this case, the questionnaire was filled on the flight or later in the hotel or back home. This time lag might present a bias that could affect the validity of responses.
Omer and Khan (1988) developed a method for applying the utility and cost-effectiveness theories for measuring user-perceived LOS and for establish-ing economical design criteria on airport landside. The methodology proposes the application of attitu-dinal survey techniques to ask the users to indicate the relative importance of LOS factors (e.g. waiting time, processing time, space availability) and to rate each LOS attribute/factor through a semantic scal-ing method. After that, the weight rates would be transformed to a relative value scale and then com-bined into a utility measure. That methodology was applied at some Canadian airports for the check-in, baggage claim, boarding lounge and preliminary in-spection line (PIL) area subsystems; the results of that research are presented by Omer (1990), where he provides composite utility equations for each of the subsystems mentioned. Figure 2 illustrates the relationship between physical measures, utility and level of service for the case of check-in and baggage claim facilities. Muller and Gosling (1991) criticize their methodology, suggesting that there are a num-ber of serious flaws in that approach. According to them, rank numbers are ordinal not cardinal, and cannot therefore be summed together, and most ser-vice measures do not have upper bounds and cannot be converted to a scale of 0 to 1. These problems could be circumvented by rating rather than by ranking. Ndoh and Ashford (1993) also criticize the approach, saying that the direct use of survey rating scales in the model suggested is inappropriate.
Figure 2: Level of service and utility: check-in and baggage claim (Omer and Khan, 1988) Martel and Seneviratne (1990) analyzed the fac-tors influencing quality of service (QOS) in passen-ger terminal buildings. Through a personal interview of departing passengers, they found that availabil-ity of space is the most significant factor influenc-ing quality of service from the passenger’s point of view. Within the circulation elements, 53 percent of the respondents believed that information is the most important factor. Similarly, for the waiting areas, the most important factor was the availability of seats and for the processing elements it was the waiting time. The study concludes that QOS is a complex concept that is inappropriate to evaluate with one indicator and the factors influencing QOS differ de-pending on the element of the passenger terminal building. Seneviratne and Martel (1991) applied the results of this survey to the measurement of perfor-mance variables for passenger terminal buildings. The measures were developed through the sugges-tion of global indices for the most important vari-ables that have a bearing on the evaluation of LOS, according to the passenger views found in the survey. Most of these global indexes proposed were applied in Seneviratne and Martel (1994); here they used six indexes to describe terminal subsystem characteris-tics: availability of seats, walking distance, accessi-bility, orientation (i.e., availability of information), waiting time, and occupancy (i.e., density).
Ndoh and Ashford (1994) explored the use of fuzzy set theory, particularly linguistic fuzzy set models, as a technique for evaluating transportation LOS through the incorporation of qualitative com-ponents such as convenience and comfort. They in-dicated that previous approaches used to estimate LOS provided crisp scale values of LOS that cannot be given linguistic values that are precise in com-parison with the manner in which passengers origi-nally expressed their perception of services. The authors apply the methodology proposed to evaluate processing services at an airport (check-in, security
inspection and passport control subsystems) using hypothetical values. Although the methodology seems reasonable, it was not properly validated. Further, the method does not offer any goodness-of-fit test to assess the quality of the measurement.
Yen (1995) conducted a survey at the municipal airport of Austin, Texas. He applied binary logit mod-els to estimate a “long” model and a “short” model to predict the probabilities that a passenger will rate a service on the basis of perceived time measures. The long and short models were then used to build a mechanism to define different service levels. The waiting times and delays were stated by the passen-gers (stated preference data) as were the proportion of responses (short – not short, long – not long). By using these two types of data the binary logit mod-els were developed, whose results are presented in Table 1.
The utility variable used in the logit models was supposed to be a function of the waiting time and de-lay values, and other explanatory variables (purpose of travel, gender, and family income). However the results of calculations show only the waiting time and delay coefficients as statistically significant.
For instance, the waiting time at check-in should be shorter than 9.5 minutes so that 50% of passengers rate it as short; it should be shorter than 6.5 minutes so that 60% of passengers rate it as short. On the oth-er hand, the waiting time at check-in should be lon-ger than 64 minutes so that 50% of passenlon-gers rate it as long; it should be longer than 58.5 minutes so that 40% of passengers rate it as long. Values below Ta represent LOS A; values above Tc represent LOS C; LOS B values lie between Ta and Tc. It is worth noticing that the range of values representing LOS B is very large (9.5-64.0 minutes). It should be use-ful to split this range into more ranges (A-E or A-F LOS ranges). Although the author provides a model that forecasts the proportion of passengers pleased with certain waiting time and delay values, he does
not recommend any standard values that might be applicable for airport planning and design.
The Airports Council International (ACI, 2000) undertook to develop a quality survey with its mem-bers. According to the survey, 61.7% of respondents make use of subjective criteria and 43.3% make use of objective criteria; 31.7% make use of both ob-jective and subob-jective criteria. Although there is no worldwide procedure for assessing quality of service at airports, the trends for processing components of airport passenger terminals is focused on measur-ing basically the waitmeasur-ing/processmeasur-ing time associated with individual facilities.
Yen et al. (2001) present a quantitative model to define the level of service at airport passenger ter-minals. The model uses the fuzzy concept to relate subjective service ratings to time measurements of associated waiting or service processes. Respondents were asked to rate each service from five possible items: very satisfied, satisfied, neutral, unsatisfied and very unsatisfied; following the calculation of five consecutive membership functions of service ratings, the thresholds can be estimated mathemati-cally to set up the interval of each service level. By the analysis of empirical data, they conclude that in each process the mean of perceived time is always greater than the one actually measured and percep-tive measurements have more deviation from their means than objective measurements.
3 METHODOLOGY PROPOSED
The methodology adopted for LOS evaluation is based on the psychometric scaling technique devel-oped by Bock and Jones (1968) and further applied by Muller (1987) and Ndoh and Ashford (1993).
Psychometrics and psychological scaling theory have given extensive consideration to the behavior of subjects, sampled from a specific population, in choosing among alternatives (Bock and Jones, 1968). These ideas can be applied to passenger level Table 1: LOS Standards
Service Operation Ta (0.5) Tc (0.5) Ta (0.6) Tc (0.4) Ta (0.7) Ta (0.3) Ta (0.8) Tc (0.2) Check-in 9.5 64.0 6.5 58.5 3.0 50.0 * 38.5 Baggage claim 9.5 19.0 8.0 18.0 6.5 16.5 4.5 15.5 Departure delay 10.0 39.0 7.5 36.5 4.5 33.5 1.0 30.5 Arrival delay 9.5 35.5 7.5 31.5 4.5 26.5 1.0 20.5
of service evaluation of an airport terminal by con-sidering passengers as subject to the experience of being processed at the terminal during the transition between their access and egress mode (whether by ground or air), and then being asked to choose a rat-ing for the quality of that experience (Muller and Gosling, 1991). Most of the studies on this subject are developed from the work of Thurstone (1959). He introduced the fundamental concept of a sensory continuum, which remains an essential part of cur-rent psychological theory.
There are many methods available based on psy-chometric scaling theory. We could divide them into two categories. There are the methods where judges assess a stimulus directly in terms of other objects, in which categories are included the constant, paired comparisons and rank order methods. In the other category, successive-categories judgments, however, depends upon passenger evaluations of the stimulus as a function of rating categories. For the purpose of measuring terminal LOS, it is supposed that the passenger will experience a stimulus only once dur-ing his/her trip experience, which is bedur-ing measured; in this case constant, paired comparisons and rank order methods are not useful for measuring perfor-mance variables LOS of different terminal compo-nents. Considering this, the successive categories method will be employed, since it is the most suit-able for measuring airport passenger terminal LOS. The method has been mathematically developed by Bock and Jones (1968), as presented below.
3.1 The method of successive categories
The methodology for obtaining LOS quantitative values will be illustrated with a practical example consisting of a survey applied to 119 passengers at the check-in counter at São Paulo/Guarulhos
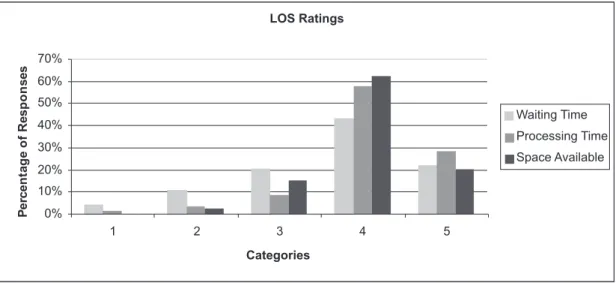
International Airport. They were asked to rate the experience at the check-in into five ordered level of service categories. In general these categories will be defined by k, which is described as follows: un-acceptable (k = 1), poor (k = 2), fair (k = 3), good (k = 4) or excellent (k = 5). The results of the survey are presented in Figure 3, where it is shown the per-centage of passengers indicating the waiting time, processing time and space available to be unaccept-able, poor, regular, good or excellent. Particularly, for illustration of the methodology, the waiting time will be analyzed in detail. The two other variables will be analyzed in subsequent sections.
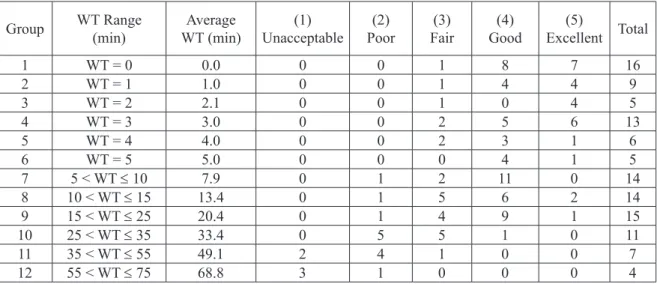
Table 2 illustrates the distribution of responses as a function of the waiting time experienced by passengers.
For the responses presented in Table 2, wait-ing times (WT) were measured for each passenger, prior to the interview. To facilitate the calculation, the 119 observed passengers have been separated into 12 groups of similar waiting times. It is pos-sible to obtain the proportion of responses where the waiting time is assigned at or below category k. Let us denote these proportions of responses as pjk, where j represents the group number, and k repre-sents the category. Table 3 prerepre-sents the proportions for the surveyed passengers at São Paulo/Guarulhos International Airport.
The proportion of responses represents a sim-plified LOS measure. It indicates the level of user satisfaction in each group. In group 7, only 21.4% of passengers rate the waiting time (7.9 minutes) as fair, poor or unacceptable; the great majority (78.6%) rate the waiting time as good or excellent. This LOS measure might be used by the manage-ment of an airport to asses the level of user satisfac-tion, however, it is not useful to precisely determine a quantitative LOS measure.
Let us define a level of service quantitative
con-tinuum ranging from −∞ to+∞. Values on the far
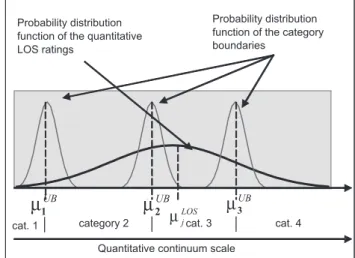
negative side represent a “bad” level of service. Values on the far positive side represent “good” level of service. Zero represents a neutral position. Suppose this continuum can be divided into five re-gions, which represent each individual level of ser-vice category (Figure 4).
Each category has a lower and an upper bound-ary. In Figure 4 for instance, a given passenger has evaluated the level of service of a facility between the lower and upper boundaries of category 3. In the following paragraphs, only the upper boundary of each category will be considered as far as it con-cerns the methodology development.
Suppose it is possible to obtain a quantitative LOS rating for the waiting time experienced. Consider that this rating LOS
ji
v can be defined as follows for a
given passenger i: LOS ji v = LOS j µ + εji (1) where LOS j
µ represents the mean LOS rating
com-mon to all passengers in group j, and εji represents a quantitative rating associated with a randomly se-lected passenger i in group j.
The position of a given category boundary is also assumed to be perceived at different points on the continuum by different passengers. Its location is also defined by a probability distribution with its own mean and dispersion. Thus the perceived location of the upper boundary of category k is given by:
UB ki v = UB k µ + εki (2) where UB k
µ represents the mean quantitative rating
associated with category k. The component εki is random based on passenger i.
Figure 5 illustrates the position of LOS ji
v , as
de-fined by a given passenger i. In this illustration, the passenger i has rated the waiting time experi-enced as fair (category 3) by choosing a value be-tween v2UBi and v3UBi . He/she has also interpreted the
category boundaries at 1UB i v , 2UB i v , 3UB i v and 4UB i v , as
shown. It is worth noting that the upper boundary of category 5 is +∞.
We assume the joint distribution of εji and εki to be bivariate normal, with means of zero, variances
2
j
δ and 2
k
γ , and intercorrelation zero. In the absence of information to the contrary, it is usual to consider
the variance 2
k
γ to be constant across all categories
k; so we will assume that 2
k
γ =γ2for all k. Figure
Table 3: Proportions (pk) of Responses at or Below Category k
Group WT (min) k category
1 Unac. 2 Poor 3 Fair 4 Good 5 Exc.
1 0.0 0.000 0.000 0.063 0.563 1.000 2 1.0 0.000 0.000 0.111 0.556 1.000 3 2.1 0.000 0.000 0.200 0.200 1.000 4 3.0 0.000 0.000 0.154 0.538 1.000 5 4.0 0.000 0.000 0.333 0.833 1.000 6 5.0 0.000 0.000 0.000 0.800 1.000 7 7.9 0.000 0.071 0.214 1.000 1.000 8 13.4 0.000 0.071 0.429 0.857 1.000 9 20.4 0.000 0.067 0.333 0.933 1.000 10 33.4 0.000 0.455 0.909 1.000 1.000 11 49.1 0.286 0.857 1.000 1.000 1.000 12 68.8 0.750 1.000 1.000 1.000 1.000
Table 2: Distribution of Responses as a Function of Waiting Time
Group WT Range (min) WT (min)Average Unacceptable(1) Poor(2) Fair(3) Good(4) Excellent Total(5)
1 WT = 0 0.0 0 0 1 8 7 16 2 WT = 1 1.0 0 0 1 4 4 9 3 WT = 2 2.1 0 0 1 0 4 5 4 WT = 3 3.0 0 0 2 5 6 13 5 WT = 4 4.0 0 0 2 3 1 6 6 WT = 5 5.0 0 0 0 4 1 5 7 5 < WT ≤ 10 7.9 0 1 2 11 0 14 8 10 < WT ≤ 15 13.4 0 1 5 6 2 14 9 15 < WT ≤ 25 20.4 0 1 4 9 1 15 10 25 < WT ≤ 35 33.4 0 5 5 1 0 11 11 35 < WT ≤ 55 49.1 2 4 1 0 0 7 12 55 < WT ≤ 75 68.8 3 1 0 0 0 4
6 illustrates the assumptions of normality for the distributions of LOS ji v and UB ki v .
The response of passenger i is assumed to be de-termined as follows. WTj (waiting time for passen-gers in group j) will be rated at or below point k for passenger i if: jki v∆ = LOS ji v – UB ki v = LOS j µ – UB k µ + εji – εki ≤ 0 (3)
Clearly, v∆jki is normally distributed, with mean
µ
(v∆jk) = LOS j µ – UB k µ , (4) and varianceν
(v∆jk) = δ2j+ γ2= σ2j (5)Equation (3) can be illustrated using Figure 5.
We note that LOS
ji v is smaller than 3UB i v . In this case jki v∆ = LOS ji v – 3UB i
v < 0. So, WTj is rated under
cat-egory 3. Although it is very obvious, this equation will be very useful to the development of the model. The application of this equation to an integral of probability distribution, considering the mentioned assumptions, and after change of variables, can pro-vide the following relation:
Figure 6: Illustration of the Successive Categories Method for all Passengers
( UB LOS) /
jk k j j
P = Φ µ −µ σ (6)
Equation (6) represents the probability that a
pas-senger will judge WTj at or below category k. The
inverse of this function is ( UB LOS) / k j j µ −µ σ = 1
( )
jk P − Φ (7)Data from experimental design may be cast in the form of observed proportions pjk, the proportions of
judgments of WTj at or below category k. Then
ac-cording to the model, Figure 4: Illustration of the Quantitative Continuum Scale
( UB LOS) / k j j µ −µ σ ≅ 1( ) jk p − Φ ≅
( )
yjk (8)yjk is the normal deviate corresponding to the pro-portion pjk in the lower tail of the unit normal distribution.
Bock and Jones showed that the estimate of
UB k
µ , UB
k
µ , can be determined as the average of the
kth value of the standard normal deviates over all passenger groups j, that is:
UB k µ = 1 1 n jk j y n
∑
= (9) According to the normal distribution, UBk
µ will
vary linearly with y, and so the estimate of LOS j
µ and
σj can be obtained by the regression line defined
us-ing these values of UB
k
µ as the dependent variables,
and the yjk, k = 1, 2, …, (m-1), for each j as the in-dependent variables. The slope will be σj and the
in-tercept on the UB
k
µ axis will be the value of LOS
j
µ .
This last value is the mean LOS quantitative rating for group j.
Before proceeding with the calculations to obtain
LOS j
µ , let us summarize the necessary steps:
1) Separate the passengers into groups of simi-lar waiting times. In the example, they were divided into 12 groups. Each of them has an average waiting time, denoted by WTj, where j is the group number (j = 1, 2, ..., 12).
2) Obtain the number of responses for each cat-egory in each group.
3) Calculate the proportions pjk. 4) Calculate the normal deviates yjk. 5) Calculate UB
k
µ as the average of yjk over all groups for each category k.
6) Perform a regression analysis to obtain LOS j
µ . For
the regression, the independent variable should be
yjk; The dependent variable should be UB k
µ .
In the example proposed, steps 1-3 have been al-ready undertaken. We now proceed to the calcula-tion of the normal deviates yjk (Table 4).
The UB
k
µ ’s have been calculated as the average
of the yjk’s over all groups. The second last row of
Table 4 calculates the mean of UB
k
µ ’s for the lower
and upper bounds of category 3. Its value (-0.791) represents the quantitative rating corresponding to Table 4: Normal Deviates – Waiting Time at the Check-in Counter
Group WT (min) 1 2 3 4 Sum
1 0.00 -4.287 -2.653 -1.534 0.158 -8.316 2 1.00 -3.974 -2.340 -1.221 0.140 -7.394 3 2.10 -3.594 -1.960 -0.841 -0.841 -7.238 4 3.00 -3.773 -2.139 -1.020 0.097 -6.835 5 4.00 -3.184 -1.550 -0.431 0.967 -4.198 6 5.00 -3.161 -1.527 -0.408 0.841 -4.253 7 7.90 -3.099 -1.465 -0.792 0.457 -4.898 8 13.40 -3.099 -1.465 -0.180 1.067 -3.677 9 20.40 -3.135 -1.501 -0.431 1.501 -3.566 10 33.40 -1.748 -0.114 1.335 2.584 2.057 11 49.10 -0.566 1.067 2.186 3.435 6.123 12 68.80 0.674 2.308 3.427 4.676 11.087 Sum -33.620 -15.647 -3.336 10.407 -42.195 UB k µ -2.802 -1.304 -0.278 0.867 (-1.304 – 0.278) / 2 = -0.791 UB k µ (normalized) -2.011 -0.513 0.513 1.658
the neutral position or indifference (mean of catego-ry 3). This value has been subtracted to the values of the originals UB
k
µ ’s for obtaining the “normalized”
UB k
µ ’s (last row of Table 4).
There is now enough data for obtaining the
LOS j
µ ’s. We will illustrate the procedure for
obtain-ing µ7LOS, which is the mean LOS rating for group 7
(waiting time = 7.9 minutes). In this case, a regres-sion analysis must be performed between the two variables presented in Table 5.
Table 5: Necessary data for performing a regression analysis Upper Bound of Category Dependent Variable UB k µ Independent Variable y7k 1. Unacceptable -2.011 -3.099 2. Poor -0.513 -1.465 3. Fair 0.513 -0.792 4. Good 1.658 0.457
The regression analysis provides the intercept of the curve, which is 1.20. This is the value of µ7LOS.
The remaining LOS
j
µ (j = 1 to 6, 8 to12) are presented
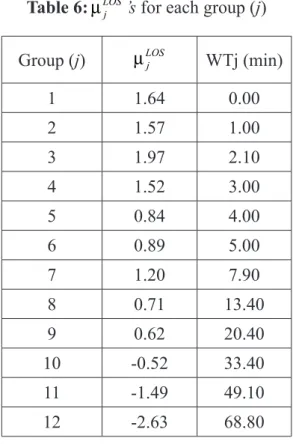
in Table 6.
Table 6: LOS j
µ ’s for each group (j)
Group (j) µLOSj WTj (min)
1 1.64 0.00 2 1.57 1.00 3 1.97 2.10 4 1.52 3.00 5 0.84 4.00 6 0.89 5.00 7 1.20 7.90 8 0.71 13.40 9 0.62 20.40 10 -0.52 33.40 11 -1.49 49.10 12 -2.63 68.80
From Table 6 it can be seen that the mean quan-titative LOS ratings become more negative as the waiting time increases; this represents the decreas-ing user satisfaction as the waitdecreas-ing time assumes greater values. It is possible to obtain a numeric function depicting the relationship between LOS and waiting times. The function obtained from a re-gression analysis performed using data from Table 6 is provided below:
LOS = 1.597 – 0.06 (WT) (10)
R2 = 0.96, F = 262.30
The curve corresponding to Equation 10 is rep-resented by the line in Figure 7. The data points are represented by the dots. Equation 10 can be used to determine the level of service standards associated with the boundaries of categories. Table 7 shows the upper boundaries of categories 1-4.
Figure 7: Data for Waiting Time at the Check-in Counter Table 7: Category boundaries
Upper Bound of Category µUBk 1 – Unacceptable -2.011 2 – Poor -0.513 3 – Fair 0.513 4 – Good 1.658
The substitution of the UB k
µ values of Table 7 into
Equation 3.14 provides the WT values correspond-ing to the upper boundaries of the categories. Table 8 shows the LOS standards calculated using this procedure:
Table 8: Proposed LOS Standards
LOS Waiting Time (min)
A < 1
B 1 – 17
C 17 – 34
D 34 – 58
E > 58
For instance, LOS B was defined using waiting times corresponding to upper bounds of categories 3 and 4.
Finally, the conformity of the observed pro-portions of response in each category, designated
pjk – pj,k-1 with those derived from the model
des-ignated Pjk – Pj,k-1, may be tested by computing a total χ2 (Chi-Square) for the discrepancies between them:
(11) To determine the degrees of freedom for the to-tal χ2, we note that there are n(m-1) independent observed proportions (according to the assump-tions stated before). From this total 2(n-1) degrees
of freedom are consumed by the estimates of LOS
j
µ
and σj not determined by the estimates of UB k
µ , and
m – 1 are consumed by the estimates of UB k
µ . Thus,
the residual variation is on (n-1)(m-3) degrees of freedom, and it is necessary to use not less than four categories and two objects if the model is to be test-ed (n = 12 is the number of groups, and m = 5 is the number of categories).
Equation 11 was applied and the chi-square value resulting was 13.476. The degrees of freedom are (12-1) (5-3) = 22. In this case the chi-square value (13.476) is compared to 33.429 at 5% significance level (22 degrees of freedom). By this compari-son we see that the model can be used for the LOS modeling.
4 DATA ANALYSIS
The analysis of processing time and space available LOS will be done similarly to the analysis of waiting time. However, some details will not be presented, since they are analogous to the ones reported in the previous analysis.
4.1 Processing Time
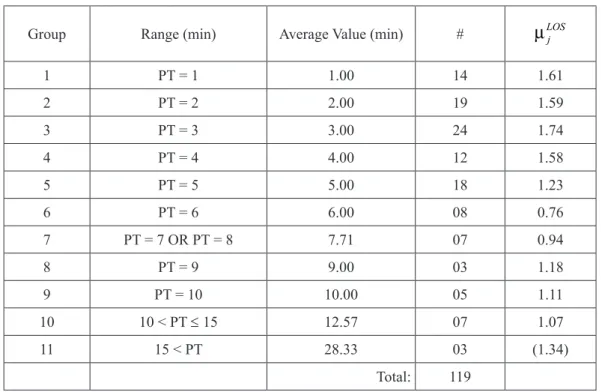
Passengers split into groups of similar processing time (PT) values is provided in Table 9, along with the respective PT ranges, PT average values,
num-ber of respondents, and LOS
j
µ for each group j.
Table 9: Check-in Processing Time Data
Group Range (min) Average Value (min) # µLOSj
1 PT = 1 1.00 14 1.61 2 PT = 2 2.00 19 1.59 3 PT = 3 3.00 24 1.74 4 PT = 4 4.00 12 1.58 5 PT = 5 5.00 18 1.23 6 PT = 6 6.00 08 0.76 7 PT = 7 OR PT = 8 7.71 07 0.94 8 PT = 9 9.00 03 1.18 9 PT = 10 10.00 05 1.11 10 10 < PT ≤ 15 12.57 07 1.07 11 15 < PT 28.33 03 (1.34) Total: 119
A regression analysis was performed using LOS j
µ as the dependent variable and the PT values (column 3 of Table 9) as the independent variable. The linear relationship has shown the best fit to the data. The parameters obtained from application of the regres-sion provide Equation 12. Figure 8 shows the plot of the data and the regression line. Table 10 shows the suggested LOS standards.
LOS SãoPaulo µ = 1.89 – 0.11 (PT) (12) (t = 13.87) (t = -8.37) R2 = 0.89, F = 70.065, χ2 = 12.832, χ2 critic = 31.410 (5% signif. – 20 d.f)
Figure 8: Plot of the Data and the Regression Line – Processing Time at the Check-in Counter
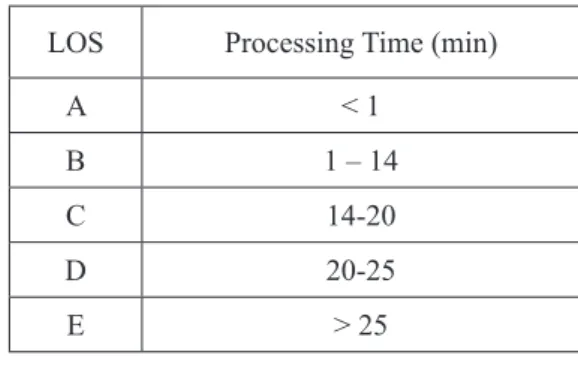
Table 10: Suggested LOS Standards
LOS Processing Time (min)
A < 1 B 1 – 14 C 14-20 D 20-25 E > 25 4.2 Space available
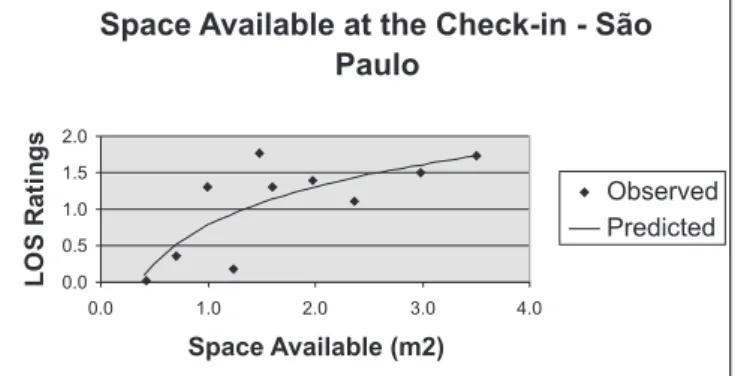
Passengers split into 10 groups is presented in Table 11, along with the characteristics of each group. Equation 13 presents the relationship between
LOS
µ and the space available (SA). In this particular
case, the log curve presented the best fit as opposed to linear functions. Figure 9 presents the plot of the data and the regression line. Table 12 presents the suggested LOS standards.
LOS SãoPaulo µ = 0.781 + 0.756 LN (SA) (13) (t = 4.819) (t = -3.383) R2 = 0.59, F = 11.446, χ2= 15.681, χ2 critic = 28.869 (5% signif. – 18 d.f.).
Table 11: Space Available Data – Check-in
Group Range (m2) Average Value (m2) # LOS
j µ 1 0.25 < AS ≤ 0.50 0.42 03 0.01 2 0.50 < AS ≤ 0.75 0.70 06 0.35 3 0.75 < AS ≤ 1.00 0.99 11 1.30 4 1.00 < AS ≤ 1.25 1.24 07 0.17 5 1.25 < AS ≤ 1.50 1.48 15 1.76 6 1.50 < AS ≤ 1.75 1.60 29 1.30 7 1.75 < AS ≤ 2.00 1.97 24 1.40 8 2.00 < AS ≤ 2.50 2.36 07 1.10 9 2.50 < AS ≤ 3.00 2.98 09 1.49 10 AS > 3.00 3.50 09 1.73 Total: 119
Figure 9: Plot of the Data and the Regression Line – Availability of Space at the Check-in
Table 12: Suggested LOS Standards
LOS Space Available (m2/pax)
A > 6.2
B 0.6 – 6.1
C 0.2 – 0.6
D/E < 0.2
LOS D and E were joined because there was no respondent that rated the availability of space at the check-in counter line as unacceptable (LOS E). That is why it was not appropriate to include a LOS merely based on projections of the Equation 13 using hypothetical values. LOS A (6.2 m2/pax) is obviously anti-economical and can only exist ing periods of low movement. That happened dur-ing some hours of the afternoon at the São Paulo / Guarulhos International Airport.
5 CONCLUSIONS
Throughout this work it has been shown that re-search on LOS of airport passenger terminals is a currently critical need, and despite this fact, most of the researchers have failed to provide a correla-tion between characteristics of facilities and LOS ranges according to the user perceptions. Supplying this critical need, an approach for LOS evaluation has been proposed, employing the psychometrical scaling theory as a mathematical tool to transform qualitative data into quantitative data, enabling get-ting user perceptions of LOS into a quantitative continuum. These LOS ratings were supposed to be correlated to waiting time, processing time and availability of space. Using the proposed approach, we have been able to obtain the correlation equations for individual measures. Considering all the results of this research, we suggest that LOS evaluation at airport passenger terminals be proceeded using
the approach provided in this paper. The approach presented is capable of getting passengers percep-tions of LOS for most components of the airport in a simple and effective way, which application would be affordable to any airport administration in Brazil or somewhere. The research, if extended to a large number of airports, and an increased numbers of variables, could be used to compare and contrast the LOS of airports nationally and internationally. Acknowledgements
The authors would like to thank CAPES – Brazil and NSERC – Canada for the support provided in this research.
REFERENCES
Airports Council International (2000) Quality of Service
at Airports: Standards & Measurements, ACI World
Headquarters, Geneva, Switzerland.
Bock, R. D. and L. V. Jones (1968) The Measurement and
Prediction of Judgment and Choice, Holden-Day, San
Francisco.
Fernandes, E. and R. R. Pacheco (2002) Efficient Use of Airport Capacity. Transportation Research, Part A: General, v. 36, n. 3, p. 225-238.
Gosling, G. D. (1988) Airport Landside Planning Techniques: Introduction. Transportation Research Record 1199, TRB, National Research Council, Washington, D.C., p. 1-3.
Heathington, K. W. and D. H. Jones (1975) Identification of Levels of Service and Capacity of Airport Landside Elements.
Airport Landside Capacity, Special Report 159, Transportation
Research Board, Washington, D.C., p. 72-92.
Humphreys, I. and G. Francis (2000) Traditional Airport Performance Indicators: A Critical Perspective. Transportation
Research Record 1703, TRB, National Research Council,
Washington, D.C., p. 24-30.
Martel, N. and P. N Seneviratne (1990) Analysis of Factors Influencing Quality of Service in Passenger Terminal Buildings. Transportation Research Record, 1273, TRB, National Research Council, Washington D.C.
Müller, C. (1987) A Framework for Quality of Service
Evaluation at Airport Terminals. PhD Thesis, Institute of
Transportation Studies, University of California, Berkeley. Müller, C. and G. D. Gosling (1991) A Framework for Evaluating Level of Service for Airport Terminals.
Transportation Planning and Technology, v. 16, p. 45-61.
Mumayiz, S. A. (1985) Methodology for planning and
op-erations management of airport passenger terminals: a ca-pacity/level of service approach. Ph.D. thesis, Department
of Transport Technology, Loughborough University of Technology, Loughborough, England .
Mumayiz, S. A. (1991) Evaluating Performance and Service Measures for the Airport Landside. Transportation Research
Record 1296, TRB, National Research Council, Washington,
Mumayiz, S. A. and N. Ashford (1986) Methodology for Planning and Operations Management of Airport Terminal Facilities. Transportation Research Record 1094, TRB, National Research Council, Washington, D.C., p 24-35. Ndoh, N. N. and N. J. Ashford (1993) Evaluation of Airport Access Level of Service. Transportation Research Record
1423, TRB, National Research Council, Washington, D.C., p
34-39.
Ndoh, N. N. and N. J. Ashford (1994) Evaluation of Transportation Level of Service Using Fuzzy Sets. Transportation Research
Record 1461, TRB, National Research Council, Washington,
D.C., p. 31-37.
Omer, K. F. (1990) Passenger Terminal Level of Service
Measurement: a Utility Theoretic Approach. MSc Thesis,
Carleton University, Ottawa.
Omer, K. F. and A. M. Khan (1988) Airport Landside Level of Service Estimation: Utility Theoretic Approach. Transportation
Research Record 1199, TRB, National Research Council,
Washington, D.C., p 33-40.
Park, Y. H. (1994) An evaluation methodology for the level of
service at the airport landside system. Ph.D. thesis, Department
of Transport Technology, Loughborough University of Technology, Loughborough, England.
Park, Y. H. (1999) A Methodology for Establishing Operational Standards of Airport Passenger Terminals. Journal of Air
Transport Management, v. 5, n. 2, p. 73-80.
Paul, A. S. (1981) Methodology for Modeling Passenger
Evaluations of Airport Terminal Functions and Components.
Ph.D. Dissertation, University of Virginia.
Seneviratne, P. N. and N. Martel (1991) Variables Influencing Performance of Air Terminal Buildings. Transportation
Planning and Technology, v. 16, n. 1, p. 1177-1179.
Seneviratne, P. N. and N. Martel (1994) Criteria for Evaluating Quality of Service in Air Terminals. Transportation Research
Record 1461, TRB, National Research Council, Washington,
D.C., p 24-30.
Thurstone, L.L. (1959) The Measurement of Values. University of Chicago Press, Chicago.
Transportation Research Board (1987) Special Report 215:
Measuring Airport Landside Capacity. TRB, National
Research Council, Washington, D.C.
Yen, J.-R. (1995) A New Approach to Measure the Level of Service of Procedures in the Airport Landside. Transportation
Planning Journal, v. 24, n. 3, p. 323-336.
Yen, J.-R., C.-R. Teng and P. S. Chen (2001) Measuring the Level of Service at Airport Passenger Terminals: Comparison of Perceived and Observed Time. Transportation Research
Record 1744, TRB, National Research Council, Washington,
D.C., p 17-23.
Anderson Ribeiro Correia ([email protected]) S. C. Wirasinghe ([email protected])