Repositório ISCTE-IUL
Deposited in Repositório ISCTE-IUL:
2018-10-16
Deposited version:
Post-print
Peer-review status of attached file:
Peer-reviewed
Citation for published item:
Rudnev, M., Magun, V. & Schwartz, S. (2018). Relations among higher order values around the world. Journal of Cross-Cultural Psychology. 49 (8), 1165-1182
Further information on publisher's website:
10.1177/0022022118782644
Publisher's copyright statement:
This is the peer reviewed version of the following article: Rudnev, M., Magun, V. & Schwartz, S. (2018). Relations among higher order values around the world. Journal of Cross-Cultural Psychology. 49 (8), 1165-1182, which has been published in final form at
https://dx.doi.org/10.1177/0022022118782644. This article may be used for non-commercial purposes in accordance with the Publisher's Terms and Conditions for self-archiving.
Use policy
Creative Commons CC BY 4.0
The full-text may be used and/or reproduced, and given to third parties in any format or medium, without prior permission or charge, for personal research or study, educational, or not-for-profit purposes provided that:
• a full bibliographic reference is made to the original source • a link is made to the metadata record in the Repository • the full-text is not changed in any way
The full-text must not be sold in any format or medium without the formal permission of the copyright holders. Serviços de Informação e Documentação, Instituto Universitário de Lisboa (ISCTE-IUL)
Av. das Forças Armadas, Edifício II, 1649-026 Lisboa Portugal Phone: +(351) 217 903 024 | e-mail: [email protected]
Running Head: Relations between higher order values
Relations Among Higher Order Values Around the World
Maksim Rudnev1,2
Vladimir Magun1,3
Shalom H. Schwartz4
1 National Research University Higher School of Economics 2 Instituto Universitário de Lisboa (ISCTE-IUL), CIS-IUL
3 Institute of Sociology of FCTAS RAS 4 The Hebrew University in Jerusalem
Acknowledgments
Work of the two first authors on this paper was supported by the Basic Research Program at the National Research University Higher School of Economics.
Correspondence should be sent to Maksim Rudnev, Laboratory for Comparative Studies of Mass Consciousness, National Research University Higher School of Economics, 20 Myasnitskaya str., Moscow 101000. E-mail: [email protected]
Abstract
The circular structure of basic human values is the core element of the Schwartz value theory. The structure demonstrated high robustness across cultures. However, the specific
correlations between values and the differences in these correlations across countries have received little attention. The current research investigated the within-country correlations between the four higher order values. We estimated the correlations with meta-analytical mixed effects models based on 10 surveys, on different value instruments, and on data from 104 countries. Analyses revealed theoretically expected negative relations between openness to change and conservation values and between self-transcendence and self-enhancement values. More interestingly, openness to change and self-transcendence values related negatively with each other, as did conservation and self-enhancement. Openness to change and enhancement values related predominantly positively, as did conservation and self-transcendence values. Correlations between the adjacent values were weaker in more economically developed countries, revealing higher value complexity of these societies. These findings were consistent across multiple surveys and after controlling for levels of education and income inequality. We concluded that, across most countries, values tend to be organized predominantly in line with the Social versus Person Focus opposition, whereas the Growth versus Self-Protection opposition is pronounced only in more economically
developed countries.
Keywords: basic human values, higher order values, value structure, meta-analysis,
Relations Among Higher Order Values Around the World
Schwartz’s theory of basic human values proposed a circular structure of dynamic relations among basic values likely to hold across cultures (Schwartz, 1992). It defined values as "desirable trans-situational goals, varying in importance, that serve as guiding principles in the life of a person or other social entity" (Schwartz, 1994, p. 21). Studies from a large
number and variety of cultures have supported this structure (summarized in Schwartz, 2015). These studies have also supported the discrimination of 10 distinct basic values and four higher order values (HOVs) that form two bipolar dimensions, transcendence versus self-enhancement and openness to change versus conservation.
Past investigations of value relations have largely focused on the correspondence between the observed relations among values and the theorized circular structure (e.g., Bilsky, Janik, & Schwartz, 2011). Some studies have noted systematic variations in the circular shape, especially in less developed countries (e.g., Bilsky et al., 2011; Fontaine, Poortinga, Delbeke, & Schwartz, 2008; Steinmetz, Isidor, & Baeuerle, 2012). However, researchers have paid little attention to whether the associations among values were positive or negative or to their strength. These aspects of the relations among values can reveal new features of value structures. In particular, they can reveal the extent to which particular values are congruent and how their congruence varies across cultures. This information is especially useful for understanding cultural differences in the relations of values to behaviors and attitudes.
The current paper investigates the signs and strength of associations among the four HOVs commonly referred to in the literature. The data come from multiple international studies including representative national, student, and teacher samples from 104 countries. Importantly, we propose substantive explanations for consistent differences across countries in value associations. This study adds to the literature in two ways. First, we clarify whether
HOVs are congruent or incongruent (i.e., correlated positively or negatively). Second, we explicitly test the moderation of the relations between HOVs by country level of economic development.
The Schwartz Theory of the Structure of Values
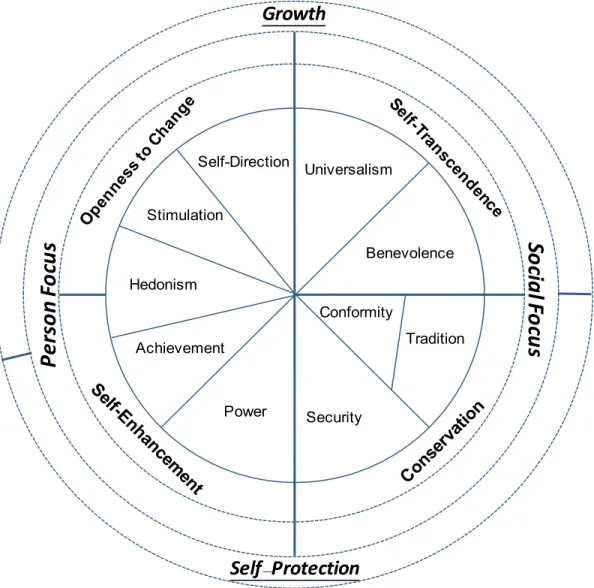
Schwartz (1992) described the array of terms that express values as forming a circular motivational continuum. For scientific convenience, he split this continuum into the 10 basic values shown in Figure 1. The closer any two values are to each other in this circle, the more compatible their motivational goals, therefore, one can easily pursue them simultaneously through the same action. The more distant any two values are from each other, the less compatible their goals, so the values on opposing sides of the circle typically lead to conflicting actions. However, compatibility does not necessarily imply strong positive correlations: the closer any two values, the more positive or less negative the correlations between them; the more distant the values, the more negative or less positive the correlations between them. Guttman (1954) used the term “circumplex” to describe a circular model with a gradual decline in correlations as one moves from adjacent to "opposing" variables.
Because the Schwartz model does not assume equal distances between adjacent values, but only their order, it is called a quasi-circumplex.
Figure 1 about here
Schwartz (1992) suggested that it is possible to partition the value continuum into four broader categories that he called HOVs: conservation, openness to change, self-enhancement, and self-transcendence (see Figure 1). These HOVs are the poles of two dimensions:
conservation versus openness to change and self-enhancement versus self-transcendence. More recently, Schwartz (2006) elaborated two additional ways to describe patterns of congruence and oppositions between values. The first one captures a well-known opposition between social and person-focused values (Rokeach, 1973, pp. 7-8). The self-transcendence
and conservation HOVs, which regulate relations to social entities (Social Focus), oppose the self-enhancement and openness to change HOVs, which regulate expression of one’s own abilities and interests (Person Focus) (left vs. right in Figure 1). Second, the
self-transcendence and openness to change HOVs, which express self-expansive, growth
motivations (Growth), oppose the self-enhancement and conservation HOVs, which express self-protective, anxiety-avoidance motivations (Self-Protection) (bottom vs. top in Figure 1).
Studies of the Fit of Values to the Circular Structure
Several studies that examined the general fit of values data to the (quasi-) circumplex structure have found systematic deviations from the perfect model. Fontaine et al. (2008) used replicated multidimensional scaling (MDS) to assess the structure of basic values in Schwartz Value Survey data from student and teacher samples in 38 countries. They largely replicated the order of the 10 values around the circle. However, several value items deviated from their expected locations, especially in less developed countries. The deviations most frequently involved items from the HOVs that express Growth and Self-Protection
motivations moving toward the center of the circle. This reduced the strength of opposition between Growth and Self-Protection values, as expressed by the distance between them. Thus, the circular representation of the values structure became more elliptical (i.e., compressing the vertical axis in Figure 1).
Bilsky et al. (2011) reproduced the empirical results of Fontaine et al. (2008) with national representative samples from the European Social Survey (ESS) that responded to the 21-item Portrait Values Questionnaire. They found that “the higher the societal development in a country the less the observed value structure deviated from the theorized circular
structure” (p. 12). In this study too, items belonging to the HOVs that express Growth and Self-Protection motivations moved toward the center of the circle in less developed countries. As a result, the distance between Growth and Self-Protection HOVs was reduced.
Steinmetz et al. (2012) reported similar results in a meta-analysis of 88 studies examining the 10 Schwartz basic values. They found that value structures in ESS studies in Eastern European countries differed substantially from the theoretical circular structure. In these countries, the structures exhibited a smaller distance between the Growth and Self-Protection values and larger distances between the Social and Personal Focus values. In contrast, the value structures in the Germanic and Nordic countries were much closer to the theoretical quasi-circumplex structure. The authors suggest that “future research could strive to investigate country level factors that influence the value structure… It is plausible that the country characteristics or societal values or norms enforce linkages between individual values” (Steinmetz et al., 2012, p. 71).
Fischer, Milfont, and Gouveia (2011) came to somewhat similar conclusions in a sample of Brazilian physicians with a different value instrument. They found that a Social-Personal value dimension was more stable than a Materialist-Humanitarian (roughly parallel to Self-Protection Growth) dimension, and the stability of both was related to the so-called “socio-living conditions” of the community/household (pp. 265-266).
In sum, although research has examined the relative positions of values in the quasi-circumplex, it has paid little attention to the directions and strength of the associations among the values. Are these associations positive or negative, strong or weak, significant or not? The studies rarely noted that large distances between items in the multidimensional space may not necessarily imply negative correlations. Nor do smaller distances necessarily imply positive correlations. Any particular distance may represent either a positive or a negative correlation, depending on the range of correlations among all the items.1 Knowledge about distances
informs us only about the relative strengths or order of correlations within given sets of
1Regarding MDS, Fontaine et al. (2008) claimed, that "small distances between the points represent positive correlations and large distances represent zero or even negative correlations" (pp. 347-348). This is true only when both positive and negative correlations are present in the correlation matrix, which is not always the case.
items. Without knowing the sign and magnitude of correlations among values, we cannot be certain whether pairs of values are congruent or not. By the same token, the fact that the distances between values vary across cultures does not tell us whether congruence between values varies too.
Unlike the abovementioned studies, Strack and Dobewall (2012) used factor analysis rather than MDS to assess the variation in a Growth versus Self-Protection factor across countries. They concluded that country differences in the variation relate strongly to country socioeconomic development. They found a unidimensional value structure in East European countries that reflected only the Social versus Person Focus opposition. However, like the other studies, they did not report the signs or strength of the correlations among values.
The above studies discussed congruence and conflict among values based on analyses that captured the value structure across individuals. Other studies examined whether the quasi-circumplex of values is also found within individuals. Gollan and Witte (2014) reported that associations among values within individuals fit the circular model quite well for more than 70% of European respondents. The fit of the circular model was poorer, however, for respondents from Southern and Eastern Europe, that is, from the less economically developed countries. Using a different method, Borg, Bardi, and Schwartz (2017) analyzed several British,
American, and Iranian samples and found that "almost each individual’s value priorities are organized according to the Schwartz value circle" (p. 12).
Magun, Rudnev, and Schmidt (2016) combined within- and across-individual approaches to the value structure. They applied latent class analysis to identify groups of individuals in Europe based on the similarity of their value profiles. They found five internally homogeneous groups. The groups differed as a function of the HOVs that were more or less important to them. Four of these groups were aligned along the Social – Person Focus opposition. That is, the HOVs tended to form the pairs that define either a Social focus
(self-transcendence and conservation) or a Person focus (self-enhancement and openness). These pairs of HOVs tended to oppose each other across the four groups: higher levels of one pair covaried with lower levels of the other. These four groups comprised about 80% of the European sample. Extrapolation of these results to the individual level suggests that, for a majority of Europeans, (a) relations between self-transcendence and conservation values and between self-enhancement and openness to change values are positive, and (b) relations of both self-transcendence and conservation values with both self-enhancement and openness to change values are negative. The remaining 20% of the European sample attributed high importance both to openness to change and to self-transcendence values (the Growth HOVs). Membership in this group was strongly associated with higher national economic
development. In some less developed countries, not even one person had a value profile that fit this group. The presence of this group in more developed countries is likely to make the four HOVs more independent of each other in these countries and weaken the suggested relations between them.
Hypotheses and Rationale
All the above studies found that the two Social Focus HOVs generally oppose the two Person Focus HOVs. Most studies also found that the two Growth HOVs oppose the two Self-Protection HOVs, but this opposition was less pronounced. We therefore hypothesize that the two Social Focus HOVs are positively intercorrelated as are the two Person Focus HOVs. That is, in general, conservation is positively related to self-transcendence (H1a) and openness to change is positively related to self-enhancement (H1b). We further hypothesize that, in general, the two Social Focus HOVs are in conflict with the two Person Focus HOVs. That is, conservation is negatively related to both openness to change and self-enhancement (H2a), and self-transcendence is negatively related to self-enhancement and openness to change (H2b). Table 1 summarizes these hypotheses.
Table 1 about here
Most of the studies mentioned above found that the opposition between Growth and Self-Protection values correlated positively with the socioeconomic development of a
country. Therefore, the relations between the HOVs predicted by Social versus Person Focus opposition (outlined in H1 and H2) might be weaker in more developed countries, where the HOVs are expected to bemore independent, and the structure is more complex.
This empirically driven expectation has theoretical underpinning as well.Differences in the distribution of human needs across the countries can predict cross-country differences in value structures (intercorrelations) because needs underlie motivational goals and values (Gouveia, Milfont, & Guerra, 2014; Rokeach, 1973; Schwartz & Bilsky, 1987).As theorized byMaslow (1970), people focus on higher order self-actualization and self-transcendence needs once they have satisfied their lower level physiological and security needs. A higher socioeconomic level in a country makes it easier for more people to satisfy lower level needs and therefore to focus on higher level needs.
Concern with lower level needs underlies an emphasis on Self-Protection goals and values, while concern with higher level needs underlies an emphasis on Growth goals and values. In less prosperous countries, survival concerns focus people on satisfying their lower level needs, whereas higher level needs are of little concern. Wealthier countries provide more opportunities for their populations to satisfy both lower order and higher order needs, expanding the pool of achievable goals, thereby generating more variability of values in society. This leads to more complex value structures in more developed compared with less developed countries. Higher complexity might imply a more heterogeneous structure, as reflected by lower associations between all the HOVs. Putting these empirical and theoretical claims together we hypothesize that the overall relations between HOVs specified by
hypotheses H1 and H2 are weaker in more developed countries and that the overall structure of values is more complex (H3).
Methods Participants and Procedure
The main dataset used in this study included respondents from representative national samples of 36 European countries in six (2002-2012) rounds of the European Social Survey (ESS). The ESS is an academically driven cross-national survey that has been conducted across Europe since 2002 (Jowell, Roberts, Fitzgerald, & Eva, 2007). We included the 97% of respondents who answered at least 17 of the 21 items in the value scale (N = 283,050). To assess the robustness of these findings, we also analyzed values data from 60 samples of school teachers (N = 14,549) and 73 samples of students (N = 24,479) from 54 and 65 countries, respectively, who responded to the Schwartz Value Survey (SVS),2 and data from
the fifth wave (2005-2009; N = 72,566 respondents from 52 countries) and the sixth wave (2010-2014; N = 72,416 respondents from 52 countries and territories) of the World Values Survey (WVS). Table 2 summarizes the characteristics of the samples. The Online
supplementary materials list the countries included in our study.
Instruments: Value Scales
The ESS measures basic values in the Schwartz theory with a 21-item Human Values Scale (or Portrait Values Questionnaire – PVQ-21, Schwartz, 2003). This instrument presents respondents with 21 short portraits of individuals who are described in terms of what is important to them – for example, “It is important to him to listen to people who are different from him.” Respondents rate how similar the individual described in each portrait is to them on a scale from 1 (Very much like me) to 6 (Not like me at all). We computed scores for each of the four HOVs (conservation, openness to change, enhancement, and
transcendence) by averaging responses to the items from the values that constitute the
HOVs.3 We corrected the value indices by centering each individual’s responses on his or her
mean response to all 21 value items (Schwartz, 2003, 2005; Schwartz, Verkasalo,
Antonovsky, & Sagiv, 1997). This within-individual centering of value indices is necessary because (a) it reduces scale use response sets (i.e., respondents’ tendency to locate their responses on particular parts of the response scale), and (b) it creates scores that reflect the
relative (vs. absolute) importance of values to the person. The latter is desirable because it is
the relative importance of relevant values that guides attitudes and behaviors (Schwartz, 1992, 1996; Tetlock, 1986).4
The second survey whose data we analyzed was the Schwartz Value Survey (SVS). It presents respondents with 57 abstract values and asks them to indicate how important each one is “as a guiding principle in my life” on a scale from -1 (Opposed to my values) to 6 (Very
important) and 7 (Of supreme importance) (Schwartz, 1992). The values are presented in two
lists, one of 30 terminal (end-state) values (e.g., EQUALITY [equal opportunity for all]) and one of 27 instrumental (means) values (e.g., LOYAL [faithful to my friends, group]). We computed scores for each of the four HOVs in the same manner as described above for the ESS data, including the correction for scale use differences. The SVS instrument has
demonstrated highly similar structures of relations among its items across cultures (Schwartz,
3Davidov, Meuleman, Billiet, and Schmidt (2008) assessed the measurement invariance of self-enhancement and self-transcendence HOVs in the data from the first round of the ESS. They found partial metric invariance across countries, sufficient for comparing correlations, as did we. We assume that their finding can be
extrapolated to all HOVs and different ESS rounds.
4 Within-person centering might introduce a negative bias to correlations. However, failure to include a correction in the presence of response sets might lead to a positive bias in correlations. Given the positive desirability of most values, it is not realistic to assume that there is no response bias in the data.
In order to check robustness of the results to centering, we repeated our analyses with uncentered value indices (the results are reported in Online supplementary materials, Tables S12-S13). With uncentered data, as
expected, almost all correlations were positive, even between opposed values. Critically, the rank order of these correlations was similar for both centered and uncentered indices. This reinforces our conclusions concerning the relative congruence of HOVs. Moreover, the effects of gross national income per capita (GNIpc) on the correlations between adjacent HOVs, controlling years of schooling, replicated in all the models.
1992, 1994; Schwartz & Sagiv, 1995) and numerous predicted associations of values with other variables (e.g., Schwartz, 2015).
The third instrument whose data we analyzed was from the WVS. The fifth wave included 10 items adapted from the ESS survey, one for each of the values. Each item was a short third person statement with which respondents were asked to compare themselves on the scale from 1 (Very much like me) to 6 (Not at all like me) (e.g., It is important to this person to have a good time; to “spoil” oneself). The sixth WVS wave used the same
measurement approach but modified two items. We computed scores for the HOVs using the relevant items and centered them in the same way as was done with the ESS data. We
included the WVS data in our robustness analyses to extend the tests to additional countries. Given the limitations of the 10 WVS value items, we treat the findings of this robustness test with caution and only consider general trends.
The four HOVs are not exact combinations of the 10 basic values. The Hedonism value has elements of both openness and self-enhancement (Schwartz, 1992). We included its items in the openness to change HOV because structural analyses located it more with
openness to change in approximately 70% of the samples (Schwartz, 2007). The
Achievement value has elements of both Self-Protection and Growth. We treated it as a self-enhancement value, as has been done in all studies of HOVs (Schwartz, 2005, 2015), and thus placed it with the Self-Protection values. Because we use three different instruments to measure the HOVs, some of which have only one item per value, it was not possible to take these finer distinctions into account.
The reasoning underlying our hypotheses regarding national differences in
associations among the HOVs was based on the ease or difficulty of individual members of society to satisfy their basic needs. As a proxy for ease of satisfying basic needs, we chose gross national income per capita based on purchasing power parity in current international
dollars. It measures average earnings of the residents of an economy, and it “is a good measure of its capacity to provide for the well-being of its people” (labeled GNIpc here; World Bank, 2018). GNIpc values were selected for the year corresponding to each ESS round and WVS wave, and the year 2000 for the SVS samples. We used the logarithm of GNIpc in order to normalize its distribution. Because country wealth correlates with other important characteristics of development, we used two controls: education as measured by average years of schooling (United Nations Development Programme, 2016) and income inequality as measured by Gini index (World Bank, 2018). Correlations between GNIpc (logarithm) with years of schooling ranged from 0.26 to 0.63 in different years; between GNIpc and Gini index it varied from -0.53 to -0.13; and between schooling and Gini index the range was -0.17 and -0.69.
Table 2 about here
Analyses
We aimed to assess the signs and magnitudes of relations between particular values. Multidimensional scaling, which is frequently used to assess the overall value structure, captures the relative distances between variables but does not provide the information needed to test our hypotheses. Pearson correlations provide the needed information. We computed all correlations within countries, thereby excluding the country-level covariance of values. Thus, these correlations represent the country-specific associations between pairs of values.
In order to correctly aggregate correlations across surveys and samples, differing in sample size, time points, instruments, and unequal occurrence of countries, we used meta-analytic random- and mixed-effects regression models (Raudenbush, 2009). These models treated correlations as estimated random effects, with a standard error attached to them so that it yielded unbiased average estimates of within-country correlations. Additionally, they are convenient for estimating the effects of predictors such as survey or GNIpc.
Sample size was the index of uncertainty for computing standard errors. We did not weight the magnitude of estimates by the size of country population, so the reported
coefficients assume equal impact of each sample. We estimated the models with restricted maximum likelihood, using the R package "metafor" (Viechtbauer, 2010).
First, we computed the correlations within each of 376 country samples using sampling weights where they were available. Next, we estimated a random-effects meta-analytical model for each survey (models M1-M10). Then, we fitted an overall model based on all the 376 samples (M11). Next, we fitted three mixed-effects models across all the samples, including survey and GNIpc as predictors (M12), and, in addition to GNIpc, controlling for education level (M13) or for education and inequality (M14).5
Results
Correlations Between the Pairs of Higher Order Values (HOVs)
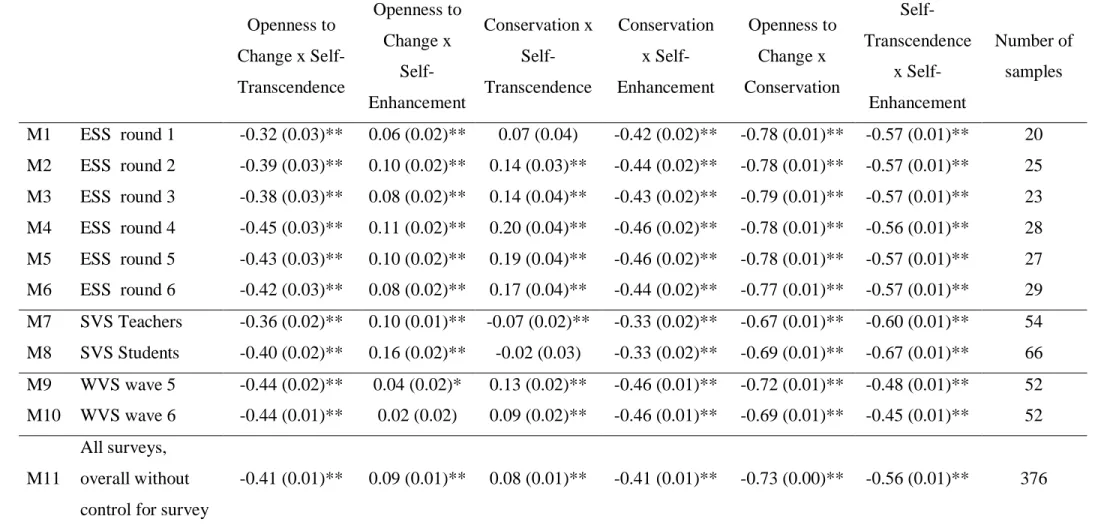
Table 3 summarizes the estimated within-country correlations between HOVs in six rounds of the ESS, two sets of SVS samples, and two waves of the WVS. The last column of Table 3 lists the number of samples in each analysis. The signs of the estimated within-country correlation coefficients between HOVs supported our hypotheses. Specifically, the correlations of openness to change with transcendence and of conservation with enhancement were strong and negative; and the correlations of openness to change with self-enhancement and of conservation with self-transcendence were positive. Correlations of openness to change with conservation and of self-transcendence with self-enhancement were negative.
Looking down each column reveals that correlations between the pairs of HOVs are fairly similar across surveys and almost all are significant. There were very few deviations: the sign of the correlations between conservation and self-transcendence reversed for teachers
in the SVS samples. In two cases, the correlations did not reach statistical significance: correlations between conservation and self-transcendence in student SVS samples and correlations between openness to change and self-enhancement in WVS wave 6. These few exceptions notwithstanding, the set of correlations revealed highly consistent findings across the surveys and years.
Inspecting specific correlations by sample (not shown), we found negative correlations between openness to change and self-transcendence values and between conservation and self-enhancement values in 375 of 376 samples. The correlations ranged from –0.72 to 0.08. The signs of the correlations between openness to change and self-enhancement and between conservation and self-transcendence varied, but were
predominantly positive, ranging from -0.36 to 0.60 and from -0.45 to 0.55, respectively. Correlations between opposing HOVs (i.e., openness to change with conservation and self-enhancement with self-transcendence) were negative in all samples and ranged from -0.45 to -0.86 and from -0.26 to -0.76, respectively.
Model M11 provides the overall estimates of the within-country correlations. The overall correlation estimates in M11 also supported our hypotheses. An additional model controlling for survey (reported in the Online supplementary materials, Table S2) showed significant Cochran's Q tests for all six types of correlations. This signifies substantial
between-country heterogeneity in the correlations. Figure 2 illustrates this heterogeneity with the data from the sixth round of the ESS. In this survey, the correlations of openness to change with self-transcendence and of conservation with self-enhancement were strong and negative in all countries. The same was true for the opposing HOVs. The opposing HOVs showed consistently negative correlations ranging from -0.85 to -0.42. Contrasting with this consistency, correlations of openness to change with self-enhancement are positive in 14/29 countries and those of conservation with self-transcendence were positive in 20/29 countries.
Table 3 and Figure 2 about here
Relations of GNIpc to the Within-Country Correlations Between the Higher Order Values
Table 4 presents the effects of GNIpc on the within-country correlations between the HOVs. Model M12 employed GNIpc as a single predictor in addition to survey, Model M13 added a control for education level, and Model 14 added a control for income inequality. Models M13 and M14 differ in the number of countries included due to missing national data. Twelve samples did not have average years of schooling and 165 (44% of samples) did not have income inequality (Gini index) data. Tables S3 to S5 (in the Online Supplementary Materials) report full tables of coefficients including effects of survey and model fit of models M12 to M14.
These models demonstrated that the within-country correlations of the adjacent HOVs correlate robustly with GNIpc, in line with our hypotheses. Controlling for education and income inequality made these results even more salient. This supports the specific importance of the economic aspect of development. The standardized coefficients in models M13 and M14, respectively, revealed that the higher the GNIpc in a country:
(1) the less negative and closer to zero the correlation of openness to change values with self-transcendence values (b = .11; .15, p <.01),
(2) the less positive or more negative the correlation of openness to change values with self-enhancement values (b = –.06; –.07, p <.01),
(3) the less positive or more negative the correlation of conservation values with self-transcendence values (b= –.12; –.17, p <.01), and
(4) the less negative and closer to zero the correlation of conservation values with self-enhancement values (b = .08; .08, p <.01).
Combining these findings with the correlations between HOVs, it is clear that higher GNIpc was accompanied by weaker correlations between adjacent HOVs. The results indicate that adjacent HOVs were more independent of one another in more economically developed countries. To highlight the moderating role of country economic advancement on correlations between HOVs, Figure 3 shows the association of GNIpc with the correlation between openness to change and self-transcendence values with data from ESS round 6. Higher levels of GNIpc are accompanied with less negative correlations, that is, with higher independence of these HOVs. In less economically developed countries, self-transcendence and openness to change values are strongly and negatively related.
The hypotheses concerning the association of GNIpc with the correlations between the opposite HOVs were not supported: Without controls, higher GNIpc was, contrary to expectations, associated with stronger negative correlations between openness to change and conservation as well as between self-enhancement and self-transcendence. After controlling for years of schooling and/or income inequality, the coefficients of GNIpc became small and insignificant.
Figure 3 about here
We further assessed the explanatory power of each of the predictors (see Online Supplementary Materials, Table S6). GNIpc alone explained up to 40% of differences of HOVs’ correlations, whereas schooling explained not more than 13%, and income inequality less than 9%.
To check the robustness of these conclusions, we refitted models M12 to M14 separately for each survey (Online Supplementary Materials, Tables S7-S9). This check largely confirmed our conclusions: Aside from a few minor deviations, examining the surveys separately and controlling for education and inequality minimally changed the signs and magnitudes of the GNIpc effects.
We also note the effects of the control variables on correlations between HOVs. As shown in Table 4, schooling significantly affected the correlations between all the HOVs (M13). Surprisingly, however, the coefficients for schooling were opposite to those for GNIpc. Higher schooling was associated with stronger interrelations of HOVs. Income inequality (Gini) had no effect on most HOVs’ correlations, with the exception of the correlations between openness to change and conservation values.
Discussion and Conclusions
The current study is the first to describe the signs and strength of associations among the four HOVs. Using meta-analytic random- and mixed-effects models, we estimated a series of within-country correlations of HOVs and the effects of country economic
development on them. Within-country relations between the HOVs supported our hypotheses. The overall correlations between openness to change and self-enhancement and between conservation and self-transcendence were positive and indicated that these values are predominantly congruent with one another (H1a). The correlations of openness to change with self-transcendence and of conservation with self-enhancement were negative in all the surveys and indicated that these values are consistently incongruent. As expected (H2b), correlations between opposing HOVs were negative in all the samples studied. These findings indicate that the two HOV dimensions proposed by Schwartz (1992), namely conservation versus openness to change and self-enhancement versus self-transcendence are
not independent in most countries, and that this is especially true in the less developed ones.
The correlations between HOVs were robust across surveys that used three different measurement instruments (PVQ-21, SVS, WVS) and sample types, across different sets of countries (both European and non-European), and across time points. Out of 60 overall correlations from the 10 surveys, only one correlation had a sign opposite to the hypothesized direction and only two correlations were not significant.
The substantial and meaningful cross-country variability of correlations between adjacent HOVs supported hypothesis H3. GNIpc was negatively associated with the within-country correlations between conservation and self-transcendence values and between openness to change and self-enhancement values. GNIpc was positively associated with the within-country correlations between conservation and self-enhancement values and between openness to change and self-transcendence values. Country differences in correlations between HOVs can be summarized as follows: The adjacent HOVs are more independent of each other in more developed countries; this yields a more differentiated value structure in these more economically developed countries. Put differently, higher complexity of value structures accompanies increased economic development.
We use the term complexity in a manner similar to the concept of cognitive
complexity that is used to describe the degree of differentiation of constructs (Bieri, 1955). We suggest that value complexity is a useful construct for describing cultural differences. Value complexity may be related to cognitive complexity. This merits exploration both at the country and individual levels. Previous research has identified stronger conflict between Growth and Self-Protection values in more developed countries. We have shown how systematic this trend is and how it relates to the overall complexity of value structures.
Contrary to our expectation, negative correlations between opposing HOVs did not vary with the level of a country’s economic development. Apparently, these value
oppositions are robust to the economic development of countries.
What do these correlations imply for the overall structure of values? We suggest that values are organized according to their position within the two broader oppositions of Social versus Person Focus and Growth versus Self-Protection. The overall pattern of correlations among HOVs reflects Social versus Person Focus opposition: The two HOVs that constitute each pole of this axis correlate positively and both HOVs in the Social pole correlate
negatively with both HOVs in the Person Focus pole. The other broad value opposition of Growth versus Self-Protection values is weaker, especially in less economically developed countries. It is, however, more pronounced in more economically developed countries. This opposition finds expression in greater congruence (in this case, less incongruence) between the two HOVs that constitute each pole of the Growth versus Self-Protection opposition, and greater incongruence (in this case, less congruence) between the two HOVs that constitute the Growth values pole and the two HOVs that constitute the Self-Protection pole. Broadly stated, the value structure tends to be unidimensional in less developed countries, but two-dimensional in more developed countries (see also Strack & Dobewall, 2012). This implies that the structure of HOVs becomes more complex as societies become more economically developed.
The country level of schooling had a substantial effect on the HOV correlations. Unexpectedly, the effect was opposite to the effects of the country economic development. Thus, the higher the level of schooling in a country, controlling for GDP, the less complex the value structure and the more it was dominated by the Social versus Person Focus
opposition. This might well be a result of confounding because years of schooling correlated with GDP across samples. At the same time, this schooling effect may be real as well. An emphasis on Social vs. Person focused values may be central to the open and hidden
curriculum, to the teaching of moral reasoning, and to the role models presented in schools. The standardizing role of school education (cf. Ilyich, 1970; Freire, 1972 ) may, therefore, promote sorting values along the basic Social vs. Person Focus opposition. Future research is needed to clarify these relations by focusing on more specific characteristics of education such as quality, involvement at different stages, education policy, competencies, etc.
The findings of the current study, taken together with previous findings (Schwartz, 2006; Fischer et al., 2011; Gouveia et al., 2014;Strack & Dobewall, 2012), point to the
heuristic value of the Social versus Person Focus and Growth versus Self-Protection
oppositions. So far, these two broader value dimensions have not been widely used. We suggest that they substantially add to the description and explanation of individual and cultural differences. They help to identify variation in the structure of relations among values that goes beyond variation in value importance. However, further research is needed to shed more light on their external validity and cross-cultural reliability.
One might question whether the findings of cross-country differences in correlations are due to a methodological artifact resulting from a lack of measurement invariance (i.e., from differences in construct–indicator relations). For example, Davidov, Dülmer, Schlüter, Schmidt, and Meuleman (2012) linked variation in parameters of universalism value items to country economic development, whereas Fontaine et al. (2008) and Bilsky et al. (2011) linked similar variation to relations between the latent variables. We think that our findings point to a lack of structural invariance (i.e., concerned with relations between latent
constructs) rather than measurement invariance. Indeed, it is highly implausible that the same pattern of measurement bias would replicate with three different instruments and across differing samples. Much more plausible are structural differences, that is, differences in the substantial relations between the HOVs themselves rather than between their specific indicators.
The current study contributes to theory building by helping to explain puzzling outcomes reported in the literature. For instance, Davidov et al. (2008) reported that self-transcendence values affect unconditional pro-immigrant attitudes more strongly in richer than in poorer countries. Our finding that self-transcendence has weaker associations with openness to change in richer countries may explain this outcome. Davidov et al. (2008) controlled for conservation but did not include openness to change values in their analyses. Assuming that openness to change values have a positive effect on pro-immigrant attitudes,
the absence of this predictor in analyses might affect the results: In less developed countries, the self-transcendence scores might reflect both higher self-transcendence and lower
openness to change values. So, the stronger negative associations of self-transcendence with openness to change might suppress the positive effect of self-transcendence scores on pro-immigrant attitudes in less developed countries. In contrast, in more developed countries these variables would not have been confounded because corresponding HOVs are weakly related. That may have permitted clearer and stronger associations to emerge between self-transcendence values and pro-immigrant attitudes in the more developed countries.
Theoretically, this suggests a value syndrome in less developed countries that merges self-transcendence values with conservation, making it hard to separate their effects from each other.
The structure of congruence and conflict between values has been central to the value theory since its inception (Schwartz, 1992). The current article makes this structure more transparent and sheds light on the underlying latent structure of human values.
References
Bieri, J. (1955) Cognitive complexity-simplicity and predictive behavior. Journal of
Abnormal and Social Psychology, 51(2), 263-268. doi:10.1037/h0043308
Bilsky, W., Janik, M., & Schwartz, S. H. (2011). The structural organization of human values: Evidence from three rounds of the European Social Survey (ESS). Journal of
Cross-Cultural Psychology, 42(5), 759-776. doi:10.1177/0022022110362757
Borg, I., Bardi, A., & Schwartz, S. H. (2017). Does the value circle exist within persons or only across persons? Journal of Personality, 85(2), 151-162. doi:10.1111/jopy.12228 Davidov, E., Dülmer, H., Schlüter, E., Schmidt, P., & Meuleman, B. (2012). Using a
multilevel structural equation modeling approach to explain cross-cultural
measurement noninvariance. Journal of Cross-Cultural Psychology, 43(4), 558-575. doi:10.1177/0022022112438397
Davidov, E., Meuleman, B., Billiet, J., & Schmidt, P. (2008). Values and support for immigration: A cross-country comparison. European Sociological Review, 24(5), 583-599. doi:10.1093/esr/jcn020
Fischer, R., Milfont, T. L., & Gouveia, V. V. (2011). Does social context affect value structures? Testing the within-country stability of value structures with a functional theory of values. Journal of Cross-Cultural Psychology, 42(2), 253-270.
doi:10.1177/0022022110396888
Fontaine, J. R., Poortinga, Y. H., Delbeke, L., & Schwartz, S. H. (2008). Structural
equivalence of the values domain across cultures distinguishing sampling fluctuations from meaningful variation. Journal of Cross-Cultural Psychology, 39(4), 345-365. doi:10.1177/0022022110396888
Gollan, T., & Witte, E. H. (2014). From the interindividual to the intraindividual level is the circumplex model of values applicable to intraindividual value profiles? Journal of
Cross-Cultural Psychology, 45(3), 452-467. doi:10.1177/0022022113509885
Gouveia, V. V., Milfont, T. L., & Guerra, V. M. (2014). Functional theory of human values: Testing its content and structure hypotheses. Personality and Individual Differences,
60, 41-47. doi:10.1016/j.paid.2013.12.012
Guttman, L. (1954). A new approach to factor analysis: The Radex. In P. F. Lazarsfeld (Ed.),
Mathematical thinking in the social sciences (pp. 258-348). New York: Free Press.
llich, I. (1970). Deschooling Society. New York: Marion Boyars.
Jowell R., Roberts C., Fitzgerald R., & Eva G. (Eds.). (2007). Measuring attitudes
cross-nationally: Lessons from the European Social Survey. London: Sage.
Magun, V., Rudnev, M., & Schmidt, P. (2016). Within and between-country value diversity in Europe: A typological approach. European Sociological Review, 32(2), 189-202. doi: 10.1093/esr/jcv080
Maslow, A. H. (1970). Religions, values, and peak experiences. New York: Penguin.
Raudenbush, S. W. (2009). Analyzing effect sizes: Random-effects models. In H. Cooper, L. V. Hedges, & J. C. Valentine (Eds.), The handbook of research synthesis and
meta-analysis (2nd ed., pp. 295-315). New York: Russell Sage Foundation.
Rokeach, M. (1973). The nature of human values. New York: The Free Press.
Schwartz, S. H. (1992). Universals in the content and structure of values: Theory and empirical tests in 20 countries. In M. Zanna (Ed.), Advances in experimental social
psychology (Vol. 25, pp 1-65). New York: Academic Press.
doi:10.1016/S0065-2601(08)60281-6
Schwartz, S. H. (1994). Are there universal aspects in the structure and contents of human values? Journal of Social Issues, 50, 19-45. doi:10.1111/j.1540-4560.1994.tb01196.x
Schwartz, S. H. (1996). Value priorities and behavior: Applying a theory of integrated value systems. In C. Seligman, J. M. Olson, & M. P. Zanna (Eds.), The psychology of
values: The Ontario symposium (Vol. 8, pp. 1-24). Hillsdale, NJ: Erlbaum.
Schwartz, S. H. (2003). Value orientations. European Social Survey Core Questionnaire
Development, Chapter 7. Retrieved from
http://www.europeansocialsurvey.org/docs/methodology/core_ess_questionnaire/ESS _core_questionnaire_human_values.pdf
Schwartz, S. H. (2005). Human values. European Social Survey EDUNET. Retrieved from http://essedunet.nsd.uib.no/cms/topics/1/
Schwartz, S. H. (2006). Les valeurs de base de la personne: Théorie, mesures et applications [Basic personal values: Theory, measurement, and application]. Revue Française de
Sociologie, 42, 249-288. doi:10.3917/rfs.474.0929
Schwartz, S. H. (2007). Value orientations: Measurement, antecedents and consequences across nations. In R. Jowell, C. Roberts, R. Fitzgerald, & G. Eva (Eds.) Measuring
attitudes cross-nationally: Lessons from the European Social Survey (pp. 161-193).
London: Sage.
Schwartz, S. H. (2015). Basic individual values: Sources and consequences. In D. Sander & T. Brosch (Eds.), Handbook of value (pp.63-84). Oxford: Oxford University Press. Schwartz, S. H., & Bilsky, W. (1987). Toward a universal psychological structure of human
values. Journal of Personality and Social Psychology, 53(3), 550-562. doi:10.1037/0022-3514.53.3.550
Schwartz, S. H., & Sagiv, L. (1995). Identifying culture-specifics in the content and structure of values. Journal of Cross-Cultural Psychology, 26(1), 92-116.
Schwartz, S. H., Verkasalo, M., Antonovsky, A., & Sagiv, L. (1997). Value priorities and social desirability: Much substance, some style. British Journal of Social Psychology,
36, 3-18. doi:10.1111/j.2044-8309.1997.tb01115.x
Steinmetz, H., Isidor, R., & Baeuerle, N. (2012). Testing the circular structure of human values: A meta-analytical structural equation modelling approach. Survey Research
Methods, 6(1), 61-75. doi:10.18148/srm/2012.v6i1.5096
Strack, M., & Dobewall, H. (2012). The value structure in socioeconomically less developed European countries still remains an ellipse. Europe's Journal of Psychology, 8(4), 587-602. doi:10.5964/ejop.v8i4.505
Tetlock, P. E. (1986). A value pluralism model of ideological reasoning. Journal of
Personality and Social Psychology, 50, 819-827.
The United Nations Development Programme (2016). Human Development Report
2016-Human Development for Everyone. New York: UNDP.
Viechtbauer, W. (2010). Conducting meta-analyses in R with the metafor package. Journal of
Statistical Software, 36(3), 1-48. doi:10.18637/jss.v036.i03
The World Bank (2018). World Development Indicators. [Data file]. Retrieved from http://databank.worldbank.org
Table 1
Hypothesized Within-Country Associations Among the HOVs and Their Variation as a Function of Socioeconomic Development
Openness to Change Conservation Self-Transcendence
Self-Enhancement positive (H1b) negative (H2a) negative (H2b)
Self-Transcendence negative (H2b) positive (H1a)
Conservation negative (H2a)
All correlations are hypothesized to be smaller in magnitude in countries with higher economic development (H3).
Table 2 Summary of Surveys Survey N countries/ samples Type of sample N after removing missing Year of survey Instrument European Social Survey – round 1 20 National representative 37,549 2002 Portrait Value Questionnaire, 21 items (PVQ-21) European Social Survey – round 2 25 National representative 44,487 2004 PVQ-21 European Social Survey – round 3 23 National representative 41,471 2006 PVQ-21 European Social Survey – round 4 28 National representative 53,366 2008 PVQ-21 European Social Survey – round 5 27 National representative 51,240 2010 PVQ-21 European Social Survey – round 6 29 National representative 53,924 2012 PVQ-21 Schwartz Value Survey - teachers 54 School teachers 14,549 1988-2004 Schwartz Value Survey, 57 items (SVS) Schwartz Value Survey - students 66 University students 24,479 1988-2004 SVS World Values Survey – Wave 5 52 National representative 72,566 2004-2008 10 items modified from PVQ World Values Survey – Wave 6 52 National representative 72,416 2009-2012 10 items further modified from PVQ Total 104 countries 376 samples 466,047
Table 3. Within-country correlations between HOVs in 10 surveys as estimated by 11 meta-analytic random effects models (standard error in parentheses). Openness to Change x Self-Transcendence Openness to Change x Self-Enhancement Conservation x Self-Transcendence Conservation x Self-Enhancement Openness to Change x Conservation Self-Transcendence x Self-Enhancement Number of samples M1 ESS round 1 -0.32 (0.03)** 0.06 (0.02)** 0.07 (0.04) -0.42 (0.02)** -0.78 (0.01)** -0.57 (0.01)** 20 M2 ESS round 2 -0.39 (0.03)** 0.10 (0.02)** 0.14 (0.03)** -0.44 (0.02)** -0.78 (0.01)** -0.57 (0.01)** 25 M3 ESS round 3 -0.38 (0.03)** 0.08 (0.02)** 0.14 (0.04)** -0.43 (0.02)** -0.79 (0.01)** -0.57 (0.01)** 23 M4 ESS round 4 -0.45 (0.03)** 0.11 (0.02)** 0.20 (0.04)** -0.46 (0.02)** -0.78 (0.01)** -0.56 (0.01)** 28 M5 ESS round 5 -0.43 (0.03)** 0.10 (0.02)** 0.19 (0.04)** -0.46 (0.02)** -0.78 (0.01)** -0.57 (0.01)** 27 M6 ESS round 6 -0.42 (0.03)** 0.08 (0.02)** 0.17 (0.04)** -0.44 (0.02)** -0.77 (0.01)** -0.57 (0.01)** 29 M7 SVS Teachers -0.36 (0.02)** 0.10 (0.01)** -0.07 (0.02)** -0.33 (0.02)** -0.67 (0.01)** -0.60 (0.01)** 54 M8 SVS Students -0.40 (0.02)** 0.16 (0.02)** -0.02 (0.03) -0.33 (0.02)** -0.69 (0.01)** -0.67 (0.01)** 66 M9 WVS wave 5 -0.44 (0.02)** 0.04 (0.02)* 0.13 (0.02)** -0.46 (0.01)** -0.72 (0.01)** -0.48 (0.01)** 52 M10 WVS wave 6 -0.44 (0.01)** 0.02 (0.02) 0.09 (0.02)** -0.46 (0.01)** -0.69 (0.01)** -0.45 (0.01)** 52 M11 All surveys, overall without control for survey
-0.41 (0.01)** 0.09 (0.01)** 0.08 (0.01)** -0.41 (0.01)** -0.73 (0.00)** -0.56 (0.01)** 376
Table 4
Standardized Effects on the Within-Country Correlations Between HOVs, Controlled for Surveys (Standard Errors in Parentheses)
Openness to Change x Self-Transcendence Openness to Change x Self-Enhancement Conservation x Self-Transcendence Conservation x Self-Enhancement Openness to Change x Conservation Self-Transcendence x Self-Enhancement
M12. Economic advancement only (369 samples)
log GNIpc (PPP, current
international dollar) 0.09 (0.01)** -0.01 (0.01) -0.09 (0.01)** 0.05 (0.01)**
-0.01
(0.00)** -0.02 (0.00)**
M13. Economic advancement and education (363 samples)
log GNIpc (PPP, current
international dollar) 0.11 (0.01)**
-0.06
(0.01)** -0.12 (0.01)** 0.08 (0.01)** 0.00 (0.00) -0.01 (0.01) Average years of schooling -0.03 (0.01)** 0.06 (0.01)** 0.04 (0.01)** -0.04
(0.01)**
-0.02
(0.00)** -0.02 (0.01)**
M14. Economic advancement, education, and income inequality (211 samples)
log GNIpc (PPP, current
international dollar) 0.15 (0.01)**
-0.07
(0.01)** -0.17 (0.02)** 0.08 (0.01)** 0.01 (0.01) 0.00 (0.01) Average years of schooling -0.02 (0.01) 0.07 (0.01)** 0.03 (0.02) -0.04
(0.01)** -0.01 (0.01) -0.02 (0.01)* Gini income inequality
Figure 2. Within-country correlations (and confidence intervals) between HOVs in 29 European countries (ESS, round 6).
Figure 3. Correlations of country economic level with the within-country correlation of openness to change values with self-transcendence values in 28 European countries (data from the 6th round of the European Social Survey).