Elson Neves Simões
Competitive Intelligence Algorithm
for PESTLE Analysis
A Decision Support System Application module
Project Work presented as partial requirement for obtaining
the Master’s degree in Information Management
NOVA Information Management School
Instituto Superior de Estatística e Gestão de Informação Universidade Nova de Lisboa
COMPETITIVE INTELLIGENCE ALGORITHM FOR PESTLE ANALYSIS
by Elson Neves Simões Project Work report presented as partial requirement for obtaining the Master’s degree in Information Management, with a specialization in Knowledge Management and Business Intelligence. Advisor: Mauro Castelli Co Advisor: Luis Madureira November 2019
D
EDICATIONTo my mother Isabel, to whom I will be forever grateful for giving me the most precious thing I have, my education and my principles. To my brothers Alexandre and Lucas of whom I am so proud. To my best friend and girlfriend Catarina Baptista, thank you for all your support and patience with me, you make everything easier. And to all my friends which I am very lucky to have in my life.
ABSTRACT
In today’s competitive environment, board directors of companies strive to make the right decisions that will put them ahead of their competitors. However due to the volatility of the company’s external environments any decision has its inherent risks. This thesis aims to apply the Python Programming Language to develop a specific module of a Decision Support Tool that intends to predict market movements, trading position and potential, and operations orientation. The module that will be the scope of this thesis will consist in the creation of a predictive model for countries political factors based in public databases with political indexes all over the globe. This module refers to the first factor to consider in a PESTLE analysis.KEYWORDS
DSS; Competitive Intelligence; PESTLE; Python; Neural NetworksINDEX 1. INTRODUCTION ... 10 2 LITERATURE REVIEW ... 11 2.1 DIKIW Hierarchy ... 11 2.1.1 DATA ... 12 2.1.2 INFORMATION ... 13 2.1.3 KNOWLEDGE... 14 2.1.4 INTELLIGENCE ... 15 2.1.5 WISDOM ... 15 2.2 COMPETITIVE INTELLIGENCE ... 16 2.3 ARTIFICIAL NEURAL NETWORKS ... 19 2.4 NEURAL NETWORK ARCHITECTURES ... 22 2.5 PESTLE ... 23 2.6 COMPETITIVE ANALYSIS TOOLS ... 27 2.6.1 Porter’s Five Forces Analysis ... 28 2.6.2 SWOT Analysis ... 30 2.6.3 PESTLE Analysis ... 31 2.7 IMPORTANCE OF PESTLE ANALYSIS ... 33 2.8 IMPORTANCE OF AUTOMATING PESTLE ANALYSIS ... 36 2.9 IMPROVEMENT OF PESTLE ANALYSIS USING NEURAL NETWORKS ... 38 2.10 DECISION SUPPORT TOOLS ... 39 2.11 PYTHON PROGRAMMING AND ITS APPLICATION TO DECISION SUPPORT TOOLS ... 41 3 METHODOLOGY ... 43 3.1 DATA SOURCES ... 43 3.2 DATA MANIPULATION ... 44 3.3 NEURAL NETWORK CONSTRUCTION AND TRAINING ... 46 3.3.1 Defining predictors and targets ... 47 3.3.2 Define the Neural Network model ... 48 3.3.2.1 Comparing performances ... 49 3.3.3 USAGE OF THE MODEL_2 TO PREDICT THE 2018 INDEXES ... 49
4 RESULTS AND DISCUSSION ... 50 5 CONCLUSIONS ... 52 6 LIMITATIONS AND RECOMMENDATIONS FOR FUTURE DEVELOPMENTS ... 53 7 Bibliography ... 54 8 Appendix ... 58 8.1 Code screenshots ... 58 8.1.1 Worldwide Governance Indicators Manipulation ... 58 8.1.2 Index of Economic Freedom ... 59 8.1.3 Transparency International ... 60 8.1.4 Doing Business Law Library ... 61 8.1.5 General Manipulation ... 62 8.1.6 Validation of the predictors shape ... 63 8.1.7 ADAM TESTING ... 64 8.1.8 SGD TESTING ... 65 8.1.9 Comparing performances of model_1 and model_2 ... 66 8.1.10 Results of the model_1 (Adam with lr=0.000015) ... 67 8.1.11 Results of the model_2 (SGD with lr=0.000015): ... 68
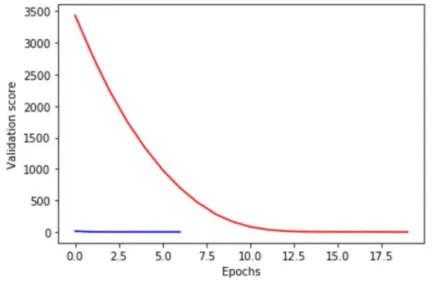
LIST OF FIGURES Figure 1 DIKIW schema ... 12 Figure 2 Formation of Information and Data (from Liew, 2007) ... 14 Figure 3 Intelligence Cycle (from Garcia‐Alsina et al., 2016) ... 17 Figure 4 The competitive intelligence process (from Pellissier & Nenzhelele, 2013) ... 18 Figure 5 Mammalian neuron (Ajith Abraham, 2005) ... 20 Figure 6 Architecture of an artificial neuron and a multi‐layered neural network (Ajith Abraham, 2005) ... 21 Figure 7 Different types of activation functions: (a) threshold, (b) piecewise linear, (c) sigmoid and (d) Gaussian (Jain et al., 1996) ... 21 Figure 8 A typical feed‐forward network architecture. (Jain et al., 1996) ... 22 Figure 9 Backpropagation steps (Jain et al., 1996) ... 23 Figure 10 The format of a systemic PEST analysis diagram (HO, 2014) ... 27 Figure 11 Data manipulation schema ... 45 Figure 12 Input and target schema ... 45 Figure 13 Neural network construction with KERAS ... 46 Figure 14 Screenshot of the final data structure ... 47 Figure 15 Comparison graphic of the validation scores of model_1 and model_2 ... 49 Figure 16 Screenshot of the prediction’s execution ... 49 Figure 17 Power BI map with the top 10 of the predictions ... 51
LIST OF TABLES Table 1 Von Neumann computer versus biological neural system (Jain et al., 1996) ... 19 Table 2 Detailed sub‐factors of the PESTLE framework ... 26 Table 3 Political Indexes data sources ... 44 Table 4 Years of Predictors and Targets ... 47 Table 5 Prediction Values ... 50 Table 6 Comparison between 2017 real values against 2018 predictions ... 50
LIST OF ABBREVIATIONS AND ACRONYMS AI Artificial Intelligence ANN Artificial Neural Network BI Business Intelligence CI Competitive Intelligence DSS Decision Support Systems ICT Information and communication technologies IoT Internet of Things GP Genetic Programming NN Neural Network PESTLE Marketing framework
1. INTRODUCTION
Nowadays companies strive to beat their competitors in many ways; mergers and acquisitions; exports; research and development and many other possible moves with the purpose of beating their competitors and be the best in their industry. However, there is an always inherent risk associated with any move that pursues a profitable outcome, and that risks are mainly due to the speculation board directors need to do to take the right decisions. Those speculations are far from being simple ones, the variables they need to consider are uncountable going from political speculation to technological, economic, social considerations and so on.
This thesis is part of a project that has the intent to diminish the uncertainties of a company when it comes to decision making with the development of a decision support system software that will provide board directors with the framework and data analysis from open sources databases and any information available online to weight and reduce as much as possible any speculation in any decision they could make for the future of their companies. Considering the complexity of such software the scope of this thesis it will be focused in only one of the modules of the software that consists in a Competitive Intelligence Algorithm based in a framework used by marketers to analyse and monitor the macro‐ environmental factors that have an impact on an organization, the PESTLE analysis. It is a self‐explanatory framework hence its name is built through the initials of each factor it considers for making the analysis of the external environment of a company: P stands for the political factors; E regards the economic factors; S stands for social factors; T stands for technological factor; L for legal factors and E for environment. The programming language chosen to build this, and the following modules, is python and the reasons to be this language are related with its efficiency and simplicity and for having an active community and being part of the academia world. For this specific module it will be used an artificial intelligence algorithm known as neural network to meet the de desired outcome.
2 LITERATURE REVIEW
2.1 DIKIW Hierarchy
“Data is fool’s gold. Insight is pure gold” (Shepherd M. 2018) Considering that the main purpose of the DSS application, and consequently this module is to get insights from data, meaning to transform data into wisdom, for companies to reduce their risks when it comes to take decisions that can have great financial impact, it is imperative that I start by exposing the origin of the framework that explains the process of that transformation.
The first mention of a framework that exposes the transformation from Data to Information and from Knowledge to Wisdom was not mentioned within the Knowledge Management domain nor Information Science but in poetry (Sharma, 2008). The poet T.S. Eliot was the first to mention the “DIKW hierarchy”. In 1934 Eliot wrote in “The Rock”: (1). “Where is the Life we have lost in living? Where is the wisdom we have lost in knowledge? Where is the knowledge we have lost in information?” Cleveland (1982) in his article “Information as Resource” uses Eliot’s hierarchy as a starting point to explain the basic terms of the DIKW hierarchy. In Anthony Liew (2013) adds another layer to the hierarchy, Intelligence, giving origin to the DIKIW hierarchy that result in the schema below.
Figure 1 DIKIW schema
2.1.1 DATA
Data is a set of values of subjects with respect to qualitative or quantitative variables. The Latin word data is the plural of datum, “(thing) given,” neuter past participle of dare “to give”.1 Taking in consideration that data is the foundation of wisdom it is curious that the origin of the word itself means “to give” when nowadays data can give us infinite insights about any scientific and non‐scientific domains. In June 2018, 55.1% (4,208 million of users) of the world population had access to Internet. 2 Due to the constant technology evolution and with the constant increase of internet users, data generation has given place to what is called Big Data. Today we produce around 2.5 quintillion bytes of data each day 3 and with the rise of IoT this number will only increase the generation of data from infinity of connected devices. Big data can be divided in four dimensions: Volume, Velocity, Variety and Veracity.4 As per Kenneth Neil Cukier and Viktor Mayer‐Schoenberger in their book “Big Data: A Revolution That Will Transform How We Live, Work, and Think”, “Causality won’t be discarded but it is being knocked off its pedestal as the primary foundation of meaning. Big data turbocharges non‐casual analyses, often replacing casual investigations.” This
observation made by the authors is exactly what the globality of this project intends to address, provide to the C‐suite of a company a DSS application that will put aside any casual analyses but instead give them a data‐driven measurable risk of their management decisions.
2.1.2 INFORMATION
Today there is no consensus across disciplines about a single definition of information. That lack of consensus resides for example in the different definitions about information that a physician a poet and a data scientist can have. Through the development of this thesis the definition of Information will be carried as an Information Science approach. The origin of the word Information comes from the junction of the Latin words in and forma that adapted to English are the words into and shape respectively. Therefore, information is no more than structure unstructured data, to give form to it. “Information is contained in descriptions, answers to questions that begin with such words as who, what, when, where, and how many.”(Ackoff, 1989). Information tells us “about” something else. Random data wouldn’t be information, it would be “noise: random fluctuations that obscure or do not contain meaningful data” (https://en.oxforddictionaries.com/definition/noise). Information is data presented in a context that yields meaning. The way data is structured is inherent to the context of its structuring. (Bates, 1999) One aspect that this project attempts to overcome is to avoid misleading conclusions through miscomprehension of data itself because one’s context. “Information is a message that contains relevant meaning, implication, or input for decision and/or action. Information comes from both current (communication) and historical (processed data or ‘reconstructed picture’) sources. In essence, the purpose of information is to aid in making decisions and/or solving problems or realizing anThe following diagram illustrates the relationship between data and information: Figure 2 Formation of Information and Data (from Liew, 2007)
2.1.3 KNOWLEDGE
As per the Cambridge Dictionary, Knowledge is the awareness, understanding, or information that has been obtained by experience or study, and that is either in a person’s mind or possessed by people generally. Knowledge “is information combined with experience, context, interpretation, and reflection. It is a high‐value form of information that is ready to apply to decisions and actions.” (Brodie & Brodie, 2009)as cited in Davenport & Prusak, 1998) (Brodie & Brodie, 2009). “is know‐how and is what makes possible the transformation of information into instructions. Knowledge can be obtained either by transmission from another who has it, by instruction, or by extracting it from experience” Ackoff (1989). Knowledge can be considered tacit knowledge or explicit knowledge. Tacit knowledge can only be transferred through socialization, shared experiences or practices. Explicit knowledge is tacit knowledge that is possible to be articulated to explicit knowledge and can be transferred through any type of information. (Nonaka Hirotaka, 1995).In “Understanding Data, Information, Knowledge and Their Inter‐Relationships”, A. Liew refers that the purpose of knowledge in the context of business is to create or increase value for the enterprise and all its stakeholders.
2.1.4 INTELLIGENCE
Merriam‐Webster dictionary defines intelligence as the ability to learn or understand or to deal with new or trying situations. It also defines intelligence as the ability to apply knowledge to manipulate one’s environment or to think abstractly as measured by objective criteria. Ackoff in “Data to Wisdom” defines intelligence as the ability to increase efficiency. Intelligence can be also defined by “the ability of a system to act appropriately in an uncertain environment, where appropriate action is that which increases the probability of success, and success is the achievement of behavioural sub‐goals that support the system’s ultimate goal.”(Albus, 1991). The definition of Intelligence by James S. Albus can be directly applied to the corporate intelligence that major companies try to achieve. Their main goal is to increase their probabilities of success by taking the appropriate actions.2.1.5 WISDOM
“Wisdom deals with values. It involves the exercise of judgment. Evaluations of efficiency are all based on a logic that, in principle, can be programmed into a computer and automated.” (Ackoff, 1989). “Wise people exhibit both intelligence and creativity in one form or another, and an emerging wisdom derived in part from intelligence and creativity. This entails balance between change (creativity) and stability (intelligence) in societal activities and human behaviours when wisdom progresses i.e. making head ways in a given field in its quest for new knowledge and understanding. (Sternberg, 2001)” (Liew, 2013) Wisdom is considered by almost all authors as the only characteristic that can still no be produced by machines do to the humanity associated with it. Liew, 2013 refers to wisdom as a balance between creativity and intelligence and in our present even ifmachines can acquire intelligence, they cannot have pure creativity. So Ackoff, 1989 also considers that wisdom is the associated with the exercise of judgement, with the capability of understanding what is wrong or right. Once again, even if machines can decide judgments based on purely facts, there are cases where judgements go behind the facts. For the mentioned reasons, and because I share the opinion of those two authors, I will not allocate more time in the understanding and search for replicate wisdom through algorithms.
2.2 COMPETITIVE INTELLIGENCE
In this era of markets globalization organizations need to consider themselves as being part of a very volatile environment without any boundaries to protect them to the infinite external variables that can affect their business. The main purpose of CI is to provide actionable insights based on all available information to make all the external environment variables of a company the clearest and evident as possible to managers and consequently have a positive impact in their strategic management. (Heppes & Du Toit, 2009). Ci is the “collection, transmission, analysis and dissemination of publicly available, ethically and legally obtained relevant information as a means of producing actionable knowledge […] for the improvement of corporate decision making and action”. (Garcia‐ Alsina et al., 2016) Heppes & Du Toit in their paper "Level of maturity of the competitive intelligence function” considers that “only by developing actionable implications does a CI program have the opportunity to create a competitive advantage and truly deliver value.” Garcia‐Alsina et al., 2016 in “Competitive intelligence theoretical framework and practices” expose the “Intelligence cycle” a framework proposed by Choo (2002,2006) as a starting point to analyse the five phases of the intelligence cycle.
Figure 3 Intelligence Cycle (from Garcia‐Alsina et al., 2016) The first phase of the Intelligence Cycle, Identify, consists in identify and collect the organization’s information needs. In the second phase, Organize and store, the information identified in the first step is integrated and managed through the company informatic and communication technologies available. As per the third step, Dissemination, it is the phase that structures the information obtained to give sense to the collected weak signals. In the following phase Interpret and analyse, the analyses made from the previously disseminated information are also disseminated and give origin to intelligence products elaboration. Finally, in the create stage an organization defines its strategic plan and their decision making based on the intelligence products they got being a natural booster of innovation (Garcia‐Alsina et al., 2016). Pellissier and Nenzhelele in “Competitive intelligence theoretical framework and practices”, expose a more detailed framework for the competitive intelligence process as per the next figure.
Figure 4 The competitive intelligence process (from Pellissier & Nenzhelele, 2013)
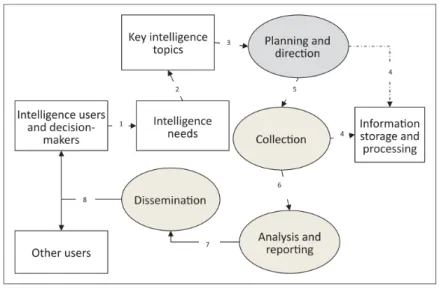
According to Pellissier and Nenzhelele (2013), organizations are struggling with stiff competition due to globalization. Therefore, companies are looking for tools to counter competition or gain competitive advantage. One of the tools involves competitive intelligence. It is important to note that competitive intelligence has evolved from military theory, economics, marketing, information science, and strategic management (Pellisier and Nenzhelele (2013). As a profession, competitive intelligence must follow a prescribed process. The process revolves around seven steps demonstrated in figure three. The stages include identification of intelligence needs and key topics, planning and direction, collection, information processing, analysis, dissemination, and identification of new intelligence needs. Specifically, the first step involves ascertainment of the decision needs and narrowing of the intelligence needs to relevant intelligence topics. Planning and directions include formulations of plans to guide the fulfilment of the intelligence needs of the decision‐makers. After planning, information is collected from the external environment through various methods such as surveys, observations, or questionnaires. However, collection of information is done ethically and legally. Processing of information includes capturing and storing data. This data is then analysed to generate actionable intelligence. This actionable intelligence is distributed or disseminated to the decision‐makers. Lastly, the last stage involves identification of new intelligence needs (Pellisier and Nenzhelele (2013).
2.3 ARTIFICIAL NEURAL NETWORKS
The study of artificial neural networks (ANNs) is one of the two major branches of artificial intelligence. The other one is expert systems. (Kalogirou, 2000). Artificial Neural Networks are result of the developer’s intent to reproduce the biological neural system architecture. The motivation behind that intent is to try to reach the same performance as a human when effortlessly solve complex perceptual problems.(Jain et al., 1996). This discrepancy of performance resides in the differences between the biological neural systems. architecture and the von Neumann architecture detailed in table 1 (Jain et al., 1996) Table 1 Von Neumann computer versus biological neural system (Jain et al., 1996)
To have a clear perception of what programmers pretend to replicate is important have a superficial understanding of the biological neuron itself. Figure 5 Mammalian neuron (Ajith Abraham, 2005) “Each neuron is a cell (Figure 4) that uses biochemical reactions to receive, process, and transmit information. Treelike networks of nerve fibres called dendrites are connected to the cell body or soma, where the cell nucleus is located. Extending from the cell body is a single long fibre called the axon, which eventually branches into strands and sub‐strands, and is connected to other neurons through synaptic terminals or synapses. The transmission of signals from one neuron to another at synapses is a complex chemical process in which specific transmitter substances are released from the sending end of the junction. The effect is to raise or lower the electrical potential inside the body of the receiving cell. If the potential reaches a threshold, a pulse is sent down the axon and the cell is ‘fired’.” (Ajith Abraham, 2005)
A typical artificial neuron can be represented as in the picture bellow: Figure 6 Architecture of an artificial neuron and a multi‐layered neural network (Ajith Abraham, 2005) Referring to the figure 5, the signal flows from the inputs x1, . . ., xn in a unidirectional way indicated by the arrows and results in the output signal (O). The signal O is given by the following mathematical equation: where wj is the weight vector, and the function f(net) is referred to as an activation (transfer) function. There are for types of activation functions: Figure 7 Different types of activation functions: (a) threshold, (b) piecewise linear, (c) sigmoid and (d) Gaussian (Jain et al., 1996) It is important to refer that the sigmoid function is a popular activation function for the backpropagation neural network. (Kim & Ingoo Han, 2000) The backpropagation neural
network will be explained in detail in a further point. The variable net is defined as a scalar product of the weight and input vectors, where T is the transpose of a matrix, and, in the simplest case, the output value O is computed as where θ is called the threshold level; and this type of node is called a linear threshold unit.
2.4 NEURAL NETWORK ARCHITECTURES
There are three types of neuron layers in a basic architecture: input, hidden and output layers. (Ajith Abraham, 2005) Please refer to the figure 7. Figure 8 A typical feed‐forward network architecture. (Jain et al., 1996) Figure 7 represents a feed‐forward network on which input signals flow from the input units to the output units strictly in a feed‐forward direction. However, when constructing a neural network to execute predictive analyses the backpropagation architecture is the one applied. The main reason for it is the fact the mathematical relationships between the various variables are not specified. The neurons learn from theexamples fed to them. (a.T.C. Goh, 1995). Jain et al., 1996 in “Artificial Neural Networks: A Tutorial” explain step‐by‐step the backpropagation algorithm in the following figure: Figure 9 Backpropagation steps (Jain et al., 1996)
2.5 PESTLE
The PESTLE is a framework that is used by businesses to support their strategic analysis activity. The well‐known PEST analysis it is self‐explanatory as each letter represents one of the pillars of the framework that stands for Political (P), Economic (E), Social (S) and Technological (T) analysis on the external business environment.(HO, 2014). The choice of the PESTLE framework instead of the PEST it is because of the consideration of two extra factors that are of major importance nowadays, the legal (L) and
environmental (E) factors. Refer to table 2 for a detailed understanding of which sub‐factors and constituents of the main ones. PESTLE FACTORS POLITICAL Government policies Funding policies Elections Trading policies Conflicts Terrorism Government structures Shareholder/stakeholder needs ECONOMIC Economy trends Economic status Global economic trends Taxation Market and trade cycles Market routes and distribution trends Customer/user drivers Disposable income International trade/monetary issues Job growth / unemployment Inflation Interest rates Exchange rates
PESTLE FACTORS SOCIAL Demographics Lifestyle changes Ethical issues Education Diversity Immigration/emigration Leisure activities Health Living standards Public confidence/happiness Media views/roles Consumer attitudes and opinions Fashion TECHNOLO GICAL Associated/dependent technologies Maturity of technology Research Competing developments Consumer attitudes and buying patterns Potential Access – open source, licenses etc. Intellectual property rights Energy issues Production improvements Internet
PESTLE FACTORS Biotech ENVIRONM ENTAL Ecological Attitudes and opinions Campaigning and advocacy EU factors Global factors Production/materials issues Local, national, European and global issues Innovations LEGAL Domestic legislation European legislation International legislation Regulatory bodies and processes Regulatory requirements Consumer protection Data protection Industry‐specific legislation Table 2 Detailed sub‐factors of the PESTLE framework The methodology usually applied to execute this framework ignores a major important consideration, which is the inter‐relatedness of the various PESTLE factors. (HO, 2014). To avoid putting the inter‐relatedness of the various PESTLE factor HO, 2014 in “Formulation of a Systemic PEST Analysis for Strategic Analysis” purposes a second stage of execution of this type of analysis with a systemic diagrammatic form.
The diagram presented in figure 10 is a systemic PEST analysis diagram. In the case of a PESTLE analyse the two extra factors should also be considered. Figure 10 The format of a systemic PEST analysis diagram (HO, 2014) The PESTLE execution consists in the analysis of possible impacts of the constituent factors and their implication to the organization itself. The purpose of the algorithm is to gather as much data insights as possible to analyse the impacts and consequent implications to the organization automatically and with a much more data‐driven result.
2.6 COMPETITIVE ANALYSIS TOOLS
Aithal (2017) suggests that the completions within an industry makes a company to dedicate significant part of their time, resources, efforts, and smartness to formulate several strategies to out beat other businesses operating within their industry.
Understanding the competition within the industry is essential in determining the impact of such competition on individual company performance and the general performance of the industry (Aithal, 2017). Competitive analysis refers to an activity undertaken by a company to evaluate its competitors. It is a strategic technique seeks to identify the strengths and weakness of the competitors. This information is used to improve the operation of the respective company to make its product and services unique or differentiate itself from the competitor. Most importantly, assessing the strengths and weaknesses of the competitors positions the company strategically to predict how they will react to certain actions and be able to gain a competitive advantage. Therefore, competitive analysis is an integral part of the company's strategic plan. Notably, the competitors are placed in strategic groups according to their level of competition in terms of market share. In the strategic groups, competitors are listed with their products and services, marketing assumptions, and objectives, growth capacity and pattern, financial muscles (revenues), past and current strategies, cost structure, strengths and weakness, opportunities and threats, and size (number of employees and space). Thus, competitive analysis is important in keeping an eye on the competitors in aim to anticipate changes in the market, identify new trends and successful tactics, and maintain the cutting edge of what is working throughout the company's niche undertaking this evaluation. Several competitive analysis tools are used to analyse competitors. They include porters’ five analysis forces, SWOT analysis, and PESTLE analysis (Aithal, Shailashree, and Kumar, 2017). Mainly, these tools are instrumental in understanding the external and internal environmental factors that may affect negatively or positively a company in a competitive market.
2.6.1 Porter’s Five Forces Analysis
According to Burns and Dewhurst (2017), Porter's five forces is a model that identifies and assesses the five competitive forces that structure industry and helps in the determination of the strengths and weaknesses of the companies operating in the samecompetitive environment. Michael E. Porter (a Harvard Business School professor) devised this model (Burns and Dewhurst, 2017). As a competitive analysis tools, competitive assessment can be done using the guidelines of Porter’s five forces analysis including threat of new entrants to the market, threat of substituent services or products to the market, bargaining power of customers, the bargaining power of the suppliers in the market, and the competition among rivalries (Aithal, 2017). Specifically, competition in the industry refers to the establishment of the number of competitors and their ability to weaken other companies. It is important to note that the bigger the number of organizations along with an equivalent number of products and services they provide, the smaller the power of an organization. Therefore, it means that the competition is high and vice versa. Secondly, the threat of new entrants to an industry affects the company’s power in the market. The easier it is for a new company to enter the market, the more the company's position is weakened and vice versa. Thirdly, the bargaining power of suppliers determines the cost of inputs or materials. Fourthly, the bargaining power of customers determines the prices of the outputs in the market. Lastly, substitute products or services are a threat to a company when available weakening the power of the company. Therefore, porter's five forces analysis is essential in enabling an organization to adjust its strategy to utilize the resources according to the competition in the market effectively. In addition, to the five forces, Porter developed generic strategies that can be used for competitor’s strategies analysis (Aithal, 2017b). These strategies include cost leadership, product or service differentiation, cost focus, and focus differentiation amongst others (Aithal, 2017). However, according to Mekic and MKekic (2017), Porter’s model does not follow the pace of technology and globalization and its effect on the development of a competitive environment, but it is still a viable tool in analysing completion.
2.6.2 SWOT Analysis
Gurel and Tat (2017) substantiate that SWOT analysis is a tool used in strategic management in organizations. Most importantly, SWOT analysis is instrumental in building a competitive strategy. According to the system approach, organizations exist as one through their interactions with their environments and are made of several sub‐systems. Thus, businesses operate in two environments. They include internal and external environments. It is crucial to analyse these environments for good strategic management processes. This practice of assessing the organization and its environment is known as SWOT analysis (Gurel and Tat, 2017). Mainly, SWOT analysis stands for strengths, weaknesses, opportunities, and threats. Through the conduction of external analysis, an organization identifies the important opportunities and threats in its competitive environment. Additionally, the external analysis, the company examines the likeliness of competition evolution and its implications to the threats and opportunities (Gurel and Tat, 2017). In other words, external analysis involves the identification of threats and opportunities. On the other hand, internal analysis is crucial in the identification of organizational strengths and weaknesses. Furthermore, external analysis as part of a SWOT evaluation enables an organization to understand some of the resources and capabilities that can be resourceful in beating completion (Gurel and Tat, 2017). Therefore, strengths and weaknesses are internal attributes and factors affecting an organization. On the contrary, threats and opportunities are external attributes and factors that affect a company. Thus, SWOT analysis provides insightful information that is essential in matching the resources and capabilities of the organization to the competitive environment in which it operates (Gurel and Tat, 2017). However, SWOT analysis has some structural ineffectiveness such as a lack of prioritization of alternatives and extractable strategies (Menga, Dan, Lu, and Liu, (2015). In fact, Khan, Hossain, and Rabbi (2018) posit that studies have demonstrated the negative influence of SWOT analysis on strategic decision‐making.2.6.3 PESTLE Analysis
It is important to note first that PESTLE analysis is used in collaboration with the other analytical tools mentioned above (Porter’s Five Analysis and SWOT Analysis) to give a clear understanding of the competition and associated external and internal factors (Birsan, Shuleski, and Cristea, 2016). Sammut‐Bonnici and Galea (2015) insist that PESTLE analysis is more effective than other tools. This is because PESTLE analysis is used in conjunction with other tools such as SWOT and Porter’s five forces analysis (Sammut‐Bonnici and Galea, 2015). Therefore, the focus is put on PESTLE analysis as a competitive analysis tool. PESTLE analysis is a model or framework used to analyse the external environment of the organization. PESTLE is an acronym standing for political, economic, social, technology, legal, and environmental factors affecting an organization. The primary objective of the analysis is to provide a general picture of the main environmental drivers that should be considered when defining and implementing competitive strategies (Birsan, et al., 2016). Specifically, political factors involve government interventions within the economy or an industry. In other words, political factors revolve around the government's influences or power to control organizations. They include political instability or instability, tax policy, corruption, trade restrictions, tax policy, and export and importation policy among others as shown in table 2. These factors require analysis when evaluating a competitive environment (B2U, 2018). Economic factors refer to the determinant of the performance of the economy. These factors include exchange rates, interest rates, disposable incomes of consumers, economic growth, unemployment rates, and other factors shown in table 2. Notably, these factors can have a direct or indirect long‐term effect on the company because it influences the bargaining and purchasing power of the consumers changing the demand and supply forces of the economy. Subsequently, the organizational prices of the products and services are affected (B2U, 2018). Social factors surround the dimension of the overall environment representing the demographic characteristics, values, culture, and traditions of the people within which the company operates (Team FME, 2013). These include population growth trends, incomedistribution, lifestyle, career concerns, age distribution, health and safety concerns, beliefs, culture and attitude barriers among others demonstrated in table 2. They are crucial in formulating and implementing marketing decisions to counter competition. Technological factors revolve around the innovations surrounding technology that can influence the operations of the company and its market positively or negatively. These factors include technology incentives, research and development, technological changes, level of automation, level of innovation, and technological awareness across the market among others indicated in table 2. It is important to mention that these technological factors influence decisions such as entering certain industries, launching products, and outsourcing certain production functions. By considering these factors, an organization can predict technological changes and develop a technology that would not become obsolete soon and be able to remain competitive. Environmental factors are increasingly becoming important due to the rising scarcity of raw materials, carbon footprint targets, and pollution targets established by any regime (B2U, 2018). These factors surround the ecological and environmental aspects such as climate change, global warming, environmental offsets, weather, and climate, which affect industries (Team FME, 2013). Most importantly, the increasing awareness of the possible impacts of climate change is influencing how companies operate and the products or services they provide. This has contributed to organizations getting involved in practices such as social responsibility and sustainability. Notably, the notion of corporate social responsibility has gained currency since the 1960s (Wang, Tong, Takeuchi, and George, 2016). Corporate social responsibility refers to a business taking responsibility to the society and the broader group of its stakeholders beyond its shareholders (Wang, Tong, Takeuchi, and George, 2016). Schrempf‐Starling, Palazzo, and Phillips (2015) agree that organizations are increasingly held accountable for activities up and down their value chains but beyond their conventional corporate limits. Lastly, legal factors are somehow related to political factors, which include regulations such as employment law, labour law, consumer protection law, patent and copyright laws, company laws, health and safety laws, and environmental laws among others (Sammut‐Bonnici and Galea, 2015). Thus, an organization needs to be aware of such
trade, it becomes important to adhere to the international laws touching on importation and exportation of commodities. Most importantly, companies need to keep up with the potential changes in legislation and the effect it can have on their operations in the future. According to B2U (2018), the organization should at least be guided by a legal advisor or attorney when it comes to such matters.
2.7 IMPORTANCE OF PESTLE ANALYSIS
PESTLE analysis is an important tool in the growth of any business because it involves the environmental scanning element of strategic management (Gupta, 2013). Thus, whether the growth is an expansion of a product line or launching a new branch of the company in a different location, this tool is instrumental in making plans and strategies. Specifically, PESTLE analysis assists businesses in understanding major changes in social, political, environmental, technological, economic, and legal factors. More so, it helps the organization in strategic management to expand (Gupta, 2013). Some of the advantages of PESTLE analysis include a deeper understanding of the business environment, alertness development, exploitation of opportunities and gaining of competitive advantage. Mainly, PESTLE analysis assists an organization to gain an in‐depth understanding of the external factors affecting its operations or activities. For example, when it comes to the creation of a new product, PESTLE analysis heightens the strategically thinking and deeper understanding of several factors such as safety and health laws, consumer protection laws, new technological patterns, and consumers' beliefs, attitudes, tastes and preferences among others. Furthermore, this competitive tool helps organizations to identify and contain potential threats that may be caused by external factors. For example, in the mobile manufacturing industry, a change in technology such as the development of new mobile features is a threat to a company if it does not upgrade to the innovation changes in its mobile brand. More so, PESTLE analysis is crucial in helping companies exploit opportunities that come into being because of external factors. For instance, the lower interest rates in
demand for housing since the housing loans are affordable due to the decreased interest rate. Specifically, when it comes to the consideration of the political factors, according to Sammut‐Bonnici and Galea (2015), it is evident that firms benefit from scanning and evaluating the political environment in which they operate. Regular monitoring of the political factors becomes paramount in guaranteeing that a firm’s strategy is in line with the context of policy. Vital changes in the political setting can bring important changes in the structure and operations of a market or industry (Sammut‐Bonnici and Galea, (2015). Additionally, the economic factors mentioned above demonstrate the significance of the need for constant surveillance of the major economic factors that have an impact on an industry. Sammut‐Bonnici and Galea (2015) substantiate that it is not an easy task to go through economic maze and to understand how the events are likely to unfold. Thus, businesses may wish to limit themselves to evaluate factors that have a direct and critical effect on their operation rather than the wide spectrum. As far as social factors are concerned, changes in demographic data of the consumers can have an impact on many parts of an economy (Sammut‐Bonnici and Galea, 2015). Many developed nations are struggling with the challenges of an aging population because the baby boomers are more than sixty years old. Notably, an old population necessitates additional demand for healthcare, medicine, social support services and decreases the demand for commodities associated with a young population such as technological products and education (Sammut‐Bonnici and Galea, 2015). Mainly, the old generations have more time on leisure activities and are financially stable. Therefore, they provide the right mixture of customer spending. Hence, a scan of the social factors enhances the firm's ability to forecast the pressures that are likely to be made by various stakeholders on policy decisions of government that would, in turn, influence the company's operations (Sammut‐Bonnici and Galea, 2015). According to Sammut‐Bonnici and Galea (2015) from a business point of view, technology can create a competitive advantage through a wide range of factors. These include cost‐effectiveness, cheap production, enhanced access to customers, improved branding, improved product quality, and a high degree of business intelligence. Particularly,
intermediaries, a process called disintermediation. For instance, in the tourism and travel industry, tourists have become their own travel agents. This is because they book and plan their travel on an online platform known as the business‐to‐consumer that had been previously limited to business‐to‐business participants of the supply chain. Furthermore, most of the retailers are experiencing intense competition as they are facing rivalry from online stores. However, technology has led to the birth of a new set of intermediaries in a process called re‐intermediation. Examples of the new intermediaries include eBay, Amazon, and Expedia among others. These new forms of intermediaries are advantageous when compared to others because they are integrated with social networks that provide new channels of marketing a product or service. It is important to note that these channels enable consumers to provide their feedback on their interaction with the product or service. The feedback is essential in the provision of value in supply chain operations. These opinions of the customers are important in attracting new customers because they create a positive image of the organization (Sammut‐Bonnici and Galea, 2015). Therefore, PESTLE analysis is paramount in providing strategic planners with a guideline that increases their understanding of the external environment. However, it is not intended to restrain the analysis in a straitjacket (Sammut‐Bonnici and Galea, 2015). The importance of the analysis is realized when the interdependencies among the various elements of the tool are established. For instance, an upsurge of government taxes is likely to affect or reduce the disposable income of the consumers. On the contrary, the provision of favourable incentives for an industry is likely to attract more investment that creates employment and wealth. Additionally, a growing understanding of the environment by the citizens is likely to pressure the government to formulate and implement laws that protect the environment. Sammut‐Bonnici and Galea (2015) recommend that this framework should be used judiciously because the evaluation of the economic, political, environmental, legal, technological, and social factors can become an endless activity with no value to the business. The main principle of the tool is that only factors with a direct impact on the business operations or industry functionality should be evaluated to enable the gain of competitive advantage (Sammut‐Bonnic and Galea, 2015).
2.8 IMPORTANCE OF AUTOMATING PESTLE ANALYSIS
According to Al‐Nady and Alhharaizah (2014) technology has contributed to the development of databases that help in the organization and analysis of the information reported to a company from all sources such as mobile phones and websites through the SPPS, a technological tool used for data analysis. Mainly, the proliferation of new technology has impacted the general business and production process. Technology has been effective in monitoring environmental changes especially the ones affecting the business efficiencies, existing infrastructure, or development of new structures or products (Al‐Nady and Alharaizah, (2014). Al‐Nady and Alharaizah (2014) established that environmental scanning and communication technology paves the way for sustainable competitive advantage. In other words, the success of any organization depends on a combination of environmental scanning and communication technology as an approach to sustainable competitive advantage. In this context, competitive advantage is gained through the analysis of the external environment, which provides essential and specific information to managers to place industrial development patterns and come up with the development strategies (Al‐ Nady and Alharaizah, 2014). Attaining competitive advantage is the most challenging issue facing organizations across all sectors. This issue has led to the establishment of resource and knowledge‐based theories that investigate the association between the core capabilities and resources. Citing Porter, Al‐Nady and Alhairazah (2014) suggest that the five types of competitive advantage include low‐cost production, differentiation, and focus. Particularly, a company enjoys a competitive advantage if it can deliver quality products at a cheaper rate compared to competitors. These quality products should translate into high profitability. Therefore, competitive advantage can be defined as the ability or advantage a firm has over its competitors because the company wants the gap between understood value and cost of the commodity to be greater than the competition. Specifically, Al‐Nady and Alhairazah (2014) found out that suppliers face several challenges especially uncertainties in the business environment. If the supplier does not
of competitive advantage is almost of no important effect. Therefore, failing to take time to think and conduct a PESTLE analysis and use the right technology can result in increased risks and errors, expensive mistakes, and wrong understanding of the market. The role of the scanning environment through communication technology is essential in identifying and maximizing opportunities, minimization of threats especially during planning and developing strategies of a firm. It assists in forecasting future factors, which interact in the business environment. Automation of the process saves time by fast‐tracking the workflow process. More automated filing systems save space, time and costs used in printing, and paper costs. Most importantly, the use of computer systems enables instant implementation of corrections. According to Gallupe and Jiang (2015), the three pitfalls of an ineffective PESTLE analysis include insufficient analysis, unreliable technology, and lack of focus on decision‐ makers' real demands. The business environment is getting significantly complex, a large volume of information flows drowning firms, and many of them feel the pressures of lack of capacity in face of too many sources of information. To tackle the process, automation of PESTLE analysis has been very effective. It involves the use of powerful information technology tools to scan the environment and make decisions. Therefore, business analytics is almost at the top of the list of information technology investments for many organizations (Gallupe and Jiang, 2015). Business analytics refers to a set of approaches, tools, and organizational procedures used in combination with one another to collect data, analyse information, and predict outcomes out of the problem solutions. Notably, business analytics tools are essential in empowering firms through the generation of business insights that reflect a deep understanding of a given situation that can benefit the business (Gallupe and Jiang, 2015). However, several organizations undertake that an insight capability comes by default through investing in and implementing business analytics instruments. This is not the case according to Gallupe and Jiang (2015). It is easy for managers to access information from a dashboard but is hard to get the right information or to analyse the information to acquire accurate insights. Encouraged by the gap between business analytics tools and efficient business insight delivery, Gallupe and Jiang proposed the need for knowledge integration, which is significant in the generation of business insights. Therefore, in addition to gaining
sustainable competitive advantage, integration of business analytics and knowledge integration on an environmental analysis process contributes to the generation of crucial business insights
2.9 IMPROVEMENT OF PESTLE ANALYSIS USING NEURAL NETWORKS
As mentioned earlier, an artificial neural network is a branch of artificial intelligence. Neural networks can improve PESTLE analysis by identifying the quality of the product. In other words, the neural network can help in the determination of the perceived quality product by customers. This is because according to Kutilek, the evaluation of quality products can be possible through an automatic cognitive process. The cognitive system must apply the methods of artificial intelligence, as are neural networks (Kutilek). The analysis of the quality of a product relies on the described interpretation of vague descriptions. Kutilek defines the numerical description at the interval <‐3, 3> with the intervals of one. The method of artificial intelligence will define the crisp value of the quality of the product with the defined range. The information source to the neural network system will be the data collected by human experts, the internet, and the business system. Nevertheless, Kutilek uses normalization of all neural network input data to the same grid interval to maintain information objectiveness. From the noted pre‐requisite, it is obvious that the proposed neural network will have one output neuron in the output layer. The number of input variable quantities defined by a human expert will determine the aggregate number of the input neurons in the input layer. The total number of layers in the neural network must be optimized according to the given number of output and input neurons. By considering quality as characteristics representing the level of customer's satisfaction, the input data is used in blocks of identification for recognition of information such as the ratio of sales returns, ration of sold goods, information about goods from customers and internet visitors, evaluation and reviews of the products in the professional and customized media. This information about the product will be input data subjected to the neural network. The neural network will
neural network and the data, it will determine the output variable demonstrating the value of the product quality (Kutilek). Lastly, neural networks improve PESTLE analysis by assisting in the identification of market share in the same process used to identify the quality of the product. Identification of market share and product quality is important especially in the analysis of economic and social factors affecting a business.
2.10 DECISION SUPPORT TOOLS
Decision support tools or system is a component of the management support system. The decision support systems are designed to facilitate flexibility in the decision‐ making process for improving effectiveness resulting in efficiency in the organization. They provide the management with data and guidelines to carry out depth analysis such as PESTLE analysis to improve analytical decision‐making procedures revolving around structured and semi‐structured decisions. Therefore, decision support tools are designed to assist the users to make effective decisions by guiding them through clear decision‐making stages and providing the chances of several outcomes generated from different options (Rose et al., 2016). Anwar and Ashraf (2014) substantiate that decision support systems were developed to enhance the quality of decisions. The design of the decision support system is composed of three layers or elements involving the database management system, model base management system, and conversation management. Notably, the database management system serves as the data storage for the decision support system. In other words, its stores or saves a great amount of data linked with the applications and issues for which the database in the decision support system has been created and it improves the systematic access of data. On the other hand, model base management is integral in the provision of freedom from models that are used in the decision support systems from the application the user is utilizing. The main function of this component is to transform data stored in the database management system into useful information, which can be instrumental in the process of making decisions. Lastly, the conversation management helps in the creation of a model and
knowledge of hidden patterns and recommendations. The objective of this component is to enhance the conversation abilities of the user with the system and enable operators to enjoy the maximum benefits of the system. Therefore, these components come together to form the decision support system. According to Rose et al. (2016), several decision support tools are available for different users. However, the recommendations of the decision‐making tools will depend on the users' inputs and they can suggest an optimal decision path. Gibson et al. (2017) agree that there are many examples of decision support tools employed to analyse information to assist in decision‐making. It is important to mention that decision support tools are numerous including communication‐based tools, a model‐based tool, a data‐oriented tool, a knowledge‐based tool, and a document‐based tool. Specifically, the communication‐based tool is based on communication among team members. Communication is facilitated through video conferencing, messages, and emails. Secondly, model‐based helps the user in coming up with solutions to complex problems. Thirdly, the data‐oriented tool employs database and warehouse to request data concerning different situations and problems. Managers and members of the staff mostly use this tool. Fourthly, a document‐based tool is used to search the websites or specific documents. Lastly, knowledge‐based tools are applicable where the information may not be visible to the user beforehand. This tool identifies the hidden trend among data records, management suggestions, and services. Several techniques are used to collect knowledge for the decision‐making process in a personal or group decision support system (Anwar and Ashraf, 2014). Decision support tools are useful in different sectors such as education, medicine, agriculture and business among others (Anwar and Ashraf, 2014). Specifically, in the past years, a decision support system in the business field has acquired an increasing amount of value among the users and the researchers due to several success cases that have reported notable progress in the performance of the organization. Decision support systems are integral in helping business personnel in the formulation and implementation of policies and in utilizing the technical means to aid the professionals in decision‐making. Mainly, decision support tools are an informational framework associated with the mathematical models, informational databases and user‐friendly environment to communicate recommended
decision making in the decision support tool is diverse of rational information or management information system because it provides information and knowledge to the users' databases and reports and delivers answers according to the user’s needs or questions.