Journal of Environmental
Analysis and Progress
Journal homepage: www.jeap.ufrpe.br/ 10.24221/JEAP.4.3.2019.2488.157-167 ISSN: 2525-815XDetection of True Mangroves in Indonesia Using Satellite Remote Sensing
Nanin Anggrainia, Syifa Wismayati Adawiaha, Atriyon Julzarikaa,b
a Indonesian National Institute of Aeronautics and Space-LAPAN, Remote Sensing Applications Center, Jl. Kalisari No. 8 Pekayon, Jakarta, Indonesia. E-mail: [email protected], [email protected].
b Universitas Gadjah Mada-UGM, Department of Geodesy Geomatics Engineering, Jl. Grafika No. 2 Yogyakarta, Indonesia. E-mail: [email protected].
A R T I C L E I N F O
Received 04 Apr 2019 Accepted 14 June 2019 Published 27 Jun 2019
A B S T R A C T
Mangrove existence is necessary to protect the coastal. One method that can be used to keep mangrove existence were using satellite imagery monitoring. The number of bands in the imagery led to the selection for the RGB composite bands was difficult because of many combinations to try. One technique that can be done to get the best RGB combination of an object is to use Optimum Index Factor (OIF). OIF is a statistical technique for selecting three combinations of imagery bands to visualize the image display to the fullest. It is based on the value of total variance and the correlation coefficient between the bands. Landsat 8 has seven bands with 30 m resolution, one panchromatic band with 15 m resolution, and two bands with 100 m resolution. The purpose of this study was to detect true mangrove using three bands from OIF value of Landsat 8. The results of the processing from 6 bands (2-3-4-5-6-7) obtained 20 bands combinations with the highest value of OIF is 0,168, i.e., bands 2-5-6 (Blue, NIR, SWIR-1). Based on the combination, the next step was the unsupervised classification process for true mangrove identification (Rizhopora, Brugueira, Avicennia and Soneratia). The best classification using band combination 2-3-4-5-6-7 with true mangrove reached 4.041 ha.
Keywords: Landsat 8, true mangrove, Optimum Index Factor.
Introduction
Landsat satellites are experiencing rapid technological developments until now it has reached the 8th generation. Landsat 8, is an improvement from Landsat 7. It can be seen from the addition of bands and wavelength ranges. There are 11 bands on Landsat 8 which are divided into two sensors, namely Onboard Operational Land Imager sensors (OLI - bands 1 to 9) and Thermal Infrared Sensors (TIRS - bands 10 and 11). There are three spatial resolutions on Landsat 8, namely 15 m (band 8), 30 m (bands 1 - 7, and 9), and 100 m (bands 10 and 11). Also, Landsat 8 has a gray level 0-4096. It is caused by an increase in sensitivity which at first each pixel has an 8-bit quantification has now increased to 12 bits. This increase makes the process of interpreting objects on the surface easier (Sugiarto, 2013; Anggarita et al., 2018).
The addition of the number of bands makes more variations for image composites. It is certainly a problem with what combination of bands will produce a maximum image display,
capable of displaying information on the surface of the earth very well. One method that can be used to determine the best band combination, namely Optimum Index Factor (OIF). OIF is a statistical value that can be used to select the optimum combination of three bands on satellite imagery (Depdip, 2013). This statistical method was introduced by (Chaves et al., 1982) to choose a combination of three bands that will present the best display of many bands. In principle, OIF is one method of image sharpening from the point of operation perspective. OIF techniques simplify band selection by evaluating quantitative statistics and eliminating the process of visual analysis (Depdip, 2013). The results of the OIF calculation are the best three-band combination for RGB composites. It is based on statistical calculations on the total number of variants and correlations between various bands. Bands with lots of "information" (high standard deviation) and a little "duplication" (low correlation between bands) will produce high OIF values. OIF techniques have been widely used, including for interpretation of
settlements (Depdip, 2013), geological mapping (Qaid & Basavarajappa, 2008), coral reefs (Asriningrum, 2008), geology (Jun et al., 2008), the shape of the earth's surface, marine, karst , fluvial, structural, and volcanic (Asriningrum, 2002), and mangrove (Marini et al., 2015; Manoppo et al., 2015). One of the most interesting uses of the OIF technique is the detection and classification of mangroves. Detection of mangroves using remote sensing technology is based on the value of chlorophyll and the location of growth around the coast (Arumugam et al., 2018). Chlorophyll is optical that absorbs the red light spectrum and reflects the infrared light spectrum strongly (Green et al., 2000). The mangrove location around the coast makes it easy to detect mangroves by taking into account the distance and influence of seawater (Pham & Yoshino, 2016). Based on this, detection, calculation of area, and density of mangroves can be carried out (Susilo, 2000; Thu & Populus, 2007).
Mangrove forests are a type of tropical rainforest that grows along tropical coastlines with unique features compared to other forests (Kirui et al., 2013). Even though this forest belongs to a large group of tropical rain (Krauss et al., 2014), because it grows in tidal areas, this plant is classified as Halophytes (saline plants) (Wibisono, 2011; Deng et al., 2015). Mangroves are vegetation that grows in the transition zone between land and sea in coastal tides, estuaries and coral environments characterized by strong winds, inundation, high temperatures, and muddy anaerobic soil (Kathiresan et al., 2001; Lugo et al., 1974; Nontji, 2005; Wibisono, 2011) that the properties possessed are not exactly the same as those in the mainland tropical rainforest.
Morphologically, mangrove divides into three, namely major (true), minor, and association (Tomlinson, 1994). Besides Tomlinson (1994), Kitamura et al. (2003) and Kusumaningtyas et al. (2019) divided mangroves into two classes, namely true mangroves and associations. In general, true mangrove is a type of vegetation that can live in tidal areas, in the form of pure stands, able to tolerate salinity (able to absorb and release salts through stems and leaves), based on taxonomies different from land plants, able to adapt to the environment (roots breath, associated with gas exchange, viviparine embryo) (Tomlinson, 1994; Kitamura et al., 2003). True mangroves examples are genus Avicennia, Laguncularia, Lumnitzera,
Nypa, Bruguiera, Ceriops, Candellia, Rhizophora,
and Sonneratia (Farzana et al., 2017). Minor mangroves are mangroves that are unable to form pure stands and only live on the edge of the habitat, for example, Pemphis acidula, Aegiceras sp.,
Excoecaria agallocha and Xylocarpus sp. (Hossain et al., 2017). Mangrove associations are coastal vegetation that can adapt to coastal ecosystems but cannot remove excess salt substances, for example,
Barringtonia asiatica, Sesuvium sp., Ipomoea sp., and Calotropis gigantea (Tomlinson, 1994; Kitamura et al., 2003). A lot of research on true mangroves, but true mangrove research using satellite technology has not been done much. Research on true mangrove based on satellite data was carried out by Purwanto et al. (2018). Based on the study results, true mangroves are in the eastern part of Segara Anakan. This study aims to detect true mangrove by using three bands from OIF values of Landsat 8.
Material and Methods Study area
The research location is Segara Anakan. This location is located in Cilacap Regency, Central Java Province, Indonesia. Location selection is based on the still extensive mangrove area and the diversity of mangrove species in Segara Anakan. The location of the study can be seen in Figure 1.
Data collection
Landsat is the eighth generation which is the result of improvements from the previous generation. Landsat 8 has 11 bands with shorter wavelength ranges so that it can detect objects more clearly. The data used in this study is Landsat 8 corrected on the date of acquisition on May 20, 2015, which has been converted to reflectance value. Landsat 8 imagery used is the data in path 121 and row 065.
Optimum Index Factor (OIF)
Remote sensing data can be used for mangrove detection (Kuenzer et al., 2011; Vo et al., 2013; Luong et al., 2015). Landsat 8 is useful for this detection. The initial step is to sharpen the spatial and spectral information of Landsat 8 image data through the data fusion process. The data fusion process was carried out on Landsat 8 data on the Red-Near Infrared (NIR)- Short Wave Infrared-1 (SWIR-Infrared-1) bands (30 x 30 m resolution) with band 8 (panchromatic with a resolution of 15 x 15 m). The result of fusion will make the display visually clear (Clark et al., 2011), where the color pattern is obtained from 30 x 30 m resolution images (Hauser et al., 2017), while the panchromatic band will sharpen the impression on the texture (Wang et al., 2018). Based on this, a training area was made in the Landsat 8 data to obtain reflectance values (Adam et al., 2010). The training area is based on the results of the survey conducted on July 18th
until July 24th in 2016. The number of training areas is 50 points scattered around Segara Anakan.
Figure 1. Research location in Segara Anakan, Indonesia. Based on the reflectance values that have
been obtained from the extraction results of the training area, OIF values are calculated. The algorithms used to obtain OIF values are as follows (Chaves et al., 1982):
=
OIF
= = 3 1 3 1)
(
j iCCj
ABS
SDi
Eq.(1) where:SDi : standard deviation of the band I ABS : absolute value of the two-band
correlation coefficient of three bands is possible.
The number of bands used to calculate OIF values is 6, namely band 2-7. These bands include visible light, NIR, and SWIR bands. Based on the number of bands, the possible combinations are
3 = 3! ∗ !− 3 ! Eq.(2) The next step is to select the four highest OIF values. Based on these values, an unsupervised classification process is carried out to separate between true and non-mangrove mangroves. Unsupervised classification is a process of iterating the spectral value of a pixel to produce a spectral group (Johnson & Xie, 2011).
This spectral group will be classified as an object based on the similarity of the cluster values (Kamal & Johansen, 2017). The unsupervised classification process will automatically be carried out by a computer without involving interference from the operator except when grouping the spectral group values into an object. In this study, the object is divided into water, non-vegetation, true mangrove, vegetation, and clouds. The final step is to calculate the area of the classification results. The flow of research can be seen in Figure 2. Field survey is needed to know the accuracy of classification result (Lu & Weng, 2007).
Results
The Landsat 8 image used is in a condition already in the reflectance form and has been intermediated between multispectral (30 m) and panchromatic (15 m). It aims to be able to distinguish the detail of the object. After that, the reflectance value was extracted based on the training area made.
This training area is based on visual identification of the mangrove class. Then the OIF value is calculated based on the value of the reflectance extraction. Unsupervised classification is carried out after OIF values are obtained. The classification results are in the form of true mangrove and non-true mangrove classes. The results of this classification need to be tested for accuracy with field data. If it does not meet the set tolerance, it is necessary to do the calculation of the new OIF. If it has fulfilled the tolerance set at 3σ with a confidence level of 90%, it will get the classification of true mangrove.
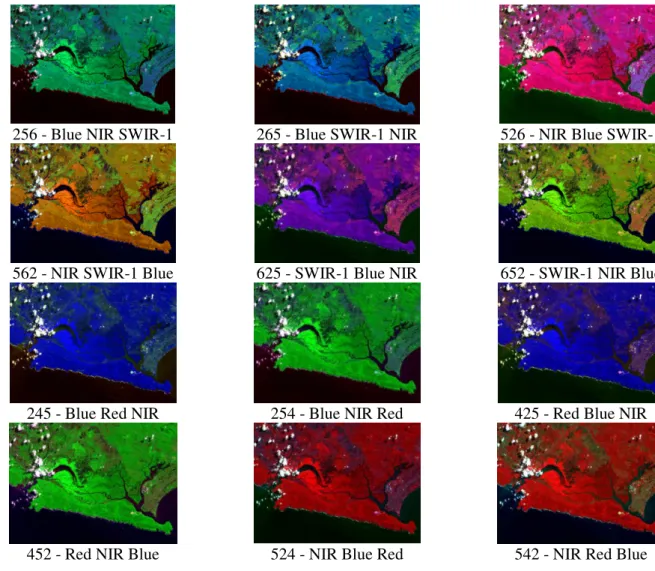
256 - Blue NIR SWIR-1 265 - Blue SWIR-1 NIR 526 - NIR Blue SWIR-1
562 - NIR SWIR-1 Blue 625 - SWIR-1 Blue NIR 652 - SWIR-1 NIR Blue
245 - Blue Red NIR 254 - Blue NIR Red 425 - Red Blue NIR
452 - Red NIR Blue 524 - NIR Blue Red 542 - NIR Red Blue Figure 3. Variety of band combinations for Optimum Index Factor (OIF) calculation.
257 - Blue NIR SWIR-2 275 - Blue SWIR-2 NIR 527 - NIR Blue SWIR-2
572 - NIR SWIR-2 Blue 725 - SWIR-2 Blue NIR 752 - SWIR-2 NIR Blue
235 - Blue Green NIR 253 - Blue NIR Green 325 - Green Blue Green
352 - Green NIR Blue 523 - NIR Blue Green 532 - NIR Green Blue
456 - Red NIR SWIR-1 465 - Red SWIR-1 NIR 546 - NIR Red SWIR-1
564 - NIR SWIR-1 Red 645 - SWIR-1 Red NIR 654 - SWIR-1 NIR Red Figure 4. Variety of band combinations for Optimum Index Factor (OIF) calculation.
The most important thing in getting the classification of true mangrove with high accuracy is dependent on the results of the OIF value calculation. This calculation involves 6 bands from Landsat 8 data. The results of processing six bands (2-3-4-5-6-7) of Landsat 8 data, obtained 20 band combinations with values ranging from 0.043 - 0.177. The highest rating is a combination of band
2-5-6 or (Blue, NIR, SWIR-1) and the last is 2-3-4 or (Blue, Green, Red). Ranking of Landsat 8 OIF values can be seen in Table 1. Based on the OIF value, four band combinations are taken with the highest OIF value, namely 2-5-6 (Blue, NIR, SWIR-1), 2-4-5 (Blue, Red, NIR), 2-5-7 (Blue, NIR, SWIR-2), 4-5-6 (Red, NIR, SWIR-1).
The band combination does not necessarily provide maximum visual information; it is necessary to test variations of the three bands. Figure 3 and 4 show the results of a combination of three bands based on OIF values. Besides being used to obtain the best visualization, the OIF value was used to detect the true mangrove location in Segara Anakan using the unsupervised
classification method. Of the four band combinations, band 2-5-7 shows the true mangrove location clearly. Figure 5 shows the results of an unsupervised classification for true mangrove using the four highest OIF values. Table 2 shows the results of land cover area based on unsupervised classification
Table 1. Optimum Index Factor (OIF) value from Landsat 8.
No Band combinations OIF value
1 2-5-6 Blue, NIR, SWIR-1 0.177
2 2-4-5 Blue, Red, NIR 0.163
3 2-5-7 Blue, NIR, SWIR-2 0.162
4 2-3-5 Blue, Green, NIR 0.153
5 4-5-6 Red, NIR, SWIR-1 0.148
6 3-5-6 Green, NIR, SWIR-1 0.143
7 3-4-5 Green, Red, NIR 0.140
8 4-5-7 Red, NIR, SWIR-2 0.139
9 3-5-7 Green, NIR, SWIR-2 0.135 10 5-6-7 NIR, SWIR-1, SWIR-2 0.118 11 2-6-7 Blue, SWIR-1, SWIR-2 0.076 12 2-3-6 Blue, Green, SWIR-1 0.073 13 4-6-7 Red, SWIR-1, SWIR-2 0.071 14 3-4-6 Green, Red, SWIR-1 0.071 15 3-6-7 Green, SWIR-1, SWIR-2 0.070 16 2-4-6 Blue, Red, SWIR-1 0.062 17 2-4-7 Blue, Red, SWIR-2 0.054 18 3-4-7 Green, Red, SWIR-2 0.052 19 2-3-7 Blue, Green, SWIR-2 0.051 20 2-3-4 Blue, Green, Red 0.043
A B C
D E
Figure 5. Unsupervised classification. A. 2-4-5 band combination; B. 2-5-6 band combination; C. 2-5-7 band combination; D. 4-5-6 band combination; E. 2-3-4-5-6-7 band combination.
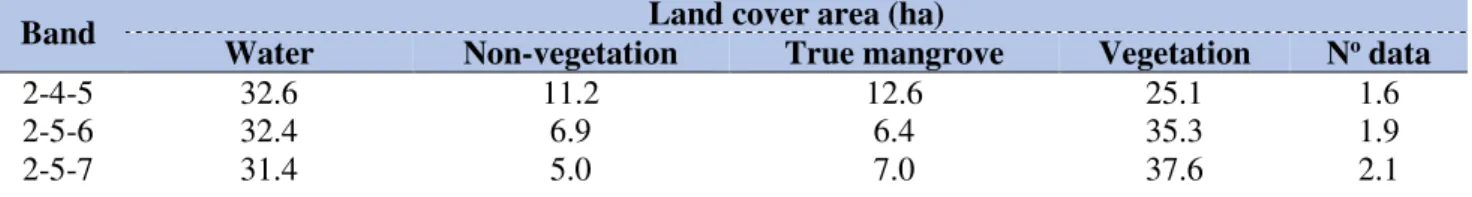
Table 2. Land cover area based on Unsupervised Classification.
Band Land cover area (ha)
Water Non-vegetation True mangrove Vegetation No data
2-4-5 32.6 11.2 12.6 25.1 1.6
2-5-6 32.4 6.9 6.4 35.3 1.9
4-5-6 33.4 11.0 4.9 32.7 1.2
2-7 31.6 10.5 4.0 33.9 2.5
Distribution of mangroves from unsupervised classification bands 2-3-4-5-6-7 are in accordance with the results of the field validation conducted on July 18-24, 2016. Validation shows that the true mangrove in Segara Anakan are
Rhizopora sp., Avicennia sp., Bruguiera sp.,
Avicennia sp., and Soneratia sp., while the associated mangroves are Acanthus sp. and Derris sp. (Figure 6).
A B
C D
Figure 6. True mangroves in Segara Anakan, Cilacap Regency, Central Java Province, Indonesia. A. Avicennia sp.; B. Rhizophora sp.; C. Detail of Rhizophora sp. D. Derris sp. and Nypa fruticans.
The combination of the three bands produces six composite variations. From band 2-5-6 combinations (Blue, NIR, SWIR-1), composites that present the most visually clear earth surface are 6-5-2 (SWIR-1, NIR, Blue) and for mangrove combinations 5-6-2 (NIR, SWIR-1, Blue). Band 2-4-5 (Blue, Red, NIR) combination, composite 2- 4-5-2 (Red, NIR, Blue) can display the surface of the earth very clearly, but no composite can show mangroves. Band 2-5-7 (Blue, NIR, SWIR-2) gives the best appearance of the earth on composites 7-5-2 (SWIR-7-5-2, NIR, Blue) and for mangroves 5-7-7-5-2 (NIR, SWIR-2, Blue). Band 4-5-6 (Red, NIR, SWIR-1) displays the best earth surface in composites 6-5-4 (SWIR-1, NIR, Red) and for mangroves 5-6-4 (NIR, SWIR-1, Red).
The appearance of the earth's surface displayed by the composite shows the surface object according to the original nature of the object (green vegetation, blue water, white or red settlements - depending on the color of the roof, white clouds, among others). As for mangrove vegetation, the composite band will display
mangroves with brownish colors; true mangroves will be shown in dark brown while the mangroves are associated with light brown. Reddish brown is the result of reflectance of vegetation objects from the NIR band. Mangroves are darker because of the influence of the wet growing environment detected by the blue band.
The unsupervised three band classification results from the OIF values are classified into five classes, namely water, non-vegetation, mangrove vegetation, vegetation, and clouds. All unsupervised classification results show true mangroves, which are to the east of Segara Anakan. True mangroves are distributed around the estuary. This is accordance with the true nature of mangroves that grow in tidal areas. True mangroves from 2-4-5 bands are detected in almost all regions in Segara Anakan, especially in the east and south.
The unsupervised classification result using 2-5-6 and 4-5-6 bands show true mangroves in the east of Segara Anakan but with a small amount, and some also in the south and west. In this
band, non-vegetation is also detected around true mangroves, possibly open land because based on the survey that has been carried out there are no settlements around the mangrove area in Segara Anakan except for certain areas that are nowadays residential areas.
The unsupervised classification result using 2-5-7 bands shows the true mangrove location very clearly on the east (majority) from Segara Anakan and slightly on the west. True mangroves are seen centered around estuary. The disadvantage of unsupervised classification with band 2-5-7 is that it is inadequate for non-vegetation detection, even though there is much open land in the area. Open land is detected as vegetation.
The unsupervised classification with three bands of OIF values is also compared with the classification results using seven bands (2-3-4-5-6-7). The results of data processing showed the same results, true mangroves were in the east of Segara Anakan with evident conditions, while in the west there were only very few. Classification with bands 2-3-4-5-6-7 shows the best distribution of true mangroves. The weakness of this classification is the detection of the objects that are classified as clouds in the location around the mangrove, even though the other classifications are not detected. The clouds (no data) are only in the west and very few in the north.
Classification with band 2-3-4-5-6-7, which gives the best results, shows that it is caused by a combination of the wavelength spectrum of the band. Bands 2-3-4-5-6-7 can detect the presence of vegetation. Band 6 and 7 (SWIR-1 and SWIR-2) can detect soil moisture and vegetation. Based on the combination of these wavelengths, the objects on the earth's surface can be detected very well, although there are some that are not suitable. Based on the area calculation of unsupervised classification, band 2-4-5 combinations have the largest area of true mangrove, namely 12.6 ha and the least are classification with bands 2-3-4-5-6-7, which is 4.0 ha. The extent of true mangrove in band 2-4-5 is due to the lack of the combination to separate between true mangrove and vegetation while band 2-3-4-5-6-7 can detect objects very well. Band 2-4-5 combinations are recommended for true mangrove detection.
Discussion
Mangroves are vegetation that grows around coastal areas that are still affected by tides. The existence of mangroves on the coast is very important, therefore mangrove monitoring is needed, including by using remote sensing
technology namely Landsat 8. The large number of Landsat 8 bands makes its own difficulties when determining canal combinations for an object (mangrove). By using the OIF method, the best bands for detection of mangroves in this study is 2-5-6 (Blue, NIR, SWIR-1) with a combination for visual display is 5-6-2 (NIR, SWIR-1, Blue). Compared with the study of Marini et al. (2015), there are differences in the best bands from Landsat 8 for mangrove detection, namely 3-5-7 (Green, NIR, SWIR-2) with 5-7-3 visual displays (NIR, SWIR-2, Green), while research by Manoppo et al. (2015), Landsat 8 bands suitable for mangrove detection are 4-5-6 (Red, NIR, SWIR-1), and from SPOT 6 are 1-3-4 (Blue, Red, NIR).
Based on the results of a 5-6-2 (NIR, SWIR-1, Blue) bands combination, the mangrove color looks brownish. There are differences in the color of mangroves in the Segara Anakan area. In the western part, light brown color dominates while in the east it is dominated by dark brown. This is caused by differences in the genus of mangrove that grows in the area. Based on the results of field validation, mangroves in the west are mangrove associations and in the east are dominated by true mangrove.
The advantage of this OIF method is to make it easier to monitor Mangrove conditions in a large area with certain accuracy. The OIF method still has weaknesses if the image data used has not been done radiometric correction. This condition will result in a classification with low accuracy. The use of satellite imagery is more efficient and makes it easier to monitor extensive mangrove areas. The object boundary between vegetation canopy and height vegetation of true mangrove is still needed further studies in the next research.
Conclusion
Remote sensing data can be used for mangrove detection. The large number of bands on Landsat 8 can be a problem in getting an RGB combination for an object, one of which is a true mangrove. OIF techniques make it easier to determine the channel combination. Based on OIF analysis, the highest rating is the RGB combination is 2-5-6 (Blue, NIR, SWIR-1) with a value of 0.177 and for RGB 2-5-6 visualization that is suitable for true mangroves is 5-6-2 (NIR- SWIR-1, Blue).
Acknowledgments
The authors thank Remote Sensing Applications Center LAPAN, Technology and Data Center LAPAN, Universitas Gadjah Mada, Indonesian Mangrove Team, and M. Sufwandika Wijaya (Geospatial Information Agency) for supporting this research project.
References
ADAM, E.; MUTANGA, O.; RUGEGE, D. 2010. Multispectral and hyperspectral remote sensing for identification and mapping of wetland vegetation: a review. Wetl. Ecol. Manag., v. 18, p. 281-296. ANGGARITA, J. L.; TILLEY, A.; HAWKINS, J. P.; PEDRAZAD, C.; ROBERTS, C. M. 2018. Land use patterns and influences of protected areas on mangroves of the eastern tropical Pacific. Biological Conservation, v. 227, p. 82-91.
ARUMUGAM, G.; RAJENDRAN, R.; GANESAN, A.; SETHU, R. 2018. Bioaccumulation and translocation of heavy metals in mangrove rhizosphere sediments to tissues of
Avicennia marina-A field study from tropical mangrove forest. Environmental Nanotechnology, Monitoring, & Management, v. 10. p. 272-279. ASRININGRUM, W. 2002. Studi Kemampuan Landsat ETM+ untuk Identifikasi Bentuk Lahan (Landform) di Daerah Jakarta (Study of Landsat ETM + Ability to Identify Land Forms in the Jakarta Area). Thesis. Indonesian. Bogor Agriculture University. Indonesia.
ASRININGRUM, W. 2008. Model Analisis Terumbu Karang Menggunakan Data Penginderaan Jauh. Bunga rampai: Analisis Geomorfologi Terumbu Karang di Kabupaten Sikka (The Coral Reef Analysis Model uses remote sensing data. Book chapter: Analysis of Coral Reef Geomorphology in Sikka Regency). Indonesian. LAPAN. Indonesia.
BLASCHKE, T.; HAY, G.J.; KELLY, M.; LANG, S.; HOFMANN, P.; ADDINK, E.; QUEIROZ FEITOSA, R.; VAN DER MEER, F.; VAN DER WERFF, H.; VAN COILLIE, F.; TIEDE, D. 2014. Geographic object-based image analysis – towards a new paradigm. ISPRS J. Photogramm. Remote Sens., v. 87, p. 180-191.
CHAVEZ, P.S. JR.; BERLIN, G. L.; SOWERS, L. B. 1982. Statistical Method for Selecting Landsat MSS Ratios, Journal of Applied Photographic Engineering, v. 8, n. 1, p. 23-30.
CLARK, B.; SUOMALAINEN, J.; PELLIKKA, P. 2011. An historical empirical line method for the retrieval of surface reflectance factor from multi-temporal SPOT HRV, HRVIR and HRG multispectral satellite imagery. Int. J. Appl. Earth Obs. Geoinform., v. 13, p. 292-307.
DEBDIP, B. 2013. Optimum Index Factor (OIF)
for Landsat Data: A Case Study on Barasat Town, West Bengal, India. International Journal of Remote Sensing & Geoscience, v. 2, n. 5, p. 11-16. DENG, D.; CHEN, H.; TAM, N. F. Y. 2015. Temporal and spatial contamination of polybrominated diphenyl ethers (PBDEs) in wastewater treatment plants in Hong Kong. Sci. Total Environ., v. 502, p. 133-142.
FARZANA, S.; CHEN, J.; PAN, Y.; WONG, Y. S.; TAM, N. F.Y. 2017. Antioxidative response of
Kandelia obovata, a true mangrove species, to polybrominated diphenyl ethers (BDE-99 and BDE-209) during germination and early growth. Marine Pollution Bulletin, v. 124, p. 1063-1070. GREEN, E. P.; CLARK, C. D.; EDWARDS, A. J. 2000. Remote Sensing Handbook for Tropical Coastal Management: Image classification and habitat mapping. UNESCO, Paris, pp. 141-154. HAUSER, L. T.; VU, G. N.; NGUYEN, B. A.; DADE, E.; NGUYEN, H. M.; NGUYEN, T. T. Q.; LE, T. Q.; VU, L. H.; TONG, A. T. H.; PHAM, H. V. 2017. Uncovering the spatio-temporal dynamics of land cover change and fragmentation of mangroves in the Ca Mau peninsula, Vietnam using multi-temporal SPOT satellite imagery (2004-2013). Appl. Geogr., v. 86, p. 197-207. HOSSAIN, M. D.; INAFUKU, M.; IWASAKI, H.; TAIRA, N.; MOSTOFA, M. G.; OKU, H. 2017. Differential enzymatic defense mechanisms in leaves and roots of two true mangrove species under long- term salt stress. Aquatic Botany, v. 142, p. 32-40.
JOHNSON, B.; XIE, Z. 2011. Unsupervised image segmentation evaluation and refinement using a multi-scale approach. ISPRS J. Photogramm. Remote Sens. v. 66, p. 473-483.
JUN, L. 2008. Research on False Color Image and Enhancement Methods Based on Ratio Images. The International Archives of the Photogrammetry, Remote Sensing and Spatial Information Sciences, V. XXXVII, p. 1151-1154.
KAMAL, M.; JOHANSEN, K. 2017. Explicit area-based accuracy assessment for mangrove tree crown delineation using Geographic Object-Based image analysis (GEOBIA), Earth resources and environmental remote sensing/GIS applications VIII. Int. Soc. Opt. Photonics 104280I.
KATHIRESAN, K.; BINGHAM, B. 2001. Biology of mangroves and mangrove ecosystems. Adv. Mar. Biol., v. 40, p. 81-251.
KIRUI, K. B.; KAIRO, J. G.; BOSIRE, J.; VIERGEVER, K. M.; RUDRA, S.; HUXHAM, M.; BRIERS, R. A. 2013. Mapping of mangrove forest land cover change along the Kenya coastline using Landsat imagery. Ocean Coast. Manag., v. 83, p. 19-24.
KITAMURA, S.; ANWAR, A.; CHANIAGO, A.; BABA, S. 1997. Handbook of Mangrove in Indonesia. Edisi ke-3. Ministry of Foresty Indonesia, Publications. 199p.
KRAUSS, K. W.; MCKEE, K. L.; LOVELOCK, C. E.; CAHOON, D. R.; SAINTILAN, N.; REEF, R.; CHEN, L. 2014. How mangrove forests adjust to rising sea level. New Phytol., v. 202, p. 19-34. KUENZER, C.; BLUEMEL, A.; GEBHARDT, S.; QUOC, T. V.; DECH, S. 2011. Remote sensing of mangrove ecosystems: a review. Remote Sens., v. 3, p. 878-928.
KUSUMANINGTYAS, M. A.; HUTAHAEAN, A. A.; FISCHER H. W.; MAYO, M. P.; RANSBY, D.; JENNERJAHN, T. C. 2019. Variability in the organic carbon stocks, sources, and accumulation rates of Indonesian mangrove ecosystems. Estuarine, Coastal, and Shelf Science, v. 218, p. 310-323.
LU, D.; WENG, Q. 2007. A survey of image classification methods and techniques for improving classification performance. Int. J. Remote Sens., v. 28, p. 823-870.
LUGO, A. E.; SNEDAKER, S. C. 1974. The ecology of mangroves. Ann. Rev. Ecol. Systemat., v. 5, p. 39-64.
LUONG, N. V.; TATEISHI, R.; HOAN, N. T. 2015. Analysis of an impact of succession in mangrove forest association using remote sensing and GIS technology. J. Geogr. Geol., v. 7, p. 106-116
MANOPPO, A. K. S.; ANGGRAINI, N.; MARINI, Y. 2015. Identifikasi Mangrove Dengan Metode Optimum Index Factor (OIF) Pada Data SPOT 6 dan Landsat 8 di Pulau Lingayan (Mangrove Identification Using the Optimum Index Factor (OIF) Method for SPOT 6 and Landsat 8 Data on Lingayan Island). MAPIN Proceedings. pp. 68-76.
MARINI, Y.; MANOPPO, A. K. S.; ANGGRAINI, N. 2015. Teknik Penentuan Citra Komposit Untuk Identifikasi Mangrove Menggunakan Landsat - 8 di Pulau Subi Kecil. Bunga Rampai: Mangrove, Citra Penginderaan Jauh dan Identifikasinya (Techniques for Determining Composite Imagery for Mangrove Identification Using Landsat-8 on Small Subi Island. Book chapter: Mangrove, Remote Sensing Image and Identification). Ed: Asriningrium, W. dan Parwati, E. pp. 1-19. IPB Press.
NASA. 2019. Landsat 8. NASA. Accessed: March 24, 2019. https://landsat.gsfc.nasa.gov/landsat-data-c.
NONTJI, A. 2005. Laut Nusantara (Indonesian Sea). book. in Indonesian. Djambatan. Indonesia. PHAM, T. D.; YOSHINO, K. 2016. Impacts of mangrove management systems on mangrove changes in the Northern Coast of Vietnam. Tropics, v. 24, p. 141-151.
PURWANTO, A, D.; WINARSO, G.; JULZARIKA, A. 2018. Identifikasi Mangrove Sejati Menggunakan Metode OBIA Berdasarkan Citra Landsat 8 Oli Dan Landsat 7 ETM+. Studi Kasus: Kawasan Mangrove Segara Anakan, Cilacap (Identification of True Mangrove Using OBIA Method Based on Landsat 8 OLI and Landsat 7 ETM+ Imagery. Case Study: Anakan Area, Cilacap). Seminar Nasional Geomatika Proceeding. pp. 851-860.
QAID, A. M.; BASAVARAJAPPA, H. T. 2008. Application of Optimum Index Factor Technique to Landsat-7 Data for Geological Mapping of North East of Hajjah, Yemen. American-Eurasian Journal of Scientific Research, v. 3, n. 1, p. 84-91. THU, P. M.; POPULUS, J. 2007. Status and changes of mangrove forest in Mekong Delta: case study in Tra Vinh, Vietnam. Estuar., Coast. Shelf Sci., v. 71, p. 98-109.
TOMLINSON, P. B. 1994. The Botany of mangrove. Cambridge University Press, New York. 436p.
VO, Q. T.; OPPELT, N.; LEINENKUGEL, P.; KUENZER, C. 2013. Remote sensing in mapping mangrove ecosystems-an object-based approach. Remote Sens., v. 5, p. 183-201.
WANG, M.; CAO, W.; GUAN, Q.; WU, G.; WANG, F. 2018. Assessing changes of mangrove forest in a coastal region of southeast China using
multi-temporal satellite images. Estuarine, Coastal, and Shelf Science, v. 207, p. 283-292.
WIBISONO, M. S. 2011. Pengantar Ilmu Kelautan (Introduction to Marine Sciences). Indonesian. UI Press.
ZHAN, Q.; MOLENAAR, M.; TEMPFLI, K.; SHI, W. 2005. Quality assessment for geo‐spatial objects derived from remotely sensed data. Int. J. Remote Sens., v. 26, p. 2953-2974.