Ciência Rural, v.47, n.8, 2017.
Water and sucrose diffusion coefficients during osmotic
dehydration of sapodilla (
Achras zapota
L.)
Coeficiente de difusão da água e sacarose durante a desidratação osmótica do sapoti (Achras zapota L.)
Lívia Muritiba Pereira de Lima Coimbra1 Hayanna Adlley Santos de Arruda1 Erilane de Castro Lima Machado2 Silvana Magalhães Salgado3
Sônia Sousa Melo Cavalcanti de Albuquerque4 Samara Alvachian Cardoso Andrade4*
ISSNe 1678-4596
Received 06.25.15 Approved 03.23.17 Returned by the author 06.23.17
INTRODUCTION
Sapodilla is a fruit from Central America that has adapted well in all regions of the Brazilian territory; however, it has stood out as a crop in the Northeastern region of this country because of its
favorable edaphoclimatic conditions (GOMES, 2007). According to GONSALVES (2002), 100g of the fruit’s pulp yield 96 calories, 75% moisture, 26% carbohydrates, 0.7% proteins, and minerals such as calcium, phosphorus, iron, and A, C, and B vitamins.
1Programa de Pós-graduação em Ciência e Tecnologia de Alimentos (PGCTA), Universidade Federal Rural de Pernambuco (UFRPE),
Recife, PE, Brasil.
2Núcleo de Nutrição, Centro Acadêmico de Vitória, Universidade Federal de Pernambuco (UFPE), Recife, PE, Brasil. 3Departamento de Nutrição, Universidade Federal de Pernambuco (UFPE), Recife, PE, Brasil.
4Departamento de Engenharia Química (DEQ), Universidade Federal de Pernambuco (UFPE), Prof. Moraes Rêgo, 1235, 50670-901, Recife,
PE, Brasil. E-mail: [email protected]. *Corresponding author.
ABSTRACT: Sapodilla is an original fruit from Central America that is well adapted in all regions of the Brazilian territory. Despite its
wide adaptation and acceptance in fruit markets, it is rare to find it outside tropical regions, partially because of its high perishability. The
development of alternative, simple, and inexpensive methods to extend the conservation and marketing of these fruits is important, and osmotic
dehydration is one of these methods. The main objective of this study was to determine the water and sucrose diffusion coefficients during the osmotic dehydration of sapodilla. This process was performed in short duration (up to 6h) to evaluate detailed information on water loss and solids gain kinetics at the beginning of the process and in long duration (up to 60h) to determine the equilibrium concentrations in sapodilla. The immersion time had greater influence on the water and sucrose diffusion coefficients (P<0.05); the maximum water loss (WL) and solute gain (SG) occurred in the osmotic solution at the highest concentration. Water and sucrose diffusion coefficients ranged from 0.00 x 10⁻¹⁰ m2/s
to 1.858 x 10⁻¹⁰ m2/s, and from 0.00 x 10⁻¹⁰ to 2.304 x 10⁻¹⁰ m2/s, respectively. Thus, understanding the WL and SG kinetics during the process of
sapodilla osmotic dehydration could significantly contribute to new alternatives of preservation and commercialization of this fruit. Key words: osmotic dehydration, mass transfer, diffusion coefficient, sapodilla.
RESUMO: O sapoti é um fruto originário da América Central que está bem adaptado em todas as regiões do território brasileiras. Apesar de
sua ampla adaptação e aceitação, o fruto é raro fora das regiões tropicais, o que se deve em parte à sua alta perecibilidade. O desenvolvimento de métodos alternativos, simples e de baixo custo para prolongar a conservação e comercialização desses frutos é importante e a desidratação osmótica é um desses métodos. O objetivo principal desta pesquisa foi determinar os coeficientes de difusão da água e sacarose durante a desidratação osmótica de sapoti. Desidratação osmótica de sapoti foi realizada em um curto período de tempo (até 6 horas), tendo como finalidade fornecer informações detalhadas da cinética da perda de água e ganho de sólidos no início do processo, e em longos períodos de tempo (até 60 horas), a fim de determinar as concentrações de equilíbrio no sapoti. O tempo de imersão teve maior influência sobre o coeficiente de difusão da água e sacarose (P <0,05); a máxima perda de umidade (PU) e ganho de solutos (GS) pela fruta ocorreram na solução osmótica de maior concentração (60°Brix). O coeficiente de difusão da água e sacarose variou de 0,00 x 10⁻¹⁰ a 1,858 x 10-10 m2 s-1
e de 0,00 x 10⁻¹⁰ a 2,304 x 10-10 m2s-1, respectivamente. Assim, torna-se válida a realização desta pesquisa, tendo como objetivo conhecer a
cinética da PU e GS durante a desidratação osmótica do sapoti e oferecer ao produtor uma nova alternativa para preservar e comercializar
o referido fruto.
Palavras-chave: desidratação osmótica, transferência de massa, coeficiente de difusão, sapoti.
Despite its wide adaptation and acceptance
in fruit markets, sapodilla is rare to find outside tropical
regions, partially because its high perishability. As a climacteric fruit, its fast maturation under natural conditions hinders preservation and marketing (DAMASCENO et al., 2008). Therefore, the development of alternative, simple, and inexpensive methods to extend the conservation and marketing of these fruits is important, and osmotic dehydration is one of these methods.
Osmotic dehydration (OD) consists of partial removal of water from cellular tissues by the immersion of food (vegetables, fruits, meat) in a hypertonic aqueous solution. During the osmotic process, the mass transfer in plant tissues is complex,
being influenced by the cell wall structure. The driving
force for the dehydration is the higher chemical potential of water in the food cells in relation to that in the osmotic solution (OS). In contrast, the chemical potential of the solute in the OS is higher than in
food cells. Thus, there are two simultaneous fluxes,
i.e., water from the food to the solution, and solutes from the OS to food. Since the cell membrane is not perfect, selective leaching of solutes from the cells to the OS can also occur (TORREGGIANI, 1993; PORCIUNCULA, et al., 2013).
However, in the process of OD, solute transfer is usually limited to the differential permeability of cellular membranes, and
consequently, water loss fluxes are higher than
solute gain transfer along the time, especially in the beginning of osmotic process, as a consequence of the higher process driving force between the fruit
and the hypertonic solution during the first hours of
process (AMINZADEH, et al., 2012).
Osmotic dehydration is widely used as pre - treatment to the other process, such as hot air drying, freezing, lyophilization among others, and this treatment also has the advantage of a good conservation
of sensory attributes such as color, flavor and texture.
The process of osmotic dehydration (OD) has been successfully used in several foods such as acerola (SILVA et al., 2012), pineapple (LOMBARD et al., 2008), pumpkin (SILVA et al., 2011), and banana (MERCALI et al., 2011), among others. However, this method has not been reported in OD of sapodilla.
Despite being a technology extensively studied, there is still great interest in better understanding the phenomena and description of the involved mechanisms. Mathematical modeling can be a useful tool for understanding the kinetics of OD (PORCIUNCULA, et al., 2013).
The objectives of present study were to evaluate the osmotic dehydration kinetics of sapodilla
in water and sucrose solution. A simplified model
based on Fick’s second law was used to evaluate
the effective diffusion coefficients for obtaining the
detailed information on water loss and solid gain during osmotic dehydration. Knowledge of these parameters can contribute in producing fruits with longer shelf life, and therefore, extended commercialization potential.
MATERIALS AND METHODS
Refrigerated ripe sapodillas (Achras
zapota L.) (15° to 21°Brix) (length of 68.60 ± 3.1mm,
diameter of 68.1 ± 2.2mm) were randomly purchased at local supermarkets (in Recife-PE, Brazil). Fruits were visually selected by the peel’s brown shade, ovoid shape, and absence of physical damage. They were washed in running water, dried on paper towels, and cut in four parts in the longitudinal, i.e., in quarters. Peel and seeds were manually removed.
Commercial sucrose dissolved in distilled water was used as the osmotic agent. Three levels of sucrose concentration (20ºBrix, 40ºBrix, and 60ºBrix) were selected for a 22 factorial planning,
including three central points, thus making the total number of experiments equal to 7. These concentrations were chosen based on results obtained by ANDRADE et al. (2007).
The experimental design was evaluated using coded levels named as -1, 0, and 1. The independent variables were sucrose concentration and immersion time; the dependent variables were
water and sucrose diffusion coefficients (Table 1).
The process was carried out in a 1L beaker containing different concentrations of osmotic solutions at controlled temperatures (28°C+1°C) with constant stirring (mechanical) (110rpm). The sample/ solution ratio was 1:20 to minimize changes in concentration in the osmotic solution (ANDRADE et al., 2007). Sapodilla quarters (about 50g each quarter)
were weighed, tied to colored lines (for identification
of time points), and placed in the beakers.
At predetermined time intervals, sapodilla quarters were removed from the beakers, drained for 1 minute, placed on paper towels to remove excess syrup, and weighed. Samples were not rinsed with water.
The first samples were taken at early time
Moisture content was determined by placing samples in an air drier at 105ºC at atmospheric pressure until constant weigh was obtained (AOAC, 2002; Method 985.14). Soluble solids (ºBrix) were determined using an ATAGO bench-top refractometer (Temperature 20ºC). These instruments measure the degree to which light is bent as it passes through a sample (i.e., the refractive index). Refractive index is affected by the temperature of the solution. The °Brix scale is currently based on a reference temperature of 20°C (68°F).The analyses were performed in triplicate.
The rate of moisture loss during osmotic dehydration was calculated based on the analytical solution of Fick’s second law as shown in equation (1), and the solids gain rate shown in equation (2), which
represents a modified equation (1) (TELIS et al., 2004).
(1)
(2) Where X and C are the moisture content and sugar concentration, respectively, at time t, X0
and C0 are the initial values of these variables, and
Xeq and Ceq are the corresponding equilibrium values.
D is the effective diffusion coefficient and L is the slab thickness. The sapodilla samples presented an average of 1.0cm thickness measured through a caliper during osmosis.
The analyses of the results were performed using the Statistica 5.0 software (STATSOFT, 1997)
at a significance level of 5%.
RESULTS AND DISCUSSION
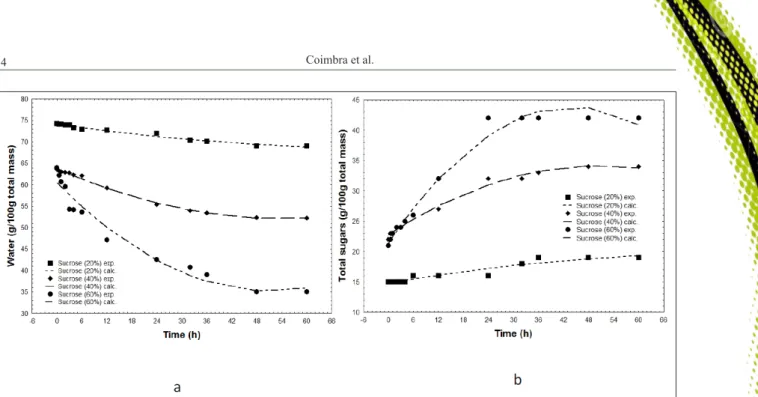
In figures 1a and 1b are presented the water
loss and solid gain curves during the sapodilla osmotic dehydration process. Increased concentrations in the solution promoted maximum water loss and solids gain. FALADE et al. (2007) observed similar results
when dehydrating watermelon rectangles using different concentrations of sucrose osmotic solutions. The authors reported that the sucrose solution at 60° Brix induced greater water loss and solids gain compared to the 50°Brix and 40°Brix solutions. These authors explained that the large concentration differences between the osmotic solution and watermelon increase the solute and water diffusion rates. KHOYI & HESARI (2007) and ANDRADE et al. (2007) reported similar results with dehydrated apricot slices and jenipapo respectively.
The reduction in water content in the first
two hours of the osmotic dehydration of sapodilla was 0.5%, 1.12%, and 6.81% for the 20, 40, and 60°Brix solutions, respectively. These values are
considered small and significantly lower than the
values of 15.11% and 20.85% moisture loss obtained by SILVA et al. (2011) when dehydrating bleached pumpkins during 2 hours using 50 and 65°Brix sucrose solutions, respectively.
This low level of water loss in the first 2
hours of treatment might be due to characteristics in the sapodilla plant tissue, which are determinants on the mass transfer kinetics. According to CHIRALT & TALENS (2005), mass transport and movement inside the material is determined by characteristics of the cellular tissue such as cell size, porosity, tortuosity, and cell membrane permeability, among others.
In osmotic dehydration process several aspects, such as temperature, pressure, shape, contact surface, solution: fruit ratio among others (CHENLO
et al., 2007) could influence in water loss and solid
gain results, however, these factors were not evaluated in this present study.
Percentages of solids gain observed in
the first 2 hours of the process were 0%, 9.09%,
and 14.28% for the 20, 40, and 60°Brix solutions, respectively. These are low values; however, they favor the development of a product that is similar to the natural product.
Conversely, ANDRADE et al. (2007) and FALADE et al. (2007) reported higher water loss and
solids gain values in the first 2 hours that decreased
over time during the process. BRENNAN (2003), CHAVAN (2012) and TORREGIANI (1993) stated
that water loss occurs mainly during the first 2 hours
in the process, and the largest solids gain during the
first 30 minutes of osmotic dehydration. After 30
minutes, e transfer speed becomes progressively slow until reaching a water loss plateau, while solids gain continues to increase until reaching equilibrium.
The water loss and solids gain (Figures 1a and 1b) increased with the progression of time. Table 1 -Independent variables coded for osmotic dehydration
of sapodilla.
Variables ---Coded Levels---
-1 0 1
Sucrose (ºBrix) 20 40 60
Similar results were obtained by MERCALI et al. (2011), SILVA et al. (2012), and SOURAKI et al. (2012) when dehydrating banana using sucrose and salt mixed solution, acerola using sucrose solution, and green bean cylinders using salt as the osmotic agent, respectively.
Water loss reached equilibrium in 48h in all three concentrations (20, 40, and 60°Brix). Solids gain reached equilibrium in 36, 48, and 24h at the 20, 40, and 60°Brix osmotic solutions, respectively, from
which significant alteration of water loss and solids
gain were not observed.
Percentages of moisture loss and solids gain for the 20, 40, and 60°Brix concentrations were 7.09%, 16.85%, and 45.20%, and 26.27%, 54.54%, and 100%, respectively, at the end of the process
(60h). These results demonstrated that although the highest concentrations promote water loss they implied in greater solid gain.
According to TORREGGIANI (1993), ideally, the promotion of water loss should be attained with minimal solids gain because the impregnation of solutes to the food might modify the sensory and nutritional properties of the product. Table 2 show the equilibrium concentrations for water and sucrose, respectively, determined in sapodilla treated with different osmotic solutions.
The presence of a differentially permeable membrane rather than a semipermeable membrane in sapodilla may explain why this equilibrium required more time to be achieved than what is reported in other fruits (ANDRADE et al., 2007). According to TORTOE
Figure 1 - Kinetics of water loss (a) and sugar gain (b) in sapodilla during osmotic treatment in solutions of varied sucrose concentrations.
Table 2 - Equilibrium concentration and effective diffusion coefficient of water and sucrose during the osmotic treatment of sapodilla.
Experiment
number S (%) T(h)
Effective diffusion coefficient D water (10-10 m2s-1)
Equilibrium concentration (g/100 g total mass) (water)
Effective diffusion coefficient D sucrose (10-10 m2s-1)
Equilibrium concentration (g/100 g total mass)
(sucrose)
1 20 4 1.858 2.304
2 60 4 1.526 1.450
3 20 60 0.00 69.00 0.0 19
4 60 60 0.00 35.00 0.0 42
5 40 32 0.391 52.00 0.209 34
6 40 32 0.395 52.31 0.210 33
(2010), factors such as chemical composition (protein, carbohydrates, fat, and salt), physical structure
(porosity, cell arrangement, and fiber orientation),
and pretreatments can affect the permeability of cell
membrane and cell wall structure, and thus, influence
water loss and solids gain in the raw material.
In this study, three different effective
diffusion coefficients were calculated for water
and sucrose under the conditions used for osmotic treatments. The calculation was based on data collected early in the treatment when samples were maintained in osmotic solutions for 4h. The second and third calculations used data from samples treated for longer periods, 32 and 60 hours, respectively (Table 2).
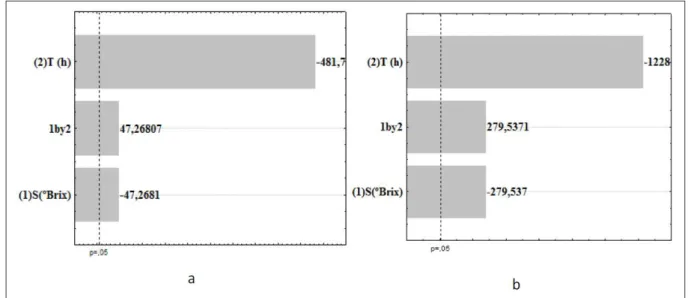
The analysis of variance of the factorial planning showed that immersion time had the greatest effect (P<0.05) on both effective diffusion
coefficients (water and sucrose) (Figures 2a and 2b). The greater the immersion time lower the coefficient
of diffusivity of the sucrose and water. In addition, the different sucrose concentrations used in this
study showed significant effects; however, with less
intensity on the water and sucrose effective diffusion
coefficients than immersion time.
The apparent effective diffusion coefficient
of water and sucrose varied from 0.00 x 10⁻¹⁰ m2s-1 to
1.858 x 10⁻¹⁰ m2s-1,and from 0.00 x 10⁻¹⁰ m2s-1 to 2.304
x 10-10 m2s-1, respectively; these values are within
the range of sucrose concentration and temperature evaluated in this study. According to SILVA et al. (2012), the comparison between diffusivity values
reported in the literature became difficult due to
the use of different estimation methods and models in addition to composition and physical structure variation in food. As an example, SOURAKI et al.
(2012) report water effective diffusion coefficientss
ranging from 1.776 x 10⁻¹⁰ m2s-1 to 2.707 x 10⁻¹⁰ m2s-1, and solutes effective diffusion coefficientss ranging
from 1.126 x 10⁻¹⁰ m2s-1 to 1.667 x 10⁻¹⁰ m2s-1 when
osmotically dehydrating green bean cylinders. Table 2 showed that with the increase in treatment time, considering the same °Brix, both water and sucrose diffusion rates decrease. According to SINGH et al. (2007), rapid water loss and solid absorption on the sample’s surface at the beginning of the process may result in structural changes that lead to compression of surface layers and increased mass transfer resistance. In addition, the gradual absorption
of solids can result in the formation of a superficial
layer that acts as a barrier against water removal and absorption of solids. According to TELIS et al. (2004), the diffusion rate decreases, reducing the
effective diffusion coefficient when the water and
sucrose concentration inside the fruit become close to reaching the equilibrium value. The equilibrium is
considered when are not observed significant changes
in water loss and solid gain.
Table 2 showed that with the increase in ºBrix, considering the same treatment time, both water and sucrose diffusion rates decrease. This fact is probably due to the formation of a thick layer of sugar around the fruit, hindering the transfer of mass.
Still on the table 2, observed that an inverse behavior of immersion time over the
sucrose and water diffusion coefficients, i.e.,
increased immersion time decreases water and
solute diffusion coefficients. Similar results
were obtained by BARBARA et. al.(2013) when dehydrating banana (Prata variety).
During the osmotic process a non-uniform moisture gradient is developed and the effective diffusivity is not constant, i.e., varies with the position inside the sample and time of dehydration (BARBARA et al., 2013).
CONCLUSION
The immersion time showed the greatest
influence on water and sucrose effective diffusion coefficients; the maximum water loss and solids gain
in the studied fruit occurred in the osmotic solution of highest concentration. The apparent effective
diffusion coefficients calculated for water and
sucrose in the experiments conditions ranged from 0.00 x 10⁻¹⁰ m2s-1 to 1.858 x 10⁻¹⁰ m2s-1, and from
0.00 x 10⁻¹⁰ m2s-1 to 2.304 x 10⁻¹⁰ m2s-1, respectively.
ACKNOWLEDGEMENTS
The authors are thankful to Conselho Nacional
de Desenvolvimento Científico e Tecnológico (CNPq) for the financial support through the process number 473208/2011-3.
REFERENCES
AMINZADEH, R. et al. Preserving Melons by Osmotic Dehydration in a Ternary System Followed by Air-Drying. Food and Bioprocess
Technology, v. 5, n.4, p.1305–1316, 2012. Available from: <https:// link.springer.com/article/10.1007/s11947-010-0488-0>. Accessed: Aug.15, 2015. doi: 10.1007/s11947-010-0488-0.
ANDRADE, S.A.C. et al. Evaluation of water and sucrose effective
diffusion coefficients during osmotic dehydration of jenipapo
(Genipa americana L.). Journal of Food Engineering, v. 78 n. 2, p.551-555, 2007. Available from: <http://www.sciencedirect. com/science/article/pii/S0260877405007296>. Accessed: Aug. 20,2015. doi: 10.1016/j.jfoodeng.2005.10.023.
AOAC. Association of Official Analytical Chemists: Official Methods of Analysis. Washington: DC, EUA, 2002. 16th ed.
BARBARA, D.A. et. al. Determining the effective diffusion
coefficient of water in banana (Prata variety) during osmotic
dehydration and its use in predictive models. Journal of Food
Engineering, v.119, n.3, p. 490-496, 2013. Available from: <http:// dx.doi.org/10.1016/j.jfoodeng.2013.06.011>. Accessed: Aug.20, 2015. doi: 10.1016/j.jfoodeng.2013.06.011.
BRENNAN, J.G. Dielectric and osmotic drying. In: Encyclopedia of Food Sciences and Nutrition. London, editor: Elsevier Science,
2003. p.1938-1942. eBook ISBN: 9780080917917. Hardcover ISBN: 9780122270550.
CHAVAN, U.D.; AMAROWICZ, R. et al. Osmotic dehydration process for preservation of fruits and vegetables. Journal of Food Research, v. 1, n. 2, p.201-209, 2012. Available from: <http:// dx.doi.org/10.5539/jfr.v1n2p202>. Accessed: Sept. 05, 2015. doi: 10.5539/jfr.v1n2p202.
CHENLO, F. et al. Osmotic dehydration of chestnut with sucrose: Mass transfer processes and global kinetics modeling. Journal of Food Engineering, v. 78, n. 3, p.765-774, 2007. Available from: <https://doi.org/10.1016/j. jfoodeng.2005.11.017>. Accessed: Sept. 10, 2015. doi: 10.1016/j.jfoodeng.2005.11.017.
CHIRALT, A.; TALENS, P. et al. Physical and chemical changes induced by osmotic dehydration in plant tissues. Journal of Food
Engineering, v. 67, n. 1-2, p.167-177, 2005. Available from: <https://doi.org/10.1016/j.jfoodeng.2004.05.055>. Accessed: Sept. 11, 2015. doi: 10.1016/j.jfoodeng.2004.05.055.
DAMASCENO, L.F. et al. Avaliação da aceitação de sapoti de umidade intermediária. Revista Ciência Agronômica, v. 39, n. 1, p.177-180, 2008. Available from: <http://www.ccarevista.ufc. br/seer/index.php/ccarevista/article/view/44>. Accessed: Sept. 12, 2015. E-ISSN:18066690.
FALADE, K.O. et al. Kinetics of mass transfer, and colour changes during osmotic dehydration of watermelon. Journal of
Food Engineering, v. 80, n. 3, p.979-985, 2007. Available from: <https://doi.org/10.1016/j.jfoodeng.2006.06.033>. Accessed: Sept. 12, 2015. doi:10.1016/j.jfoodeng.2006.06.033 .
GOMES, R.P. Fruticultura brasileira. 13 ed. reimp. São Paulo, Editora Livraria Nobel, 2007. 446p.
GONSALVES, P. E. Livro dos alimentos. 2ª ed. São Paulo. MG Editores. 2002. 261p.
KHOYI, M.R.; HESARI, J. Osmotic dehydration kinetics of apricot using sucrose solution. Journal of Food Engineering, v. 78, n. 4, p.1355-1360, 2007. Available from: <https://doi.org/10.1016/j. jfoodeng.2006.01.007>. Accessed: Sept. 12, 2015. doi: 10.1016/j. jfoodeng.2006.01.007 .
LOMBARD, G.E. et al. Osmotic dehydration of pineapple as a pre-treatment for further drying. Journal of Food Engineering, v. 85, n. 2, p.277–284, 2008. Available from: <https://doi.org/10.1016/j. jfoodeng.2007.07.009>. Accessed: Sept. 11, 2015. doi: 10.1016/j. jfoodeng.2007.07.009.
MERCALI, G.D. et al. Evaluation of water, sucrose and NaCl effective diffusivities during osmotic dehydration of banana (Musa sapientum, shum.). LWT - Food Science and Technology, v. 44, n. 1, p.82-91, 2011. Available from: <https://doi.org/10.1016/j. lwt.2010.06.011>. Accessed: Set. 11, 2015. doi: 10.1016/j. lwt.2010.06.011 .
PORCIUNCULA, et al. Determining the effective diffusion
coefficient of water in banana (Prata variety) during osmotic
dehydration and its use in predictive models. Journal of Food
SILVA, K.S. et al. Osmotic dehydration process for low temperature blanched pumpkin. Journal of Food Engineering, v. 105, n. 1, p.56-64, 2011. Available from: <https://doi.org/10.1016/j. jfoodeng.2011.01.025>. Accessed: Sept. 20, 2015.doi: 10.1016/j. jfoodeng.2011.01.025.
SILVA, M.A.C. et al. Mass transfer during the osmotic dehydration of West Indian cherry. LWT - Food Science and Technology, v. 45, n. 2, p.246-252, 2012. Available from: <https://doi. org/10.1016/j.lwt.2011.07.032>. Accessed: Sept. 20, 2015. doi: 10.1016/j.lwt.2011.07.032.
SINGH, B. et al. Study of mass transfer kinetics and effective diffusivity during osmotic dehydration of carrot cubes. Journal of Food Engineering, v. 79, n. 2, p.471-480, 2007. Available from: <https://doi.org/10.1016/j. jfoodeng.2006.01.074>. Accessed: Sept. 20, 2015. doi: 10.1016/j.jfoodeng.2006.01.074.
ABBASI SOURAKI, B. et al. Mathematical modeling of moisture and solute diffusion in the cylindrical green bean during osmotic dehydration in salt solution. Food and Bioproducts Processing, v. 90, n. 1, p.64-71, 2012. Available from: <https://doi.org/10.1016/j. fbp.2010.11.015>. Accessed: Sept. 20, 2015. doi: 10.1016/j. fbp.2010.11.015.
STATSOFT. Computer program manual. Tulsa: Statsoft. (Statistica for Windows 5.0, 1995), 1997.
TELIS, V.R.N. et al. Diffusion coefficients during osmotic
dehydration of tomatoes in ternary solutions. Journal of Food
Engineering, v. 61, n. 2, p.253–259, 2004. Available from: <https://doi.org/10.1016/S0260-8774(03)00097-9>. Accessed: Sept. 20, 2015. doi: 10.1016/S0260-8774(03)00097-9.
TORREGGIANI, D. Osmotic dehydration in fruit and vegetable processing. Food Research International, v. 26, n. 1, p.59-68, 1993. Available from: <https://doi.org/10.1016/0963-9969(93)90106-S>. Accessed: Sept. 30, 2015.doi:10.1016/0963-9969(93)90106-S.
TORREGIANI, D.; BERTOLO, G. Osmotic pre-treatments in fruit processing: chemical, physical and structural effects. Journal of
Food Engineering, v. 49, n. 2-3, p.247−253, 2001. Available from:
<https://doi.org/10.1016/S0260-8774(00)00210-7>. Accessed: Oct. 20, 2015. doi: 10.1016/S0260-8774(00)00210-7.
TORTOE, C. A review of osmodehydration for food industry.