Ana de Souto Martins
Licenciatura em Genética e Biotecnologia
Interaction of West-Nile virus capsid
protein with lipid systems
Dissertação para obtenção do Grau de Mestre em
Genética Molecular e Biomedicina
Orientador: Nuno C. Santos, Professor Doutor, IMM
Co-orientador: Ivo C. Martins, Doutor, IMM
Júri:
Presidente: Prof. Doutora Ilda Maria Barros dos Santos Gomes Sanches Arguente: Prof. Doutor José Ricardo Ramos Franco Tavares
Vogal: Prof. Doutor Nuno Fernando Duarte Cordeiro Correia dos Santos
Interaction of West-Nile virus capsid protein with lipid systems
Copyright © Ana de Souto Martins, Faculdade de Ciências e Tecnologia, Universidade Nova de Lisboa.
iii
Acknowledgments
I want to thank and express my gratitude to everyone of the N.Santos lab of the IMM. All members, in some way, helped me to develop this work. To Prof. Nuno C. Santos, Head of the Unit and my supervisor, I owe all my gratitude for having provided me all the conditions I need and the excellent accompaniment at every moment. He encouraged me to continue and not giving up. I am also grateful to Dr. Ivo C. Martins, co-supervisor of my thesis, who constantly accompanied me in the laboratory work as well as in all steps of my thesis. I am especially thankful to Filomena A. Carvalho that also supported me and shared with me several crucial techniques for this project. She is an excellent professional who provides her time to teach all the processes in detail. I owe a special thanks to André F. Faustino who helped me to integrate many techniques and in crucial moments he always had time to teach me. To Teresa Freitas that supported me with technical assistance and helped me with some processes in the lab, I thank all this and their affection, comprehension and good humor every day. Also, there are various persons that we call the “the youngers” that made me very happy to have been part of this group (they are wonderful people with whom I enjoyed working). I can say that, Susana Reis was part of my whole journey in IMM, in the good and the less good moments she always had something to tell me and back me up.
To my friends from Vila Real, who shared with me the best moments of academic life and were always present despite the distance I thank you for reached with me this stage of my life. A special thanks to Diana, Ana, Ângela, Cátia, M. João and Soraia.
To my old friends from Almada, I do not even have words, they are part of a big and wonderful second family that will be to last a lifetime. They are really friends forever and for everything.
I want to acknowledge my family for always having being by my side. They were patient with me in all bad moments and with much sacrifice supported me. With my mother, my best friend, I learned not to give up and always fight for what I think it is right. My older brothers, Jorge and Luis, were my real support, my pride and forever an example to follow. They really battled for helping me to achieve everything I have today. I have a final word for the newest member of the family “the little”,
who certainly will accomplish me in the future.
v
Abstract
West-Nile Virus (WNV) infection occurs through the bite of Culex spp. mosquitoes and constitutes a serious public health threat. Despite the global spread and disease severity, there is no specific and effective treatment for WNV infection, in part due to a poor understanding of the virus life cycle. A key viral life cycle step is viral assembly and encapsidation, mediated by the capsid (C) protein interaction with RNA and host lipid structures. WNV C interactions with intracellular lipid droplets (LDs) and with very low-density lipoproteins (VLDL), crucial step for successful viral replication in related members of the Flaviviridae family, were studied via biophysical approaches. Zeta potential measurements showed that WNV C interaction with LDs requires K+ and LDs surface proteins. WNV C interaction with lipoproteins measured via dynamic light scattering (DLS), showed that WNV C binds to VLDL but not to low-density lipoproteins (LDL), in a potassium dependent manner. It was clear that in the presence of WNV C there is an increase of the VLDL hydrodynamic radius that correlates very well with WNV C estimated dimension. The WNV C (un)binding forces upon interaction with LDs and VLDL were quantitatively determined by atomic force microscopy (AFM)-based force spectroscopy. WNV C specifically binds to LDs and VLDL, in a potassium-dependent manner, but not to LDL. DLS was also performed to determine pep14-23 (an inhibitor of dengue virus
– DENV – C protein interaction with LDs and VLDL) effect on WNV C-VLDL binding. Data obtained indicate that pep14-23 may also be a potential inhibitor for WNV C key interactions. The results obtained in this study are in agreement with the previously observed for DENV, showing that WNV C and DENV C proteins interact in a similar manner with LDs and VLDL, and suggesting pep14-23 as a potential inhibitor of Flavivirus C proteins binding to host lipid systems.
vii
Resumo
A infeção com o Vírus do Nilo Ocidental (WNV do inglês) ocorre atrvavés da picada de mosquitos Culex spp. e constitui uma séria ameaça para a saúde pública. Apesar da sua disseminação a nível mundial e da severidade da doença, não existe um tratamento específico e eficaz, devido (em parte) à necessidade de um melhor conhecimento do ciclo de vida do vírus. Um passo chave do ciclo de vida viral é a montagem e a encapsidação do virus, mediada pela interação da proteína da cápside (C) com RNA viral e estruturas lipídicas do hospedeiro. A interação da WNV C com corpúsculos lipídicos (LDs do inglês) intracelulares e com lipoproteínas de muito baixa densidade (VLDL do inglês), um passo crucial para o sucesso da replicação viral em membros relacionados da família Flaviviridae, foi estudada através de técnicas biofísicas. As medidas de potencial zeta mostraram que a interação da WNV C com LDs requer K+ e poteínas à superfície das LDs. A interação da WNV C com liporpteínas medida por dispersão dinâmica de luz (DLS do inglês), mostrou que a WNV C liga-se às VLDL mas não às lipoproteínas de baixa densidade (LDL do inglês), numa interação dependente de potássio. Foi evidente que na presença de WNV C existe um aumento do raio hidrodinâmico das VLDL que se correlaciona muito bem com as dimesões estimadas para a WNV C. As forças de ligação da WNV C com LDs e VLDL foram quantificadas por espectroscopia de força baseada em microscopia de força atómia (AFM). A WNV C liga-se especificamente às LDs e às VLDL, numa interação dependente de potássio, mas não às LDL. A DLS também foi realizada para determinar o efeito do pep14-23 (um inibidor da interação da proteína C do vírus da dengue – DENV do inglês – com LDs e VLDL) na ligação WNV C-VLDL. Os dados obtidos indicam que o pep14-23 também poderá ser um potencial inibidor das interações chave da WNV C. Os resultados obtidos neste estudo estão de acordo com os observados previamente para o DENV, mostrando que a WNV C e a DENV C interagem de uma maneira semelhante com as LDs e as VLDL, e sugerem o pep14-23 como um potencial inibidor da ligação das proteínas C de Flavivirus com sistemas lipídicos do hospedeiro.
Palavras-chave: Vírus do Nilo Ocidental; proteína da cápside; corpúsculos lipídicos; lipoproteínas;
ix
Contents
Acknowledgments ... iii
Abstract ... v
Resumo... vii
Index of Figures ... xi
Index of Tables ... xv
Abbreviations and Symbols ... xvii
I - Introduction ... 1
West-Nile virus epidemics and global impact ... 2
Spread and mode of transmission ... 2
Symptoms and diagnosis ... 4
West-Nile virus life cycle and structure ... 6
Viral life cycle ... 6
The virus structure ... 7
The capsid protein ... 8
Lipid droplets and lipoproteins in Flaviviridae infections ... 9
Lipid droplets ... 9
Plasma lipoproteins ... 11
Rationale for the study of WNV C protein interaction with lipid systems ... 13
Aims and Goals ... 16
II - Methodology ... 17
Biophysical approaches ... 18
Dynamic light scattering ... 18
Zeta Potential... 20
Atomic force microscopy-based force spectroscopy ... 21
Material & Methods ... 24
Materials ... 24
Cell culture and lipid droplets isolation ... 24
Lipid droplets purification ... 25
ζ-potential analysis of LDs surface charge ... 25
x
Functionalization of AFM tips with WNV C ... 26
AFM-based force spectroscopy measurements ... 26
DLS measurements of lipoproteins ... 27
III - WNV C interaction with Lipid Droplets ... 29
Background ... 30
Results ... 32
Assessment of WNV C protein-LDs interaction by ζ-potential analysis ... 32
Assessment of WNV C-LDs interaction by AFM-based force spectroscopy ... 34
Discussion ... 37
IV - WNV C interaction with Lipoproteins ... 39
Background ... 40
Results ... 42
Assessment of WNV C-VLDL interaction by dynamic light scattering ... 42
Assessment of WNV C-VLDL interaction by AFM-based force spectroscopy ... 44
pep14-23, a possible inhibitor of WNVC-VLDL interaction ... 46
Discussion ... 48
V - General Conclusions ... 51
Future Work ... 53
References ... 55
xi
Index of Figures
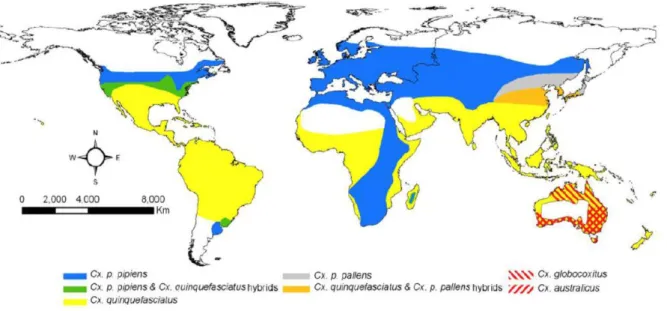
Figure 1.1 - Global distribution of Cx. pipiens complex mosquitoes. Geographic range for Cx. p.
pipiens includes both forms (pipiens and molestus). Cx. australicus and Cx. globocoxitus are restricted to Australia (Ciota and Kramer, 2013). ... 2
Figure 1.2 - European distribution of West Nile Virus. Sporadic cases of disease in horses and
humans were observed occasionally in France, Portugal, Spain, Italy, Czech Republic, Romania, and Hungary (Pauli et al., 2013). ... 4
Figure 1.3 -Flavivirus life cycle. Flavivirus enter in the host cell by receptor-mediated endocytosis.
Acidification of the endosomal vesicle conduct to the fusion of the viral and cell membranes and the genome ss(+)RNA is released into the cytoplasm. The ss(+)RNA is translated in a polyprotein that is processed by viral and host proteases, originating seven non-structural proteins and three structural proteins. Non-structural proteins promote the viral genome replication near the ER and structural proteins are involved in the viral assembly in the surface of the ER. After the virion maturation by the host protease furin, the mature virion follows the secretion pathway and subsequently is released by exocytosis (Mukhopadhyay et al., 2005). ... 7
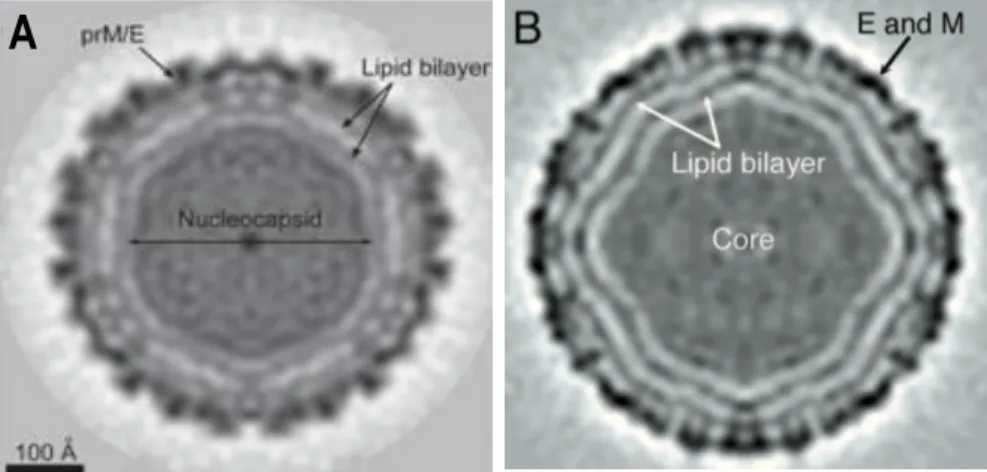
Figure 1.4 - Structures of dengue and West-Nile viruses determined by cryo-electron microscopy. (A) Cryo-EM image of a DENV particle. (B) Cryo-EM image of a WNV particle. Virion
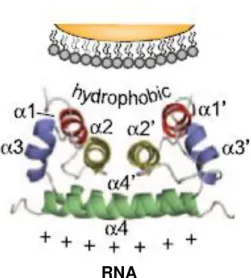
cores contain the nucleocapsid, where the viral genomic RNA is conjugated with multiple C protein copies; surrounded the nucleocapsid is a lipid bilayer derived from the host cell ER; the outer layer envelope is constituted by the E protein that is capped by the prM protein before maturation (Mukopadhyay et al., 2003; Yu et al., 2008)... 8 Figure 1.5 -Dimer structure of Flavivirus C proteins.The four α helices (α1 to α4) are indicated in
each monomer. C proteins form an α-helical homodimer with an asymmetric charge distribution. The
α2-α2’ interface, highly hydrophobic, interacts with membranes and the α4-α4’ region, mainly
positively-charged, interacts with RNA. Adapted from Samsa et al., 2009. ... 9
Figure 1.6 - LDs structure. LDs form at the ER, where the enzymes that catalyze neutral lipid
synthesis are located. LDs structure comprises a neutral lipid core surrounded by a phospholipid monolayer that harbors small amounts of free cholesterol. Multiple proteins interact with the LDs surface through different structural features. The main LDs proteins are perilipin, ADRP and TIP47 (from the PAT family) (Krahmer et al., 2009). ... 10
Figure 1.7 - Interaction of DENV C protein with LDs is required for DENV C replication. (A)
Image of confocal microscopy: the C protein is targeted to LDs. DENV infected cells accumulate the C protein around LDs. (B) Effect of C75, an inhibitor of LDs formation, on the amount of LDs in BHK cells. The number of LDs decrease in cells infected and non-infected with DENV. (C) Viral replication was also inhibited. Adapted from Samsa et al., 2009. ... 11
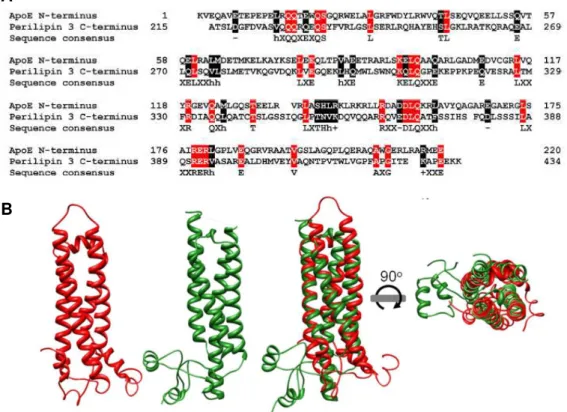
Figure 1.8 - Sequence and structural similarity between apoE N-terminus and perilipin 3 C-terminus. (A) Sequences of apoE N-terminus (first 220 residues) and perilipin 3 C-terminus (last 220
residues) show several similar regions, which could be involved in similar functions/interactions. Equal residues present in both of the aligned sequences (red); stereochemically and/or functionally identical residues (black). In the sequence consensus, “h”, “+” and “−” stand respectively for hydrophobic,
xii
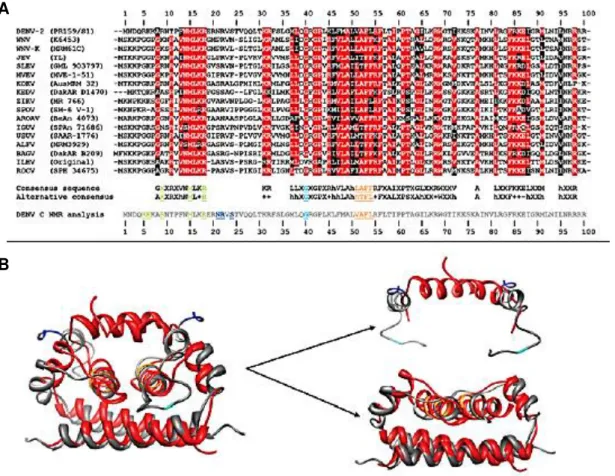
Figure 1.9 - C protein residues involved in the LD interaction are conserved among Flavivirus
spp. (A) Alignment of the DENV C protein sequence with C protein sequences from other flaviviruses,
highlighting fully conserved segments (red) and partially conserved residues (black). (B) Comparison of C protein structures of DENV (grey) and WNV-K (red). Two regions can be depicted: a conserved fold (from residues 44 to the C-terminus), and a particularly flexible region with alternative folds, containing α1 and the disordered section (residues 1–26). Adapted from Martins et al., 2012. ... 15 Figure 2.1 - Dynamic light scattering principle. (A) Particle size can be determined through the
measurement of the scattering light intensity fluctuations as a function of the time I (t). Each intensity value is correlated with the others, through autocorrelation functions (CC(t) is the correlation coefficient of the I(t) function). Larger particles generate higher correlation than smaller ones, because their motion is slower. Through the autocorrelation function and the Stokes-Einstein equation, DH can
be determined. (B) The intensity function of DH can be transformed in the particle number distribution
of DH. ... 20
Figure 2.2 - ζ-potential of a particle: distribution of counterions in the double layer surrounding a
negatively charged particle. The ζ-potential of a particle is proportional to its surface charge. The particle negatively charged in suspension attracts counterions of the solution to their surface, which forms the Stern layer. This layer of counterions is depicted as tightly bound to the charged particle surface. The electric potential between the second layer boundary of the shear plane and the solution is the ζ-potential. When an electric field, which changes the polarity with a given frequency, is applied to the solution, the particles move and the phase shift in the scattered beam is measured along time
(Uskoković, 2012). ... 21
Figure 2.3 - Components of an atomic force microscope and different tip (or sample) movements. (A) AFM technique is based on the force applied by a nanometer-sharped tip, which can
be functionalized, on the sample surface. A laser is reflected on the cantilever surface and its deflection can be measured with a photodiode detector. To scan the surface, the tip can do two different movements, (B) drag across the surface to a contact mode imaging or (C) vibrate as it moves along the surface to an intermittent contact mode imaging. In some equipments, to achieve these types of imaging, it is the sample holder that moves, while the tip remains on the same position (Whited and Park, 2014). ... 22
Figure 2.4 - AFM-based force microscopy. (A) Schematic diagram of a typical force-distance
measurement cycle. With a protein functionalized tip (a tip functionalized with WNV C in this case), performing approach and retraction cycles on the sample (LDs and plasma lipoproteins in the present study), the force and distance necessary for the unbinding event are measured. When no interactions are observed, a curve as in the top of panel B is generated; if the protein binds to the sample surface, a curve as in the bottom of panel B is generated. With the information from hundreds or thousands of these curves, the histograms (C) are generated, in order to calculate the interaction parameters. ... 23 Figure 3.1 - LDs zeta potential analysis with DENV C protein. (A) LDs zeta potential values
determined in the absence and in the presence of distinct DENV C concentrations, at different KCl concentrations. (B) Values of the maximum amplitude of variation of the LDs zeta potential (∆ζmax)
induced by the interaction with the DENV C protein and DENV C protein concentration at ∆ζmax/2 (C1/2) in TEE buffer with different potassium concentrations (Carvalho et al., 2012). ... 31 Figure 3.2 -LDs ζ-potential analysis at different WNV C concentrations. Variation of zeta potential
(∆ζ) values of LDs samples isolated with (A) TEE-KCl buffer (K+ buffer) and (B) TEE-NaCl buffer (Na+
xiii
through the fitting of experimental data with equation 10. Concentrations are presented in logarithmic scale. ... 33 Figure 3.3 - Force rupture histograms of the binding of WNV C to BHK-21 LDs in TEE buffer with (A) 100 mM KCl and (B) 10 mM KCl. Four peaks of rupture forces were observed for TEE bufferwith 100 mM KCl (1: 17.67 ± 47.81 pN; 2: 30.38 ± 0.33 pN; 3: 52.04 ± 2.49 pN; 4: 108.52 ± 2.82 pN) and two peaks for TEE buffer with 10 mM KCl (1: 20.05 ± 0.19 pN; 2: 29.59 ± 0.89 pN). ... 35 Figure 3.4 - Force rupture histogram of the binding of WNV C to BHK-21 LDs in TEE buffer with 100 mM NaCl. One peak of rupture force at 17.88 ± 0.14 pN was observed between WNV C and LDs
in TEE buffer with 100 mM NaCl. ... 36 Figure 4.1 - Lipoproteins average diameter evolution upon titration with DENV C determined by DLS. DENV C interacts with VLDL (red) and forms a conjugate with a DH ~6 nm higher than in the
absence of DENV C (*p < 0.005). LDL (blue) do not form the same type of conjugate (no statistically significant variations on DH (p > 0.05), indicating that DENV C does not interact with LDL (Faustino et
al., 2014). ... 40
Figure 4.2 - DLS analysis of lipoproteins in potassium buffer. Lipoproteins hydrodynamic
diameters (DH) were determined in the absence and in the presence of increasing WNV C
concentrations. VLDL (blue) average hydrodynamic diameter increases in the presence of WNV C,
∆DH = 4.5 ± 0.6 nm. The DH of LDL (green) in the absence and presence of WNV C do not change
significantly, only with higher concentration of WNV C (5µM) a statistically significant variation (p < 0.005) occurs. The values represented are the average of all measurements for each point (error bars represent standard error and dashed lines the average of each set of points)... 42 Figure 4.3 - DLS analysis of VLDL in sodium buffer. VLDL hydrodynamic diameters (DH) were
determined in the absence and in the presence of increasing WNV C concentrations in TEE NaCl 100 mM buffer. The DH of VLDL in the absence and presence of WNV C do not change significantly. The
values represented are the average of all measurements for each point. Error bars represent standard error and the dashed line the average of all points. ... 43 Figure 4.4 - Model for the interaction of WNV C with VLDL. The dimensions of WNV C fit well with
the observed increase of ~4.5 nm on the VLDL hydrodynamic diameter (~2.3 nm for the radius), determined by DLS. In the absence of WNV C, VLDL presented a radius of ~19 nm. In the presence of WNV C 5 µM, VLDL presented a radius of ~21.3 nm. WNV C seems to bind to the VLDL surface in a sufficient number to cause a significant increase on their size, forming a protein monolayer. This monolayer does not have to be continuous... 44 Figure 4.5 - Force rupture histograms of WNV C interactions with (A) VLDL or (B) LDL, in TEE buffer with 100 mM KCl. Two rupture force peaks were observed for VLDL (1: 20.96 ± 0.29 pN; 2:
82.88 ± 0.65 pN) and one for LDL (24.53 ± 0.09 pN). ... 45 Figure 4.6 -Force rupture histogram of WNV C interaction with VLDL in TEE buffer with 100 mM NaCl. Only one rupture force peak is observed (24.96 ± 0.08 pN). ... 46 Figure 4.7 - DLS correlograms of 50-fold diluted VLDL measured in different conditions: blue
xv
Index of Tables
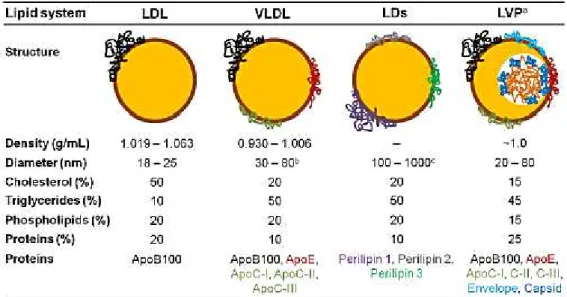
Table 1.1 -LDL, VLDL, LDs and LVP structure composition. The structure of all these systems is
similar: a core of neutral lipids is surrounded by a monolayer of polar lipids where specific proteins are embedded. Their different lipid composition give them a different density. VLDL are very similar to LDs and lipoviroparticles (LVPs) in terms of lipid composition (Faustino et al., 2014). ... 12 Table 3.1 - Rupture forces and percentage of (un)binding events obtained for interactions between DENV C and LDs obtained from HepG2 cell line, under diverse experimental conditions. The percentage of (un)binding events and the rupture force decrease with the reduction
of potassium concentration, as well as with trypsin treatments and the replacement of potassium by sodium ions (Carvalho et al., 2012). ... 30
Table 3.2 -Parameters obtained by ζ-potential analysis of LDs under different conditions. The
values of C1/2 and∆ζmax were obtained through the fitting of ζ-potential experimental data with equation 10. ... 33
xvii
Abbreviations and Symbols
ADRP – adipose differentiation-related protein or perilipin 2, an LDs protein AFM – atomic force microscopy
apo – apolipoprotein or apoprotein
apoB100, C-I, C-II, C-III, E – apolipoproteins from VLDL (apoB100 is almost the unique protein
present in LDL)
APTES – 3-aminopropyl-triethoxysilane
BBB – blood-brain barrier
BHK/ BHK-21 – baby hamster kidney cell line
BVDV – bovine viral diarrhea virus C – capsid or core protein
C1/2–protein concentration at ∆ζmax/2 (half of the protein concentration needed for saturation)
CC (t) – correlation coefficient of the I(t) function.
CD – circular dichroism spectroscopy
CNS – central nervous system
cryo-EM – cryo-electron microscopy
CSF – cerebral spinal fluid
Cx– Culex
D– diffusion coefficient
DENV – dengue virus
DH– hydrodynamic diameter
DLS – dynamic light scattering
DMEM –Dulbecco’s modified Eagle’s medium
E – envelope protein
EDTA – ethylenediamine-N,N,N’,N’-tetraacetic acid
xviii
ESI-MS – electrospray ionization mass spectrometry
ER – endoplasmic reticulum
F– force
–Henry’s function
– first order autocorrelation function
– second order autocorrelation function
HCV – hepatitis C virus
HDL – high density lipoprotein
HepG2 –human hepatocellular liver carcinoma cell line
HGV – hepatitis G virus
HPLC – high-performance liquid chromatography
I – light scattering intensity
I(DH) – light scattering intensity distribution function of DH
Ig –immunoglobulin
I(t) – light scattering intensity as a function of time
– light scattering intensity at time t
– light scattering intensity at time k – spring constant
Kv2.1 – a human K+-specific channel
LD – lipid droplet
LDH – lactate dehydrogenase
LDL – low density lipoprotein
LDLR – low-density lipoprotein receptor
LVP – lipoviroparticle
M – membrane protein, maturates from the prM through the activity of the host furin protease
xix
n(DH) – particle number distribution as a function of DHNS – nonstructural protein
p7 – an HCV viroporin
PAT family – LDs protein family composed of PLIN1, ADRP and TIP47
pep14-23 – a rationally designed peptide with sequence NMLKRARNRV, protected under a patent
application (WO 2012159187)
PLIN3 – perilipin 3
PMSF – phenylmethylsulfonyl fluoride
pre-VLDL – premature VLDL
prM – premature M protein
q– scattering vector
SE – standard error
spp. – species
ss(-)RNA – single-stranded negative-sense RNA
ss(+)RNA – single-stranded positive-sense RNA
T – absolute temperature
t – time
TEE – buffer with 20 mM Tris-HCl, 1 mM EDTA and 1 mM EGTA, pH 7.4
TIP47 – tail-interacting protein of 47 kDa or perilipin 3, an LDs protein
VLDL – very-low density lipoprotein
WNV – West-Nile virus
WNV-K – WNV serotype Kunjin
– decay rate
∆x – the length of the deflection of the cantilever in AFM-based force microscopy
∆ζ –ζ-potential variation
xx
– dielectric constant
η– dispersant viscosity
– scatter angle
κ– Boltzmann constant
– electromagnetic radiation wavelength
– electrophoretic mobility
– an instrumental constant of the deviations from ideal correlation ( = 1)
Amino acid residues and sequences are indicated using the one-letter code. Amino acid residues may also be denoted by using the following symbols: “+”, for the positively-charged residues;
1
I - Introduction
2
West-Nile virus epidemics and global impact
Spread and mode of transmission
West-Nile Virus (WNV) is a single-strand positive RNA virus of the Flaviviridae family that was first isolated in Uganda in 1937 (Kilpatrick, 2011). Since then, it became endemic across Tropical Africa, southern Asia and Northern Australia, with episodic occurrences in Europe (Kilpatrick, 2011). Despite its severity, WNV infection raised little concern until when an extremely virulent strain appeared in North America, at the turn of the millennium (Kilpatrick, 2011; Reiter, 2010; Rossi et al., 2010). This strain, originally found in 1999 in Brooklyn, New York, has quickly spread, in only 4 years having managed to invade most of North America (Kilpatrick, 2011; Rossi et al., 2010). Between 1999 and 2010, only in the USA, this resulted in over 1.8 million infected people, 12852 severe encephalitis/meningitis cases and 1308 deaths (Reiter, 2010). Mirroring the quick spread in USA, this highly virulent WNV strain can easily establish itself in Europe. Similarly to other flaviviruses (such as dengue and yellow fever viruses), the globalization of trade and travel has facilitated the spread of the original virus (Kilpatrick, 2011; Reisen, 2010; Reiter, 2010; Rossi et al., 2010). Since the virus is easily transmitted to humans via the bite of Culex spp. mosquito vectors feeding on infected birds, migratory birds constitute another major vehicle of transmission (Kilpatrick, 2011; Reisen, 2010; Reiter, 2010). In spite of the genus Culex being the key vector, 60 species of mosquito have been implicated in the transmission of WNV.In particular, mosquitoes found in North America and Europe (Figure 1.1) belong to the C. pipiens group (such as C. pipiens pipiens, C. pipiens molestus, and C. quinquefasciatus) and can drive the transmission of WNV (Gray and Webb, 2014).
Figure 1.1 - Global distribution of Cx. pipiens complex mosquitoes. Geographic range for Cx. p. pipiens
includes both forms (pipiens and molestus). Cx. australicus and Cx. globocoxitus are restricted to Australia (Ciota
3
As reviewed elsewhere (Kilpatrick, 2011; Gray and Webb, 2014), Culex spp. mosquitoes are predominantly ornithophilic species and are considered efficient enzootic vectors, bird-to-mosquito-to-bird transmission. However, as the mosquitoes are closely associated with urban environments there is an increased risk to act as epizootic vectors (bird-to-mosquito-to-human transmission). Members of the C. pipiens complex occur in both North American and Europe, although in North America, C. tarsalis is considered one of the major vectors of WNV, while in some regions of Europe C. modestus has been implicated as a locally important vector.Endemic mosquitoes may play a locally significant role in enzootic and in epidemic transmission of WNV. The variations in risk may be driven by differences in the availability of suitable mosquito habitats, relative abundance of Culex spp. mosquitoes and their host feeding preferences (Gray and Webb, 2014). The mosquito vectors are abundantly found in Europe and the number of bird species that can host the virus is considerable, given the surprisingly large range of taxa that WNV infects, including common European birds such as corvids, robins, chickadees and thrushes, among others (Kilpatrick, 2011).Accordingly, a virulent strain can easily spread across Europe (Reisen, 2010; Bagnarelli et al., 2011; Barros et al., 2011). In fact, in the summer of 2011, 89 laboratory-confirmed human cases of WNV infection have been reported in the European Union (EU) (although, fortunately, not the most virulent strain): 66 cases in Greece, 13 in Italy and 10 in Romania. Another 149 cases occurred in neighboring countries with intense commercial relations with the EU (Bagnarelli et al., 2011). In 2012, there was resurgence in human cases in North America, with 5,674 patients reported with clinical illness in the USA and 428 clinical cases notified in Canada. North American WNV activity levels remained higher than historical averages in 2013, with 2,318 human disease cases reported in the US and 108 cases in Canada at the end of the transmission season. In 2012, there was a peak of 937 WNV cases in Europe and neighbor countries and in 2013, 783 WNV human cases, including 86 in Greece and 302 in Serbia, were reported (Gray and Webb, 2014). Figure 1.2 shows the distribution of WNV in Europe.
4
other extracellular factors, as well in the integrity of the BBB. In fact, evidences show that WNV replication in astrocytes influences the results of viral infections of the CNS (Hussmann et al., 2014). Therefore, blocking the infection at visceral stage is critical for preventing its evolution to the life-threatening neurological stage (Diamond, 2009; Kimura et al., 2010; Lim et al., 2011b; Rossi et al., 2010).Figure 1.2 - European distribution of West Nile Virus. Sporadic cases of disease in horses and humans were
observed occasionally in France, Portugal, Spain, Italy, Czech Republic, Romania, and Hungary (Pauli et al.,
2013).
Symptoms and diagnosis
5
always follows through to the final neuro-invasive stage (Diamond, 2009; Kimura et al., 2010; Lim et al., 2011b; Rossi et al., 2010). It is estimated that 80% of WNV infections are mostly asymptomatic. Thus, only a small portion develops the symptoms of the systemic febrile illness known as West-Nile fever that gave the name to the virus. Regarding the neurological manifestations, only 1 % of the cases of WNV infection evolve to a neurologic illness, in which the virus infects the nervous system (Sejvar, 2014). There are three recognized types of neuro-invasive disease: aseptic or West-Nile meningitis, which involves infection of the meninges; West-Nile encephalitis, in which infection of the brain parenchyma occurs; and, finally, the acute poliomyelitis-like syndrome known as West-Nile poliomyelitis, that results in an acute flaccid limb weakness as the result of a viral infection of the anterior horn cells of the spinal cord (Campbell et al., 2002; Granwehr et al., 2004). The severity of WNV infection is highly dependent on the age of the infected person. Roughly, as a rule of thumb, for each decade of life it becomes 1.5 times more likely that the disease develops into the neuro-invasive stage (O’Leary et al., 2004). However, children also can develop the neuro-invasive version of the disease, in most cases due to an infection of the meninges (Civen et al., 2006; Lindsey et al., 2009). However, it is important to understand that sometimes the clinical manifestations can overlap and there is not a well-differentiated clinical picture. As such, the diagnosis of the clinical syndrome in persons with an overlap of manifestations of WNV is sometimes difficult. The diagnosis is even more complicated when other manifestations associated with WNV infection occur (Sejvar, 2014). It is possible that a large number of WNV infections go unreported, since diagnosis based on the clinical manifestations can therefore be somewhat difficult.6
West-Nile virus life cycle and structure
Viral life cycle
7
Figure 1.3 -Flavivirus life cycle.Flavivirus enter in the host cell by receptor-mediated endocytosis. Acidificationof the endosomal vesicle conduct to the fusion of the viral and cell membranes and the genome ss(+)RNA is released into the cytoplasm. The ss(+)RNA is translated in a polyprotein that is processed by viral and host proteases, originating seven non-structural proteins and three structural proteins. Non-structural proteins promote the viral genome replication near the ER and structural proteins are involved in the viral assembly in the surface of the ER. After the virion maturation by the host protease furin, the mature virion follows the secretion pathway and subsequently is released by exocytosis (Mukhopadhyay et al., 2005).
The virus structure
Members of Flavivirus genus, Flaviviridae family, to which WNV belongs, are structurally similar, with homologous proteins sharing highly conserved regions. In Figure 1.4, dengue virus (DENV) and WNV structures are shown, which are very similar. Flaviviruses such as WNV are icosahedral enveloped viruses composed of a lipid bilayer surrounding a nucleocapsid
8
Figure 1.4 - Structures of dengue and West-Nile viruses determined by cryo-electron microscopy. (A)Cryo-EM image of a DENV particle. (B) Cryo-EM image of a WNV particle. Virion cores contain the nucleocapsid, where the viral genomic RNA is conjugated with multiple C protein copies; surrounded the nucleocapsid is a lipid bilayer derived from the host cell ER; the outer layer envelope is constituted by the E protein that is capped by the prM protein before maturation (Mukopadhyay et al., 2003; Yu et al., 2008).
The capsid protein
The Flavivirus capsid proteins are also highly multifunctional with other physiological roles besides being part of the core mature virion structure. WNV C can be localized in the cytoplasm and nuclei. The localization in the nuclei is dependent on the interaction with importins and a protein kinase C-mediated phosphorylation of arthropod-borne flaviviruses C proteins (Bhuvanakantham et al., 2010). The function of the C protein in the nucleus is not well understood, since it has been shown that nuclear phase is important for efficient virus replication (Bhuvanakantham et al., 2009), but it is known that ss(+)RNA replication occurs via cellular components in the cytoplasm (Bhuvanakantham and Ng, 2013). One of the most important processes of the virus life cycle, the virus assembly, is mediated by the C protein, ensuring the specific encapsidation of the WNV viral genome. In fact, this protein is involved in many other processes, as it acts as nucleic acid chaperone (Ivanyi-Nagy et al., 2008) and interacts with a variety of cellular proteins, modulating transcription, cellular metabolism, apoptosis and immune response (McLauchlan, 2000; Heaton et al., 2010; Ivanyi-Nagy et al., 2008; Netsawang et al., 2010).
The C proteins have roughly 100 amino acid residues (DENV C, for example, has 100 a.a., while WNV C has 105 residues). The C protein in solution forms a homodimer rich in α-helices, with each monomer composed by four α-helices (α1 –α4) connected by short loops (Dokland et al., 2004; Jones et al., 2003; Ma et al., 2004). The WNV C protein has an asymmetric charge distribution, being a very positively charged protein due to the presence of only 3 negatively-charged residues and 26 arginine and lysine residues. One of the faces of the dimer is constituted essentially by
positively-charged residues (α4 helices of each monomer), while the other face of the dimer is formed by non -charged and by non-polar residues (α1 and α2 helices of each monomer). It was proposed that the α4
-α4’ region isinvolved in the interaction with RNA and the α2-α2’ region binds to molecular components
of the viral membrane (Figure 1.5) (Ma et al., 2004). The first twenty residues of WNV C, as well the first twenty residues C protein of other Flavivirus, such as DENV C, are intrinsically disordered. The
9
flexibility conferred by their intrinsically disordered regions is expected to facilitate the functions in which flaviviruses C proteins are involved (Ivanyi-Nagy and Darlix, 2010). Importantly, as discusses in the next section, in several closely related members of the Flaviviridae family, such as DENV and hepatitis C viruses (HCV), the interaction of the homologous C proteins with intracellular lipid droplets (LDs) and with blood plasma very-low density lipoproteins (VLDL) is crucial for successful viral replication (Carvalho et al., 2012; Faustino et al., 2014; Martins et al., 2012; Mukhopadhyay et al., 2005; Samsa et al., 2009).Figure 1.5 - Dimer structure of Flavivirus C proteins.The four α helices (α1 to α4) are indicated in each
monomer. C proteins form an α-helical homodimer with an asymmetric charge distribution. The α2-α2’ interface,
highly hydrophobic, interacts with membranes and the α4-α4’ region, mainly positively-charged, interacts with RNA. Adapted from Samsa et al., 2009.
Lipid droplets and lipoproteins in Flaviviridae infections
Lipid droplets
Lipid droplets (LDs) are intracellular organelles that have also been referred as lipid bodies, oil bodies, adiposomes, oil droplets and fact bodies, specialize in the storage of neutral lipids (Ding et al., 2013). LDs are originated from the ER and are composed by a hydrophobic core of neutral lipid, mainly triacylglycerols and cholesteryl esters, surrounded by a monolayer of phospholipids and cholesterol, with a variety of proteins in the surface (Figure 1.6) (Lin et al., 2014). The diameter of LDs varies from 50 nm to 200 μm depending on cell type, but they always tend to have a globular shape. LDs provide the main cellular reservoir of lipids for energy storage (Krahmer et al., 2009). In addition to storing energy, lipid droplets provide reservoirs of lipids (such as sterols, fatty acids and phospholipids) for hormone synthesis and membrane formation (Thiam et al., 2013), and protect cells from the lipotoxic effects of unesterified lipids (Krahmer et al., 2009). The surface of LDs controls the accessibility of lipases to the stored triacylglycerols, since their utilization requires enzymatic breakdown by lipases (Lin et al., 2014). In the past decade, several studies have been developed to understand LDs biogenesis and functions. For that, several models systems, including bacteria, yeast,
10
green algae, Caenorhabditis elegans, Drosophila, plants and several types of mammalian cells and tissues have been used. The data collected show that LDs are very complex organelles and may be involved in lipid metabolism, membrane biosynthesis, membrane trafficking and signal transduction (Ding et al., 2013). Given their diverse functions, LDs are important organelles for cell homeostasis. With an important role in lipid storage, LDs also figure prominently in several pathologies due to lipid accumulation, such as obesity, fatty liver, type 2 diabetes and atherosclerosis (Krahmer et al., 2013). In addition to phospholipids, the surface of LDs is decorated with several proteins (Krahmer et al., 2009; Thiam et al., 2013). Since the identification of perilipins as the major group of LDs surface proteins (with key roles in the regulation of lipid metabolism), proteomic and cell biology has revealed hundreds of LDs proteins in different cell types (Thiam et al., 2013). The main LDs proteins are from the PAT family: perilipin, adipose differentiation-related protein (ADRP) and tail-interacting protein of 47 kDa (TIP47), recently collectively renamed as perilipin 1, perilipin 2 and perilipin 3, respectively (Krahmer et al., 2009).Figure 1.6 - LDs structure. LDs form at the ER, where the enzymes that catalyze neutral lipid synthesis are
located. LDs structure comprises a neutral lipid core surrounded by a phospholipid monolayer that harbors small amounts of free cholesterol. Multiple proteins interact with the LDs surface through different structural features. The main LDs proteins are perilipin, ADRP and TIP47 (from the PAT family) (Krahmer et al., 2009).
11
important intracellular pathogens, such as DENV (Samsa et al., 2009) and HCV (Barba et al., 1997) also increase the formation of LDs in the host cells. It has been shown that TIP47 regulates HCV RNA replication through the interaction with a viral protein (Vogt et al., 2013). Viruses of the Flaviviridae family cause infections with liver steatosis, where it is notorious an increase in size and number of LDs in hepatocytes (Miller and Krijnse-Locker, 2008). Moreover, the C proteins of DENV and HCV, involved in viral assembly, associate with LDs during infection, a process essential for viral replication (Figure 1.7) (Assunção-Miranda et al., 2010; Samsa et al., 2009).Several methods for isolating LDs have been established. These methods have been developed for proteomic and functional studies with LDs isolated from different species. The increase on the purity of LDs sample is one of the goals of the improving of these techniques, allowing the isolation of a reproducible amount of high-quality LDs (Ding et al., 2013).
Figure 1.7 - Interaction of DENV C protein with LDs is required for DENV C replication. (A) Image of
confocal microscopy: the C protein is targeted to LDs. DENV infected cells accumulate the C protein around LDs. (B) Effect of C75, an inhibitor of LDs formation, on the amount of LDs in BHK cells. The number of LDs decrease in cells infected and non-infected with DENV. (C) Viral replication was also inhibited. Adapted from Samsa et al.,
2009.
Plasma lipoproteins
Blood plasma lipoproteins have also an important role in the life cycle of some Flaviviridae (Bartenschlager et al., 2011; Survana and Rane, 2009). During Flavivirus infection, the composition and concentration of plasma lipoproteins are affected (Survana and Rane, 2009; van Grop et al., 2002). Lipoproteins circulate in the bloodstream in suspension in the blood plasma, and are essentially classified in four major types, according to their density and function (ordered by decreasing average size and increasing density): chylomicra, very low density lipoproteins (VLDL), low density lipoproteins (LDL) and high density lipoproteins (HDL) (Cushley and Okon, 2002; Nelson and Cox, 2005).
Lipoproteins have key physiological functions, mainly on lipid homeostasis (Nelson and Cox, 2005). VLDL are mainly formed in the liver and distribute the lipids from there to all over the body, whereas LDs are responsible for the lipid homeostasis inside the cell. VLDL are quite similar to LDs in terms of structure and lipid composition, and both are derived from ER membrane. VLDL formation occurs on the luminal side whereas LDs are formed on the cytosolic side of the ER membrane. The main differences between these structures can be explained by the different formation pathways (Cushley and Okon, 2002; Nelson and Cox, 2005; Walther and Farese, 2009). LDL are generated from VLDL through delipidation, deproteinization and enzymatic metabolization in the bloodstream,
12
being therefore increasingly different from LDs (Cushley and Okon, 2002; Nelson and Cox, 2005). One of the major differences between LDL and VLDL is their protein composition (Table 1.1).Table 1.1 - LDL, VLDL, LDs and LVP structure composition. The structure of all these systems is similar: a
core of neutral lipids is surrounded by a monolayer of polar lipids where specific proteins are embedded. Their different lipid composition give them a different density. VLDL are very similar to LDs and lipoviroparticles
(LVPs) in terms of lipid composition (Faustino et al., 2014).
a LVP are formed during HCV infection and they may be a common feature among flaviviruses.
b Premature VLDL (pre-VLDL) and VLDL in pathological conditions can exceed 200 nm in diameter.
c LDs larger than 1 μm usually occur in adipocytes, in fatty acid induced cells or pathogen-infected cells.
13
Recently, it was reported that DENV C can interact specifically with VLDL, eventually forming lipoviroparticles (Faustino et al., 2014).Figure 1.8 -Sequence and structural similarity between apoE N-terminus and perilipin 3 C-terminus. (A)
Sequences of apoE N-terminus (first 220 residues) and perilipin 3 C-terminus (last 220 residues) show several similar regions, which could be involved in similar functions/interactions. Equal residues present in both of the aligned sequences (red); stereochemically and/or functionally identical residues (black). In the sequence
consensus, “h”, “+” and “−” stand respectively for hydrophobic, positively-charged and negatively-charged residues at the same aligned position. (B) The structures of apoE N-terminus (PDB ID: 2KC3 [red]) and perilipin 3 C-terminus (PDB ID: 1SZI [green]) superimpose in space through its common four-helix-bundle motif. Adapted from Faustino et al., 2014.
Rationale for the study of WNV C protein interaction with lipid systems
Understanding the crucial steps of Flavivirus life cycle, such as the mode of interaction of the virus with the host cells components, in particular with lipid systems, can contribute to the development of effective drugs capable of inhibiting viral replication. It was already noted that in several RNA virus infections, such as those caused by DENV and HCV, the lipid metabolism is affected (Barba et al., 1997). When Flavivirus infect a host cell their genome replicates in association with cellular membranes. In fact, it was shown that for the dengue and hepatitis C viruses, interaction of the capsid protein with host intracellular lipid droplets is crucial for viral replication (Counihan et al., 2011; Samsa et al., 2009). Recently, the host laboratory identified the DENV C amino acid residues responsible for its interaction with LDs (Martins et al., 2012) and showed also that specific protein components of LDs surface are involved in the interaction (Carvalho et al., 2012). In addition, it was
A
14
demonstrated that DENV C selectively interacts with VLDL, which may lead to the formation of LVPs (Faustino et al., 2014). With this information the host laboratory successfully designed pep14-23 (Martins et al., 2012), a peptide inhibitor of dengue virus capsid protein interaction with LDs and VLDL (Faustino et al., 2014; Martins et al., 2012). The inhibitor is based on a segment of DENV C that is highly conserved on WNV C (Martins et al., 2012). In fact, the sequence and the structure of C proteins seem to be conserved among Flavivirus (Figure 1.9) (Martins et al., 2012).It is known that viruses have evolved several strategies to manipulate cellular functions during infection (Bartenschlager et al., 2011; Samsa et al., 2009). Viral proteins have different activities and properties, associated to their high structural flexibility. This high structural flexibility is in part due to the presence of intrinsically disordered regions, which allow the interconverting of structures with a lack of a defined folding. Usually, disordered regions are involved in functions that need structural flexibility, such as recognition, regulation, signaling and interaction with nucleic acids and proteins. As mentioned before, the C proteins of Flavivirus form symmetric homodimers in solution and can interact with RNA and lipid systems. In fact, the segment containing the first 20 amino acid residues in C protein was found to be disordered in solution, in both WNV and DENV C proteins. C proteins structure and surface charge distribution enable capsid assembly through the interaction with lipid
membranes by the central hydrophobic region in the α2-α2’ interface and can interact with the viral
15
Figure 1.9 - C protein residues involved in the LD interaction are conserved among Flavivirus spp. (A)Alignment of the DENV C protein sequence with C protein sequences from other flaviviruses, highlighting fully conserved segments (red) and partially conserved residues (black). (B) Comparison of C protein structures of DENV (grey) and WNV-K (red). Two regions can be depicted: a conserved fold (from residues 44 to the C-terminus), and a particularly flexible region with alternative folds, containing α1 and the disordered section (residues 1–26). Adapted from Martins et al., 2012.
A
16
Aims and Goals
The studies developed in the last years in the field of Flaviviridae conducted to significant advances in the understanding of the life cycle of these viruses, in particular DENV. These findings resulted in the development of strategies to inhibit the crucial interaction of key viral proteins with the components of host cells, more specifically, in the potential use of pep14-23 or its derivatives to inhibit the interaction of DENV C with LDs and VLDL. However, this strategy may have wider applicability. The capsid proteins of other flaviviruses may interact with lipid systems in the same way that has been described for DENV C. Here the aim is to understand if the interaction of another Flavivirus C protein, WNV C, with host lipid systems also occurs. If so, pep14-23 may also function as an effective inhibitor of this key step of the flaviviruses life cycle.
17
II - Methodology
18
Biophysical techniques
Dynamic light scattering
Dynamic light scattering (DLS) is the technique most commonly used to determine the size distribution profile of particles in suspension (Domingues et al., 2008). However, it is important to consider that different factors may affect the particle size distribution measured by DLS, such as the concentration of the suspension and composition of solvents (Yang et al., 2014). Another important point is aggregation. It may occur in the sample solution or suspension during its preparation, or during measurements. In these cases, DLS may give inaccurate and unreliable results on the size of individual particles, as smaller particles can form agglomerates which can be identified or counted as one large particle. Aggregation usually occurs due to an imbalance of repulsive electrostatic forces and attractive van der Waals forces (Hinterwirth et al., 2013; Yang et al., 2014). Other methods are used to size determination, such as microscope techniques, size-exclusion chromatography, differential mobility analysis and field-flow fractionation. All these methods have its specific shortcomings (Hinterwirth et al., 2013). DLS is able to give accurate values for particle size ranging from 1 nm to 1 µm, depending on sample, equipment and other experimental conditions (Domingues et al., 2008).
DLS is used to measure particle hydrodynamic diameter and size distribution of molecules or supra-molecular aggregates based on the light scattering intensity fluctuation on a small volume in a time-scale of microsecond, due to the Brownian motion of the particles (Figure 2.1) (Domingues et al., 2008). Brownian motion is the random zigzag motion caused by collisions with solvent molecules, which are themselve randomly moving owing to their thermal energy. Hence, the velocity of the particles in suspension is proportional to the particle mass (product of the size and density) (Uskoković, 2012). Size determinations can be performed through the measurement of the scattering light intensity fluctuations as a function of the time (I(t)). The diffusion coefficient is measure employing an autocorrelation function ( ) (Santos and Castanho, 1996):
(1)
where are a point of the function at time t and another after a short time period . This is the multiplication of the number of photons that arrives the detector at two successive time intervals and this calculation is repeated hundreds of thousands of times.
Considering the normalized scattered electric autocorrelation function , it is possible determine the diffusion coefficient (D) of the particle from the decay rate ( ) and the scattering vector (q) of the intensity function with the relation (Berne and Pecora, 1990):
19
with:(3)
( ) (4)
where is the refractive index of the scattering material, the wavelength of the scattered light and its angle. It is important keep in mind that the diffusion coefficient (D) depends not only on the size of the particle, but also on other factors, such as the topology and chemical ordering of the particle surface, as well as the ionic strength and the ionic composition of the medium (Uskoković, 2012).
is related with the first order autocorrelation function ( ) via the Siegert relation (Santos and Castanho, 1996):
(5)
where is an instrumental constant of the deviations from ideal correlation ( = 1).
To calculate the correlation kinetics, which depends on the intensity-weighted diffusion coefficient (D), different methods can be employed, such as CONTIN or Cumulants. CONTIN is a numerical method which use a multiexponential correlogram fit to assess D distribution in solution. Cumulants uses a monoexponencial correlogram fit to obtain an average D. With the Stokes-Einstein equation, it is possible determine the hydrodynamic diameter ( ) from D value (Berne and Pecora, 1990):
(6)
where η is the dispersant viscosity, κ the Boltzmann constant and T the absolute temperature. It should be noted that the exponentially decaying curve goes to zero at time when the particle in movement exceeds the wavelength of the laser light (Uskoković, 2012).
The scattering intensity distribution function of ( ) is obtained, and can be converted to
, the particle number distribution function of through the Mie theory. The scattering intensity of a particle is proportional to the sixth power of its DH(Rayleigh’s approximation); thus, the conversion
can be done by the following transformation:
(7)
20
Figure 2.1 - Dynamic light scattering principle. (A)Particlesize can be determined through the measurement of the scattering light intensity fluctuations as a function of the time I (t). Each intensity value is correlated with theothers, through autocorrelation functions (CC(t) is the correlation coefficient of the I(t) function). Larger particles
generate higher correlation than smaller ones, because their motion is slower. Through the autocorrelation function and the Stokes-Einstein equation, DH can be determined. (B) The intensity function of DH can be
transformed in the particle number distribution of DH.
Zeta Potential
Zeta potential (ζ-potential) measurements are based on the concept that charged particles suspended in a solution attract to their surface ions with opposite charge, to which they can be strongly bound. These surface-bound ions form a layer, the Stern layer (Uskoković, 2012). Beyond the Stern layer another layer is formed, where ions diffuse more freely. When the particle moves in the solution, the ions strongly attached to their surface move with it whereas the ions in the diffuse boundary do not move with the particle. The potential that exists at this boundary is defined as the ζ -potential (Figure 2.2) (Domingues et al., 2008). However, the exact location of the shear plane is an unknown feature of the electric double layer. ζ-potential is normally considered a bit lower than the potential at the boundary of the Stern layer. In fact, the two potentials can be considered identical without produce a significant error. Only at high surfaces potentials and high electrolyte concentrations the difference between the two potentials can be pronounced (Uskoković, 2012).
The ζ-potential is calculated through the electrophoretic mobility of the particles in solution, on an electric field, to the electrode of opposite charge (Kirby and Hasselbrink, 2004). The viscous forces oppose the movement of the particles in suspension until reaching the equilibrium, and therefore a constant velocity. The electrophoretic mobility can be calculated by laser Doppler velocimetry in Zeta-sizer devices. In this case, the particle velocity is related to the frequency measured by intensity fluctuation on the scattered light, or based on phase analysis light scattering. The first method has the disadvantage that the sensitivity of the Doppler Effect to the low mobility of large particles is very low, hindering the calculation of electrophoretic mobility. Other problem it is the measure of the mean square displacement of the particles instead of the mean displacement. Calculating the electrophoretic mobility basing on phase analysis light scattering is more accurate. With this technique it is possible measure differences in phase between the reference beam and the sample-scattered shifted beam
21
(phase shift is related to the position of the particle) (Domingues et al., 2008). The mean phase change with time yields the electrophoretic motion (Miller et al., 1991).Figure 2.2 - ζ-potential of a particle: distribution of counterions in the double layer surrounding a negatively
charged particle. The ζ-potential of a particle is proportional to its surface charge. The particle negatively charged in suspension attracts counterions of the solution to their surface, which forms the Stern layer. This layer of counterions is depicted as tightly bound to the charged particle surface. The electric potential between the second layer boundary of the shear plane and the solution is the ζ-potential. When an electric field, which changes the polarity with a given frequency, is applied to the solution, the particles move and the phase shift in the scattered beam is measured along time (Uskoković, 2012).
The ζ-potential of the particles can be calculated using the Henry’s relation:
(8)
where ζ is the ζ-potential, the electrophoretic mobility, the viscosity of the solvent, its dielectric constant and is the Henry’s function. When the particles are suspended in aqueous solutions
with high ionic strength, the Henry’s function is considered to be 1.5 (Smoluchowski’s approximation); otherwise, if non-aqueous solutions are used, the value of this function is assumed to be 1 (Huckel approximation). The ζ-potential may be determined accurately for measurements with samples with particle sizes between 5 nm and 10 µm (Domingues et al., 2008).
.
Atomic force microscopy-based force spectroscopy
22
2014). Typically, AFM is used for the construction of surface images. A tip attached to a flexible cantilever scans or taps the surface, while a laser beam reflected on the back of the cantilever is detected with a position-sensitive photodiode (Figure 2.3). Initially, the laser is pointed at the center of the photodiode, usually composed for four quadrants. When the sample is scanned, any small deflection on the cantilever will change the position of the reflected laser (lateral and vertical deflections of the tip are distinguishable). These deflections of the tip are processed by the electronic system and the sample surface topology is determined. AFM is a powerful tool, since it is able to measure a large range of orders of magnitude (Vahabi et al., 2013). Furthermore, it has the capacity of imaging in air and in liquid, as well as in non-conductive and conductive surfaces. However, AFM can do more than only allowing the construction of images of surfaces. It can take advantage of its piconewton sensitivity, becoming a powerful tool for the study of molecular interactions, quantifying interaction between the tip and a specific spot in the sample. This approach is termed force spectroscopy (AFM-based force spectroscopy, to distinguish from other related approaches, using for instance optical or magnetic tweezers) (Carvalho and Santos, 2012; Vahabi et al, 2013; Whited and Park, 2014).Figure 2.3 -Components of an atomic force microscope and different tip (or sample) movements. (A) AFM technique is based on the force applied by a nanometer-sharped tip, which can be functionalized, on the sample surface. A laser is reflected on the cantilever surface and its deflection can be measured with a photodiode detector. To scan the surface, the tip can do two different movements, (B) drag across the surface to a contact mode imaging or (C) vibrate as it moves along the surface to an intermittent contact mode imaging. In some equipments, to achieve these types of imaging, it is the sample holder that moves, while the tip remains on the same position (Whited and Park, 2014).
AFM-based force spectroscopy is a technique, that with their piconewton resolution, allows the measurement of inter- and intramolecular interaction forces required to separate the tip from the sample, enabling the detection of specific interaction forces at the single molecule level. For this type of studies the tips are functionalized with a probe molecule to recognize a specific target on the sample surface (Carvalho and Santos, 2012; Whited and Park, 2014). In AFM-based force spectroscopy measurements at the single-molecule level, normally the tip is brought into contact with the sample surface and retracted. For this, the cantilever moves first toward the surface and then in the opposite direction (in the z axis). The cantilever deflection of the vertical displacement of the piezoscanner can be recorded as a cantilever deflection versus scanner displacement curve. Briefly, the tip approaches the sample and a curve is generated with no variation in the force. When the tip
A
B
23
touches the sample, the force applied increases, leading to the deflection of the cantilever. Then, the tip retracts and a curve with the same appearance of the approach is generated. If a molecule attached to the tip, or simply the tip, adheres to the the sample, a binding event occurs and the retraction curve presents a different shape (Figure 2.4). This information can be converted into a force-distance curve using the Hookes’s law of elasticity:(9)
where F is the force, k the spring constant of the cantilever and ∆x the length of the deflection of the cantilever. The tip, sample and medium composition influence the curve obtained. The covalent coupling of biomolecules to the AFM tip is other point to take into account for the force measurement. It is essential that the molecules can be removed from the surface during the retraction curve, but not from the tip (Carvalho and Santos, 2012).
In the present study, AFM-based force spectroscopy was performed to measure interactions of WNV C protein (covalently attached to the AFM tip) with LDs and lipoproteins (lightly adsorbed to a mica surface). The use of glutaraldehyde as a flexible cross-linker to couple the WNV C to the tip allows that the protein diffuses freely and its binding sites are available to form bonds with its ligands (Willemsen et al., 2000). By tapping with this functionalized tip on the surface of the deposited sample, the detection of binding events and the probing of the force necessary to break the interaction can be determined at the single-molecule level. The number of proteins bound to the functionalized tip is unknown; however, it is not crucial for force measurements, since it is possible to identify single-molecules binding from the shape of the retraction curve. To have data statistically validated, it is necessary the acquisition of hundreds or thousands of curves, and the use of more than one AFM tip for each condition. With this information, histograms of distribution of rupture forces or distances can be generated and the frequency of (un)binding events calculated, from the number of curves with (un)binding events over the total number of curves obtained.
Figure 2.4 - AFM-based force microscopy. (A) Schematic diagram of a typical force-distance measurement
cycle. With a protein functionalized tip (a tip functionalized with WNV C in this case), performing approach and retraction cycles on the sample (LDs and plasma lipoproteins in the present study), the force and distance necessary for the unbinding event are measured. When no interactions are observed, a curve as in the top of panel B is generated; if the protein binds to the sample surface, a curve as in the bottom of panel B is generated. With the information from hundreds or thousands of these curves, the histograms (C) are generated, in order to calculate the interaction parameters.