Todos os direitos reservados.
É proibida a reprodução parcial ou integral do conteúdo
deste documento por qualquer meio de distribuição, digital ou
impresso, sem a expressa autorização do
REAP ou de seu autor.
Access to Long-Term Credit and Productivity of
Small and Medium Firms: A Causal Evidence
Tiago Cavalcanti
Paulo Henrique Vaz
Access to Long-Term Credit and Productivity of Small and Medium
Firms: A Causal Evidence
Tiago Cavalcanti
Paulo Henrique Vaz
Tiago Cavalcanti
University of Cambridge and
Sao Paulo School of Economics - FGV
tvdvc2@cam.ac.uk
Paulo Henrique Vaz
Universidade Federal de Pernambuco - UFPE
Access to Long-Term Credit and Productivity of
Small and Medium Firms: A Causal Evidence
∗
Tiago Cavalcanti
University of Cambridge and Sao Paulo School of Economics - FGV
t✈❞✈❝✷❅❝❛♠✳❛❝✳✉❦
Paulo Henrique Vaz
Universidade Federal de Pernambuco - UFPE
♣❛✉❧♦✳✈❛③❅✉❢♣❡✳❜r
Abstract
This letter assesses the impact of a variation in access to a targeted loan pro-gram from Brazil’s development bank on investment and productivity. Results suggest that eligible firms increased their relative investment rate and produc-tivity, but results are robust only for permanent rather than temporary improve-ments in access to credit.
KEYWORDS: Credit subsidies; productivity; small and medium enterprises.
JEL:O1; H2; L6.
1
Introduction
This paper uses a variation in access to a targeted loan program from the Brazilian Development Bank (BNDES) to assess the causal effect of better credit conditions on investment and productivity of Brazilian manufacturing firms. BNDES is the main financing institution for productive investment in the country and it offers subsidized interest rate for long-term investments. The estimated causal effects point to positive shifts in the trend for investment rates and productivity indexes on average, however, after considering firm and year fixed effects, it remains statistically significant only for the permanent changes on credit conditions.
Our empirical strategy resembles that ofBanerjee and Duflo[2014] in evaluating whether or not firms are credit constrained in India, but the question studied in this paper is distinct to theirs. The similarity is on the use of an exogenous variation in access to a lending program as the identification strategy. Their paper “estimates the impact of short term capital loans, not that of long term investment credit” [Banerjee
∗ We are grateful to the editor, an anonymous referee, Werner Baer, Francisco Buera, Bruno
and Duflo, 2014, p. 575], whereas the BNDES credit policies were designed to meet long term investment needs.1 As a consequence, they focused on the policy effect on firms’ short term outcomes (credit limit, interest rate, sales, among other variables) but not on investment and productivity, which constitute the variables of interest of this paper.
2
The BNDES Credit Intervention
BNDES is the main financing agent for development in Brazil. Its lending portfolio is larger than the World Bank and has been used primarily to finance the expansion of industry and infrastructure. The Bank is responsible for more than 70 percent of long term credit in the country.
BNDES has adopted policies targeting firms considered to be more financially constrained, namely low-revenue firms. Interest rates as well as collateral constraints were designed to better support this group. The Bank offers subsidized interest rate for long-term investments but benefits were defined as a function of firms gross oper-ating revenue. BNDES offers several credit lines and products. Among those target-ing small and medium size firms are: FINAME,BNDES automáticoand BNDES card. The first two are designed to finance physical capital accumulation or investments in intangible capital meant to increase productivity, and together they compose the largest outlay. Nonetheless, credit conditions are size-dependent and classification changed over time, which motivates out identification strategy. BNDES card facili-tates acquisition of inputs, but credit conditions are the same for all firms.2
The level of the subsidy on borrowing rates depends on the firm size in terms of gross operating revenue but firms’ classification changed over time. From 1997 to 2002, all firms with revenues between R$6 millions and R$35 millions were classified as medium firms and they faced the same credit conditions offered by BNDES. In 2002, those with gross operating revenue within R$6 and R$10.5 millions started to be treated as small firms, with the possibility of applying for better credit conditions, while firms with revenues above R$10.5 millions were still treated as medium firms. For instance, under FINAME and BNDES Automático, small firms paid at least 1.5 percentage point less in interest rate per year than medium firms and the interest rate differential could reach 3 percentage points depending on the sector and location of the firm.3 Small firms had also favourable loan conditions in terms of smaller
collat-1Antunes et al.[2015] andBuera et al.[2013] study such a policy in a macro-development
quantita-tive environment.
2Despite recent expansion of theBNDES card, particularly after 2009, it does not reach 10% of
dis-bursements made by the other two products.
3BNDES resources come mainly from workers’ contributions and loans from the Brazilian Treasury
2002-eral requirements and larger grace periods. A new reform took place in 2004, when the two groups, small and medium-size firms, started facing the same credit condi-tions. The causal effect is estimated considering new-small firms (revenue between R$6Mi and R$10Mi) as treated and two different control groups: the always-small firms (revenue below R$6Mi), unaffected by the reclassification, and always-medium firms (revenue above R$10Mi), affected only two years latter. The comparison with the former can be interpreted as estimating the effect of a permanent change in credit conditions, while the comparison with the latter for the effect of two years of better credit conditions. For this reason, when estimating the causal effect for the tempo-rary change in credit conditions, we will focus the comparison of new-small firms solely with medium-size firms, according to the first classification, operating within the 2002-04 period and track them back and forth in time. For the permanent shock, the same is done but with the control group composed by always-small firms, the always treated group.
3
Empirical Strategy
3.1
Data
Firm level data were obtained from a confidential survey constructed by the Brazilian Institute of Statistics (IBGE),4called the Annual Industrial Survey (PIA), which mon-itors the performance of Brazilian firms in the extractive and manufacturing sectors.5 They are yearly survey from 1996 to 2010 from all firms with 30 or more employees. The variables used include the number of employees, value added, gross production value, investment and operating revenue.
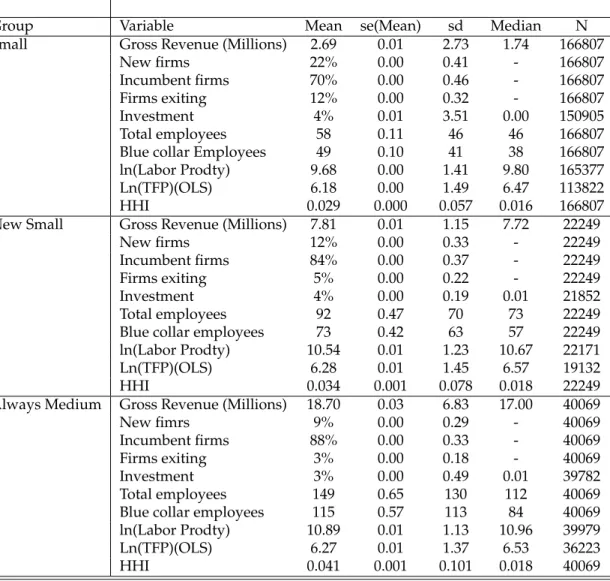
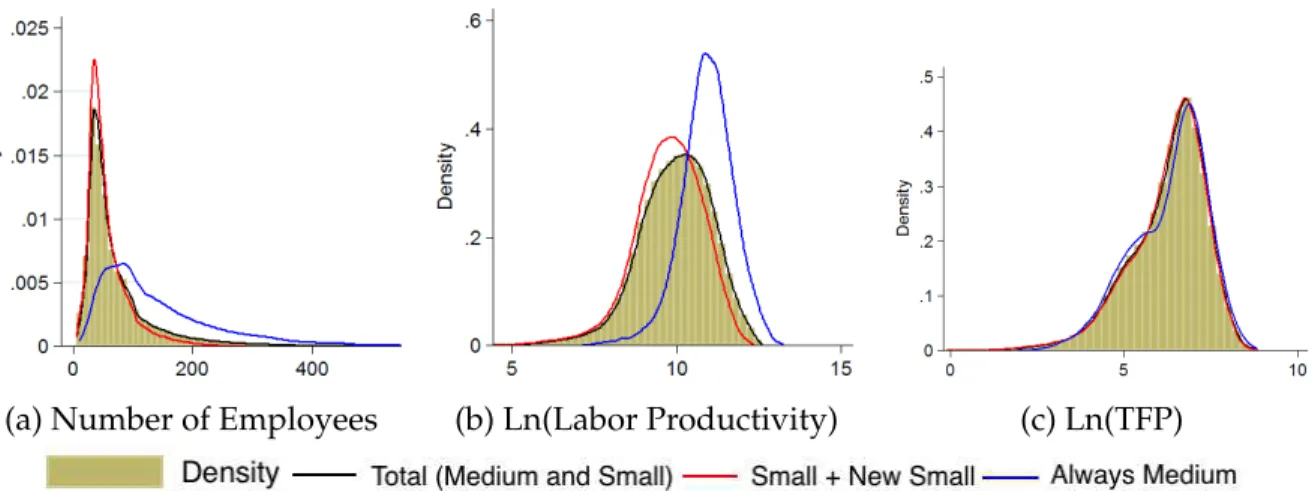
The summary statistics are shown in Table1. New small firms, those which were classified as medium before 2002, as expected, presented on average a lower num-ber of employees and a higher exit rate relative to the always medium firms group. Not only the average labor productivity of the two groups were very similar, but also the standard deviation. Figure1(b) depicts the distribution of the labor productivity while Figure1(c) shows the distribution of Total Factor Productivity (TFP). The dis-tribution of size, as number of employees per firm, is depicted on Figure1(a). Firms on the new-small group are more disperse and positive skewed on this regard. More-over, though not exposed here, the sectorial composition is quite similar for both groups of firms.
There are some sample restrictions for the causal effect estimation. In order to avoid confounding effects of other policies adopted towards manufacturing firms
2004 and a financial intermediaries spread [cf.,Ribeiro and DeNegri,2010,Ottaviano and de Sousa,
2008].
4The dataset cannot be extracted from the Brazilian statistical office.
5We focus on the manufacturing sector as defined by the Brazilian sector classification CNAE 2.0
Table 1:Summary statistics.Source:PIA, IBGE.
Group Variable Mean se(Mean) sd Median N
Small Gross Revenue (Millions) 2.69 0.01 2.73 1.74 166807
New firms 22% 0.00 0.41 - 166807
Incumbent firms 70% 0.00 0.46 - 166807
Firms exiting 12% 0.00 0.32 - 166807
Investment 4% 0.01 3.51 0.00 150905
Total employees 58 0.11 46 46 166807
Blue collar Employees 49 0.10 41 38 166807 ln(Labor Prodty) 9.68 0.00 1.41 9.80 165377
Ln(TFP)(OLS) 6.18 0.00 1.49 6.47 113822
HHI 0.029 0.000 0.057 0.016 166807
New Small Gross Revenue (Millions) 7.81 0.01 1.15 7.72 22249
New firms 12% 0.00 0.33 - 22249
Incumbent firms 84% 0.00 0.37 - 22249
Firms exiting 5% 0.00 0.22 - 22249
Investment 4% 0.00 0.19 0.01 21852
Total employees 92 0.47 70 73 22249
Blue collar employees 73 0.42 63 57 22249 ln(Labor Prodty) 10.54 0.01 1.23 10.67 22171
Ln(TFP)(OLS) 6.28 0.01 1.45 6.57 19132
HHI 0.034 0.001 0.078 0.018 22249
Always Medium Gross Revenue (Millions) 18.70 0.03 6.83 17.00 40069
New fimrs 9% 0.00 0.29 - 40069
Incumbent firms 88% 0.00 0.33 - 40069
Firms exiting 3% 0.00 0.18 - 40069
Investment 3% 0.00 0.49 0.01 39782
Total employees 149 0.65 130 112 40069
Blue collar employees 115 0.57 113 84 40069 ln(Labor Prodty) 10.89 0.01 1.13 10.96 39979
Ln(TFP)(OLS) 6.27 0.01 1.37 6.53 36223
(a) Number of Employees (b) Ln(Labor Productivity) (c) Ln(TFP)
Figure 1:Distribution of Size, Labor Productivity and TFP.Source: PIA, IBGE.
placed on low income regions, we restricted our sample to the most industrialized region, the Southeast, composed by the states of São Paulo, Rio de Janeiro, Espírito Santo and Minas Gerais. Our sample is restricted to firms operating between 2002-2004, preserving their classification at this period, when the shift in classification took place. We end up with 14,003 firms with more than 30 employees and we keep track of them over time.
3.2
Productivity Measures
Two measures of productivity were constructed: labor productivity and a TFP mea-sure.6 Besides the simplicity of our labor productivity measure, it carries important information combining the importance of both tangible and intangible capital on workers’ productivity; and, it is not affected by measurement error of firms’ capital stock. Labor productivity is simply defined as value added per worker.
6The capital stock is constructed through the perpetual inventory method. For firms starting before
1996, the initial capital is computed from information on the accounted depreciation, available in the PIA database. The production measure and intermediate consumption are deflated by a sectorial price index, IPA-OG (3-digits), while investment are deflated by an investment price index, IPA-DI. The investment rate is the ratio of investment over capital stock; and investment itself is composed by the sum of acquisition, improvements and reduction on the previous capital stock divided by value added. The TFP measure is a residual term based on an ordinary least square regression. Parameters are sector specific, to account for sectorial heterogeneity on labor and capital shares at two-digit level industries. We consider a production function such asY(A,K,LWC,LBC) =AKβkLβWCWCL
βBC
BC MβMwhere
Kdenotes capital stock,LWCandLWCare white-collar labor and blue collar labor, andMcorresponds
3.2.1 Aggregate Productivity
Aggregate productivity measures is defined as the weighted average of firm’s pro-ductivity. The weights are defined by the firm’s market share, which is constructed by their value added share. Aggregate productivity at sectorsis
Pst =
∑
i∈sθistAist, (1)
where Aist is some measure (labor productivity or TFP) of firmi’s productivity, and
θist =VAist/∑i∈sVAist, andVAdenotes value added.
It is convenient to define firm productivity relative to its sector productivity. Such an index eases cross-section comparison for each year, avoiding differences in secto-rial composition to drive further disparities. Over time, the index also facilitate the comparison by accounting for the productivity growth of the sector as a whole, which are not actually related to access to credit.
Pindexist =Aist/Pst. (2)
3.3
Causal Effect Estimation
After the BNDES reclassification in 2002, part of the medium-size firms faced better credit conditions for loans to long-term investment. The policy lasted two years and was extended to include all medium size firms under the same conditions after 2004. The goal is to compare the behavior of new-small firms to the always-small group as well as to those always-medium. In other words, the treatment is being considered new-small within 2002-2004 and two estimations will be implemented to infer effects on both control groups.
The reduced form estimates for the standard Difference-in-Difference model can be expressed by:
lnYit= β1NewSmallit+β2Postt+β3Postt×NewSmallit+Xit′γ+ǫit. (3)
The explained variable (productivity or investment) isY, while NewSmall and Post
are dummy variables representing firms classification within 2002-2003 and the pe-riod after intervention. Our parameter of interest isβ3, which captures the difference-in-difference between the conditional expected value of productivity before and after the policy for each group of firms. That is, with no controlsXit:
β3 = {E[Yit|NewSmall =1,Post =1]−E[Yit|NewSmall =1,Post =0]}
− {E[Yit|NewSmall =0,Post =1]−E[Yit|NewSmall =0,Post =0]}. (4)
firms in the same sector, value added by sector and the sector Herfindahl-Hirschman Index (HHI).7
The validity of this identification strategy relies on the assumption that the change in the threshold was exogenous to firms which could not precisely anticipate such policy change implemented by the BNDES. The difference-in-difference (DID) strat-egy adopted here is justified by some potential weakness associated with estimations exploiting the discontinuity around the new cut-offs. First, regression discontinuity analysis or DID for a optimal bandwith around the new classification are more sen-sitive to marginal manipulations around the thresholds. Second, external validity would be compromised even further. To control for size, as firms get away from the cutoff, we explicitly included deflated revenue among the covariates.
The fixed effect model is a natural extension of our standard DID formulation and can be expressed as:
lnYit = β3Postt×NewSmallit+Xit′ γ+αi+ρt+ǫit. (5)
In this case changes common to all firms are captured by the time dummies and thus are not a source of variation that identifiesβ3.
4
Results
4.1
The Causal Effect
We start by investigating the impact of this policy change on firms’ investment rate. As can be seen in Figure2, the unconditional mean of investment rate for new-small firms seems to be quite sensitive to the program. Before 2002, medium size firms presented similar levels and trends for investment rates, and after the change in the threshold the uncondicional investment rate for the new-small group increased sharply; while there was no significant shift for the always-medium group.8
The estimation results of Equation (3) for the investment rate are presented in Table 2. The policy positively change conditional investment rates, when firm and year fixed effects were not considered, and the impact was stronger for the perma-nent change, captured by the DID between new-small and always-small groups. Fur-thermore, the inclusion of firm and year fixed effects makes the effects for the tem-porary change statistically insignificant. The two years of better credit conditions does not seem enough to change new-small firms investment trend when compared to other medium size firms with similar observable characteristics, while the per-manent change did. In the comparison to always-small firms, considering firm and
7Herfindahl-Hirschman Index is measured asHH I
st =∑i∈s(Yist/∑i∈sYist)2. It is calculated yearly
at the sectorial level (2 digits). A high HHI index indicates market concentration.
8It is unclear so far why the average investment rate among firstly unaffected medium size firms
Figure 2: Log[Investment/(Capital Stock)]. New-small (Red) versus medium firms (Blue) and small firms (Green).Source:Source: PIA, IBGE.
Table 2: Policy Effect on Investment
Investment Rate (Investment / Capital Stock)
New Small vs Always Medium
PostXEligible 0.0169*** 0.0049 -0.0007 -0.0009 (0.0051) (0.0088) (0.0122) (0.0147)
New Small vs Always Small
PostXEligible 0.4190*** 0.1681*** 0.5690*** 0.3390*** (0.0377) (0.0426) (0.0230) (0.0286)
Controls No Yes No Yes
Fixed Effects No No Yes Yes
N Obs. 46491 32394 46491 32551
55687 42342 55687 42342
Standard errors in parentheses *p<0.05, **p<0.01, ***p<0.001
Controls:deflated gross revenue, State dummies, median of people employed, wage by firms in the same sector, value added by sector, and the sectorial Herfindahl-Hirschman Index (HHI)
Fixed Effects:Firm and Year fixed effects
year fixed-effects besides time varying controls, the investment rates in the new-small group was raised, on average, by roughly 34% more after the policy.
Table3shows results of the difference-in-difference model with productivity mea-sures as the explained variable. Similarly to the results based on the investment vari-able, both labor productivity and TFP are not affected by the temporary policy when firm and year fixed effects are introduced. On the other hand, the effect on produc-tivity of a permanent shift of credit conditions is positive and statistically significant. The conditional average labor productivity and TFP increased by 9% and 11%, re-spectively, in the new-small firms when year and firm fixed effects are considered.
Table 3:Policy Effect on Labor Productivity and TFP
Labor Productivity Total Factor Productivity
New Small vs Always Medium
Post X 0.0565 -0.0191 -0.0332 -0.0353 0.2461*** 0.1234*** -0.0287 -0.0404 Eligible (0.0293) (0.0298) (0.0234) (0.0268) (0.0340) (0.0316) (0.0247) (0.0282)
New Small vs Always Small
Post X 0.2641*** 0.6765*** 0.2490*** 0.0966*** 0.2479*** 0.3425*** 0.2330*** 0.1114*** Eligible (0.0263) (0.0304) (0.0118) (0.0157) (0.0300) (0.0306) (0.0136) (0.0178)
Controls No Yes No Yes No Yes No Yes
Fixed Effects No No Yes Yes No No Yes Yes
N Obs. 115709 88288 115709 88288 87296 67435 87296 67435
Standard errors in parentheses *p<0.05, **p<0.01, ***p<0.001
The productivity measures are represented in log terms and four models are estimated for each measure.
Controls:Similar to those of Table2 Fixed Effects:Firm and Year fixed effects
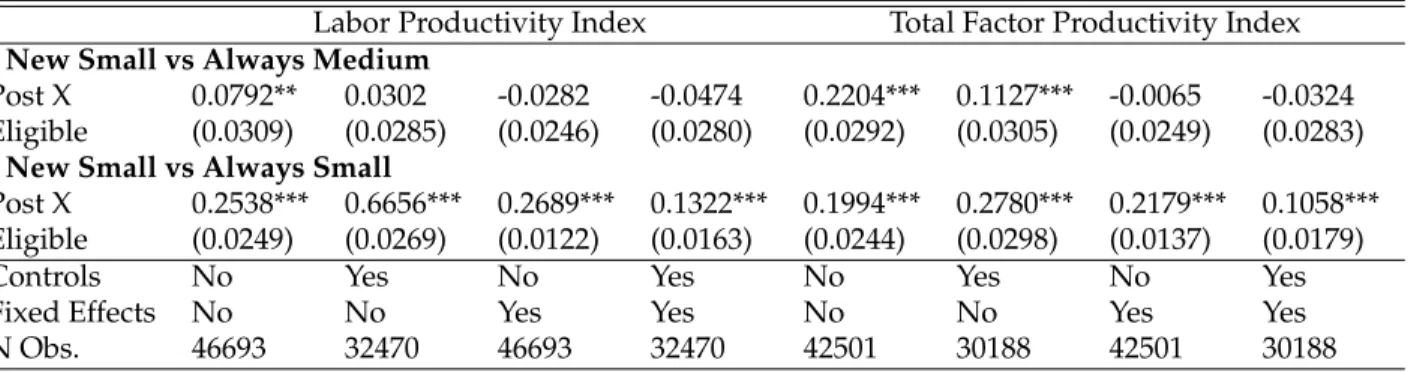
13% and 10% more in the treated group when the permanent effect is investigated.
Table 4:Policy Effect on Labor Productivity and TFP Indexes
Labor Productivity Index Total Factor Productivity Index
New Small vs Always Medium
Post X 0.0792** 0.0302 -0.0282 -0.0474 0.2204*** 0.1127*** -0.0065 -0.0324 Eligible (0.0309) (0.0285) (0.0246) (0.0280) (0.0292) (0.0305) (0.0249) (0.0283)
New Small vs Always Small
Post X 0.2538*** 0.6656*** 0.2689*** 0.1322*** 0.1994*** 0.2780*** 0.2179*** 0.1058*** Eligible (0.0249) (0.0269) (0.0122) (0.0163) (0.0244) (0.0298) (0.0137) (0.0179)
Controls No Yes No Yes No Yes No Yes
Fixed Effects No No Yes Yes No No Yes Yes
N Obs. 46693 32470 46693 32470 42501 30188 42501 30188
Standard errors in parentheses *p<0.05, **p<0.01, ***p<0.001
The productivity measures are represented in log terms and four models are estimated for each measure.
Controls:Similar to those of Table2 Fixed Effects:Firm and Year fixed effects
5
Concluding remarks
References
A. Antunes, T. Cavalcanti, and A. Villamil. The effects of credit subsidies on devel-opment. Economic Theory, 58(1):1–30, 2015. 2
A. V. Banerjee and E. Duflo. Do firms want to borrow more? testing credit constraints using a directed lending program. Review of Economic Studies, 81(2):572–607, 2014. 1
F. J. Buera, B. Moll, and Y. Shin. Well-intended policies. Review of Economic Dynamics, 16:216–230, 2013. 2
G. I. P. Ottaviano and F. L. de Sousa. O efeito do BNDES na produtividade das em-presas. In J. A. DeNegri, editor,Inovação e Crescimento das Empresas. BNDES, 2008. 3
![Figure 2: Log[Investment/(Capital Stock)]. New-small (Red) versus medium firms (Blue) and small firms (Green)](https://thumb-eu.123doks.com/thumbv2/123dok_br/16727751.745417/10.918.304.636.105.313/figure-investment-capital-stock-small-versus-medium-green.webp)