FREE THEMES
Family dyslipidemia and associated factors with changes
in lipid profile in children
Abstract This article aimed to assess the prev-alence of dyslipidemia and associated factors in children aged from 4 to 7 years old. It is a cross-sectional study conducted with 402 chil-dren aged from 4 to 7 years old, accompanied by a Lactation Support Program in the first six months of life. We measured total cholesterol, tri-glycerides and high-density lipoprotein (HDL) and low-density lipoprotein (LDL). We selected the variables that could be associated with the lipid profile, such as the family history of dyslipid-emia, nutritional status and food consumption of children. We performed Poisson regression analy-sis with robust variance. The level of significance adopted was p<0.05. We observed increased LDL values in 46.8% (188), total cholesterol in 37.6% (151), triglycerides in 10.4% (42) and below-de-sirable HDL in 33.8% (136) of the children. There was a statistically significant association between the family history of dyslipidemia with total cho-lesterol, LDL and triglycerides (p<0.05 and p < 0.001, respectively); Early weaning with LDL (p < 0.05); Sedentarism with LDL and triglycerides (p < 0.05 and p < 0.001, respectively); as well as HDL with candy consumption (p < 0.05). There was a significant prevalence of changes in the lipid profile of the children. Nutrition education activi-ties and programs aimed at this group are needed.
Key words Dyslipidemias, Children, Child’s nu-trition
Natália Aparecida de Souza 1 Sarah Aparecida Vieira 1
Poliana Cristina de Almeida Fonsêca 1 Cristiana Santos Andreoli 1
Silvia Eloiza Priore 1
Sylvia do Carmo de Castro Franceschini 1
1 Departamento de Nutrição
S
ouza N
Introduction
Changes in lifestyle throughout time have led to the rise of the epidemiological and nutritional transition1. This phenomenon is characterized by the reduction of malnutrition and the increase of overweight and obesity in all age groups, being also related to the appearance of non-commu-nicable chronic diseases (NCD), with emphasis on cardiovascular diseases, which have dyslipid-emias as the main risk factor for their develop-ment2,3.
Dyslipidemias are defined as lipoprotein metabolism disorders, such as increased total cholesterol, low-density lipoprotein (LDL) and triglycerides, and decreased high-density lipo-protein (HDL), being developed according to the exposure to genetic and/or environmental factors4,5.
These changes in the lipid profile contribute to the development of coronary artery disease (CAD), atherosclerosis and systemic arterial hy-pertension (SAH), being also secondary to obesi-ty, which may arise during childhood and poten-tialize during life, according to the combination of other factors, such as lifestyle, eating habits and family history6.
Atherosclerosis as a consequence of dyslipid-emias occurs through the formation of athero-genic lipid plaques, which are deposited in the arterial wall and may cause obstruction of blood flow7. These lipid plaques may appear on the cap-illary surface of the aorta from 3 years old and in the coronaries during adolescence8.
Studies have shown that children may pres-ent relevant changes in the lipid profile7-9. Thus, it is important to assess the lipid profile of this population in order to prevent the precocity of atherosclerotic processes and other related car-diometabolic alterations10. Therefore, this pres-ent study aimed to assess the prevalence of dys-lipidemia and associated factors in children from 4 to 7 years old.
Methods
It is a cross-sectional study that assessed the lipid profile and related factors in children aged be-tween 4 and 7 years, accompanied by the Lacta-tion Support Program (PROLAC) in the first six months of life.
PROLAC is an Extension Program of the Federal University of Viçosa (UFV) in partner-ship with the São Sebastião Hospital and the
Hu-man Milk Bank in the city of Viçosa, whose main activities are the conduction of guidelines and follow-up of mothers in the postpartum period aiming to encourage and promote breastfeeding, besides providing monthly monitoring of the mother-child binomial during the first year of the baby’s life.
We obtained information about the location of the children monitored between August 2003 (beginning of the Program) and August 2010 in PROLAC records, which was considered the limit for them to be aged between 4 and 7 years old at the time of the study.
As a criterion of non-inclusion in the study, we considered the use of medications or health changes presented by the child that interfered in his feeding and biochemical tests. After at least 3 attempts of household contact with those re-sponsible for the children, the final sample con-sisted of 402 children.
Based on the means and standard deviations of LDL cholesterol in the group of children with and without history of familial dyslipidemia (106.42 ± 25.27mg/dL, 97.49 ± 23.31mg/dL, re-spectively), the sample presented power equal to 87.41% for a significance level of 5%. We used OpenEpi online software for analysis.
The explanatory variables of the study were nutritional status, eating habits, lifestyle, family history of dyslipidemia, exclusive breastfeeding time (at least four months), socio-demographic and birth condition.
We performed the biochemical analyzes of the lipid profile in the morning, at Laborato-ry of Clinical Analysis of the Health Division - UFV, after a 12-hour fasting by venipuncture with disposable syringes. We obtained dosages of total cholesterol, HDL, LDL and triglycerides. We measured total cholesterol, HDL and tri-glycerides by the enzymatic colorimetric meth-od, with automation by the Cobas Mira Plus equipment (Roche Corp.). We calculated LDL concentrations using the Friedwald formula.9 The lipid profile was classified according to the I Guidelines for the Prevention of Atherosclerosis in Childhood and Adolescence, published by the Brazilian Society of Cardiology11.
recommend-aúd e C ole tiv a, 24(1):323-332, 2019
ed by Jelliffe12. We assessed the nutritional sta-tus by height/age (H/A) and body mass index/ age (BMI/A), according to sex and age. accord-ing to anthropometric references of the World Health Organization (WHO)13,14. We measured the waist circumference using a flexible, inelastic tape measure, with 2 meters in length, divided in centimeters at the umbilical scar level. From this measure and height, we obtained the waist-to-height ratio (WHtR) of the children, determined by the quotient of the waist measurement (cm), by the measure of height (cm)15.
We applied a food frequency questionnaire (FFQ) constructed by the researchers of this study, containing information regarding the frequency of consumption of some food such as candy, stuffed biscuit, chocolate powder, soft drinks, fruit and vegetables.
We obtained variables such as breastfeeding time (exclusive for four months) and birth weight from the PROLAC care records. Other variables such as: sex and age of the child, maternal educa-tion, family income, maternal work, marital sta-tus, family history of dyslipidemia, time in front of television (TV), time in sedentary activities and physical activity were obtained through the application of semi-structured questionnaires to those responsible for the children.
We conducted the data’s statistical analyzes in the Social Package Statistical Science (SPSS) for Windows version 17.0 and STATA version 13.0 programs. We performed the characterization of the sample through the frequency distribution and the normality of the variables assessed by the Kolmogorov-Smirnov test. In the bivariate anal-ysis, we estimated the prevalence ratio and con-fidence interval by the Poisson regression, with the variables that presented a value of p < 0.20 considered for inclusion in the multiple model with robust variance. The statistical significance considered was ≤ 0.05.
The study was approved by the Human Re-search Ethics Committee of the Federal Universi-ty of Viçosa. The children were only included in the study by signing the Informed Consent Term (ICT), by the parents or guardians. All volunteers were invited for individualized nutritional care with guidelines and delivery of the results found in the assessments performed. The children who presented changes in the lipid profile had nutri-tional follow-up and were conducted for consul-tation with a pediatrician, when the mother and/ or guardian were interested.
Results
We assessed a total of 402 children, 55% (221) males and 45% (181) females. We observed that 79.2% (317) of mothers lived with a partner, 70.8% (283) worked and 65.3% (260) had more than eight years of study. We can highlight that 25.1% (88) of the children had a family history of dyslipidemia and 84.3% (339) did not prac-tice regular physical activity. We found low birth weight in 30.8% (123) and breastfeeding for less than four months in 39.2% (155). Regarding the nutritional status, we found overweight in 25.4% (102) of the children and inadequate height in 2% (8).
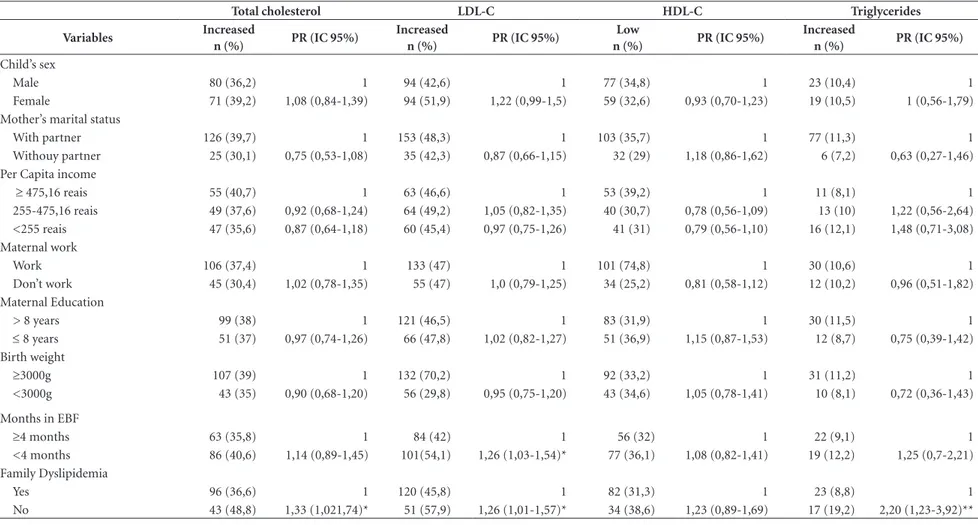
Figure 1 demonstrates the characterization of the children’s lipid profile. There was a bor-der/incresead value of total cholesterol in 37.6% (141), LDL in 46.8% (158), triglycerides in 10.4% (42) and HDL below desirable in 33.8% (136) children.
Tables 1 and 2 present the results of preva-lence ratio between the independent variables and the lipid profile of the children. We observed that there was a statistically significant associa-tion between the family history of dyslipidemia with total cholesterol (p < 0.05), LDL (p < 0.05) and triglycerides (p < 0.001). Children with a family history of dyslipidemia demonstrated a 1.3 times higher prevalence of total cholesterol and LDL altered compared to children who had no family history of dyslipidemia, while the re-sult for triglycerides was 2.2 times higher.
Regarding the time of breastfeeding, we ob-served that there was a statistically significant as-sociation between exclusive breastfeeding of less than four months and LDL (p < 0.05). Children who were breastfed for less than four months had 1.26 times higher prevalence of altered LDL compared to those who were breastfed for lon-ger than four months. Moreover, children who did not practice physical activity had 1.24 times higher prevalence of altered LDL (p < 0.05) and 2.22 times higher triglycerides (p < 0.001), com-pared to children who practiced.
There was no statistically significant associ-ation between the consumption variables and children’s lipid profile (Table 3).
S
ouza N
analysis there was a statistically significant asso-ciation between HDL and candy consumption (p < 0.05). Children who consumed candy more than seven times a week had 1.54 times higher prevalence of HDL change compared to children who consumed less frequently.
Discussion
The present study demonstrated a high preva-lence of changes in children’s lipid profile, with a main highlight for LDL cholesterol (46.8%). Changing the values of this lipoprotein can in-duce atherogenic processes even at an early age, and HDL when at low levels increases the risk for cardiovascular diseases (CVD), since it prevents the oxidation and aggregation of LDL in the ar-teries3.
In a study conducted in Belém-PA with chil-dren and adolescents aged from 6 to 19 years old, changes in total cholesterol were observed
in 33.4%, LDL in 18.6%, HDL in 29.5% and tri-glycerides in 15.8%, values close to those found in the present study, except for LDL16. A study conducted in Campina Grande-PB, aged from 2 to 9 years old, showed changes in LDL in 47.1% of the children , and total cholesterol in 37.8%, a result similar to this study17.
Different results were found in a study con-ducted in Campinas-SP with children and ad-olescents aged from 2 to 19 years olf, with total cholesterol changed in 44%, LDL in 36%, HDL in 44% and triglycerides in 56% in the age group from 2 to 9 years old18. Franca & Alves8 in a study with children and adolescents of Pernambuco found changes in total cholesterol in 29.7%, LDL in 25.4% and triglycerides in 18.9%, in children younger than 10 years old, being total cholesterol the result that is closest to this study.
The history of familial dyslipidemia was the main factor associated with dyslipidemia in chil-dren. There are few studies in the literature that relate the children’s lipid profile with a family
Figure 1. Classification of children’s lipid profile from 4 to 7 years old. LDL = Low density lipoprotein; HDL = High density lipoprotein.
Numerical data figure 1: Classification of children’s lipid profile from 4 to 7 years old.
Total cholesterol Triglycerides LDL HDL
Desirable 62,4 89,6 53,2 66,2
Borderline/Increased 37,6 10,4 46,8
Below desirable 33,8
62,4
89,6
53,2
66,2
37,6
10,4
46,8
33,8
0 10 20 30 40 50 60 70 80 90 100
Colesterol Total Triglicerídeos LDL HDL
P
ercent
u
a
l
aúd e C ole tiv a, 24(1):323-332, 2019
history of dyslipidemia. Santos et al.3 emphasized that the family history of dyslipidemia increas-es the probability of developing atherosclerosis and other CVD, which may still originate during childhood, demonstrating the importance of early intervention, since the combination of ge-netic and environmental factors can enhance this process. In a study conducted with adolescents, children of CAD patients, there were higher con-centrations of total cholesterol, LDL, and lower HDL concentrations compared to those with no family history19.
In the present study there was an association between early weaning of children (<4 months) and LDL concentrations. According to an ob-servational study conducted in Pelotas-RS, in-fants exclusively breastfed for a longer period of time, developed better intelligence (IQ) and income and education in adulthood, compared to those non-breastfed infants due to breast milk present in its composition saturated long-chain fatty acids that contribute to neuronal devel-opment20. Another factor to consider is that ex-clusive breastfeeding proves to be a protective factor against overweight21,22. The presence of overweight and obesity is often associated with changes in the lipid profile6.
The practice of regular physical activity was also related to children’s LDL and triglyceride lev-els. According to Fagundes et al.23, the practice of regular physical activity is capable to improve the lipid profile, causing an increase in HDL (4.6%) and a decrease in triglycerides (3.7%) and LDL (5%). In the same study, it was verified that adults who practiced physical activity during childhood and adolescence were 83% less likely to present dyslipidemia. In the study by Ribeiro et al.24 with students aged from 6 to 18 years old, it was ver-ified that the less active students presented 3.8 times more chance of increased total cholester-ol in comparison to the more active ones, being also correlated to overweight. Considering these results, physical activity should be increasingly encouraged, with early start and maintenance during adolescence and adulthood19.
Regarding children’s food consumption, we verified a significant association between can-dy consumption greater than or equal to seven times a week and HDL. This result reflects inad-equate food consumption, as these children who are likely to consume excessively candy do not have a nutritionally adequate diet. Studies with children demonstrate an increase in the con-sumption of low-nutrient foods rich in calories, sugars and fats, as well as the low consumption of
Table 1. Socio-demographic characteristics, birth, lifestyle, family history and nutritional status of children from 4 to 7 years old.
Variables N %
Age
4-5 years 177 44
6-7 years 225 56
Sex
Male 221 55
Female 181 45
Household per capita income a
< 255 reais 135 34
255-475,16 reais 130 32.7
≥ 475,16 reais 132 33.3
Mother’s marital status
With partner 317 79.2
Withouy partner 83 20.8
Maternal work b
Work 283 70.8
Don’t work 117 29.2
Escolaridade Materna c
> 8 years 260 65.3
≤ 8 years 138 34.7
Family Dyslipidemia d
Yes 88 25.1
No 262 74.9
Birth weight e
≥ 3000g 277 69.2
< 3000g 123 30.8
Exclusive breastfeeding f
≥ 4 months 240 60.8
< 4 months 155 39.2
Daily time in front of TV g
≤ 2 hours 203 50.6
> 2 hours 198 49.4
Practice of Physical Activity
Yes 63 15.7
No 339 84.3
Time in sedentary activities
≤ 2 hours 151 37.6
> 2 hours 251 62.4
BMI/Age
Low weight 10 2.5
Eutrophy 290 72.1
Overweight 73 18.2
Obesity 29 7.2
Height/Age
Adequate height 394 98
Low height 8 2
an=397 respondents/categorized in tertile bn=400 respondents cn=398 respondents dn=350 respondents en =400 respondents fn = 395 respondents gn = 401 respondents. BMI = Body mass
Table 2. Prevalence of changes in lipid profile and crude prevalence ratios, according to socio-demographic, birth, lifestyle, family history and nutritional status variables of children from 4 to 7 years old.
Total cholesterol LDL-C HDL-C Triglycerides
Variables Increased
n (%) PR (IC 95%)
Increased
n (%) PR (IC 95%)
Low
n (%) PR (IC 95%)
Increased
n (%) PR (IC 95%)
Child’s sex
Male 80 (36,2) 1 94 (42,6) 1 77 (34,8) 1 23 (10,4) 1
Female 71 (39,2) 1,08 (0,84-1,39) 94 (51,9) 1,22 (0,99-1,5) 59 (32,6) 0,93 (0,70-1,23) 19 (10,5) 1 (0,56-1,79)
Mother’s marital status
With partner 126 (39,7) 1 153 (48,3) 1 103 (35,7) 1 77 (11,3) 1
Withouy partner 25 (30,1) 0,75 (0,53-1,08) 35 (42,3) 0,87 (0,66-1,15) 32 (29) 1,18 (0,86-1,62) 6 (7,2) 0,63 (0,27-1,46)
Per Capita income
≥ 475,16 reais 55 (40,7) 1 63 (46,6) 1 53 (39,2) 1 11 (8,1) 1
255-475,16 reais 49 (37,6) 0,92 (0,68-1,24) 64 (49,2) 1,05 (0,82-1,35) 40 (30,7) 0,78 (0,56-1,09) 13 (10) 1,22 (0,56-2,64)
<255 reais 47 (35,6) 0,87 (0,64-1,18) 60 (45,4) 0,97 (0,75-1,26) 41 (31) 0,79 (0,56-1,10) 16 (12,1) 1,48 (0,71-3,08)
Maternal work
Work 106 (37,4) 1 133 (47) 1 101 (74,8) 1 30 (10,6) 1
Don’t work 45 (30,4) 1,02 (0,78-1,35) 55 (47) 1,0 (0,79-1,25) 34 (25,2) 0,81 (0,58-1,12) 12 (10,2) 0,96 (0,51-1,82)
Maternal Education
> 8 years 99 (38) 1 121 (46,5) 1 83 (31,9) 1 30 (11,5) 1
≤ 8 years 51 (37) 0,97 (0,74-1,26) 66 (47,8) 1,02 (0,82-1,27) 51 (36,9) 1,15 (0,87-1,53) 12 (8,7) 0,75 (0,39-1,42)
Birth weight
≥3000g 107 (39) 1 132 (70,2) 1 92 (33,2) 1 31 (11,2) 1
<3000g 43 (35) 0,90 (0,68-1,20) 56 (29,8) 0,95 (0,75-1,20) 43 (34,6) 1,05 (0,78-1,41) 10 (8,1) 0,72 (0,36-1,43)
Months in EBF
≥4 months 63 (35,8) 1 84 (42) 1 56 (32) 1 22 (9,1) 1
<4 months 86 (40,6) 1,14 (0,89-1,45) 101(54,1) 1,26 (1,03-1,54)* 77 (36,1) 1,08 (0,82-1,41) 19 (12,2) 1,25 (0,7-2,21)
Family Dyslipidemia
Yes 96 (36,6) 1 120 (45,8) 1 82 (31,3) 1 23 (8,8) 1
No 43 (48,8) 1,33 (1,021,74)* 51 (57,9) 1,26 (1,01-1,57)* 34 (38,6) 1,23 (0,89-1,69) 17 (19,2) 2,20 (1,23-3,92)**
329
Ciência & S aúde C
oleti va, 24(1):323-332, 2019
Time in sedentary activities
≤ 2 hours 62 (41,3) 1 73 (48,6) 1 59 (39,3) 1 15 (7,8) 1
> 2 hours 89 (35,4) 0,87 (0,68-1,12) 115 (45,8) 0,95 (0,77-1,18) 77 (30,7) 0,79 (0,61-1,04) 27 (13,1) 1,09 (0,6-1,96)
Daily time in front of TV
≤ 2 hours 71 (35) 1 95 (46,8) 1 68 (33,5) 1 16 (10) 1
> 2 hours 80 (40,4) 1,16 (0,91-1,50) 93 (46,9) 1,01 (0,82-1,25) 68 (34,3) 1,03 (0,79-1,36) 26 (10,7) 1,67 (0,93-3,01)
Practice of Physical Activity
Yes 90 (37,6) 1 104 (43,5) 1 74 (30,9) 1 17 (7,1) 1
No 61 (38,1) 1,05 (0,82-1,34) 84 (52,5) 1,24 (1,01-1,52)* 60 (37,5) 1,15 (0,87-1,51) 25 (15,1) 2,22 (1,25-3,95)**
BMI/Age
No overweight 112 (37,5) 1 138 (48,5) 1 97 (32,4) 1 29 (9,7) 1
With overweight 39 (36,7) 1,01 (0,75-1,04) 50 (46,1) 1,05 (0,83-132) 39 (37,8) 1,16 (0,86-1,57) 13 (12,6) 1,30 (0,70-2,40)
Height/Age
Adequate height 147 (37,3) 1 184 (46,7) 1 132 (33,5) 1 40 (10,1) 1
Low height 4 (50) 1,34 (0,66-2,71) 4 (50) 1,07 (0,53-2,15) 4 (50) 1,49 (0,73-3,02) 2 (25) 2,46 (0,71-8,48)
WHtR
< 0,5 111 (36,3) 1 137 (44,7) 1 97 (31,7) 1 28 (9,2) 1
>0,5 39 (41,5) 1,14 (0,86-1,51) 50 (52,2) 1,18 (0,94-1,49) 37 (37,4) 1,24 (0,91-1,67) 14 (14,9) 1,62 (0,89-2,96)
EBF = exclusive breast feeding; TV= television; BMI = Body mass index by age. WC = waist circumference; WHtR = Waist-to-height ratio; PR = Prevalence ration; CI = confindence interval; LDL = Low density lipoprotein; HDL = High density lipoprotein. *p < 0,05; **p < 0,001.
Variables
Table 3. Prevalence of changes in the lipid profile and crude prevalence ratios, according to the food consumption variables of children from 4 to 7 years old.
Total cholesterol LDL-C HDL-C Triglycerides
Variables Increased
n (%) PR (IC 95%)
Increased
n (%) PR (IC 95%)
Low
n (%) PR (IC 95%)
Increased
n (%) PR (IC 95%)
Candy
Consumption < 7x/week 41 (35,3) 1 8 (46,5) 1 33 (28,4) 1 54 (6,9) 1
Consumption ≥ 7x/week 109 (38,3) 1,08 (0,81-1,44) 133 (46,8) 1,0 (0,79-1,26) 103 (36,2) 1,27 (0,91-1,76) 34 (11,9) 1,73 (0,82-3,63)
Stuffed biscuit
Consumption < 6x/week 60 (37,7) 1 14 (50,9) 1 51 (32) 1 81 (8,8) 1
Consumption ≥ 6x/week 91 (37,6) 0,99(0,79-1,28) 107 (44,2) 0,86 (0,7-1,06) 85 (35,1) 1,09 (0,82-1,145) 28 (11,5)
Soft Drinks 1,42 (0,76-2,64)
Consumption < 6x/week 61 (39,1) 1 13 (52,5) 1 72 (33,9) 1 82 (8,3) 1
Consumption ≥ 6x/week 90 (36,7) 0,93 (0,72-1,21) 106 (43,2) 0,82 (0,66-1,01) 63 (33,8) 0,99 (,075-1,31) 29 (11,8) 1,42 (0,76-2,64)
Chocolate powder
Consumption < 9x/week 64 (35,7) 1 17 (14,6) 1 60 (33,5) 1 89 (9,5) 1
Consumption ≥ 9x/week 87 (39,1) 1,09 (0,84-1,41) 99 (85,4) 1,02 (0,77-1,34) 76 (34,2) 1,18 (0,66-2,12) 25 (11,3) 0,89 (0,72-1,10)
Fruit
Consumption ≥ 10x/week 80 (38,4) 1 21 (49) 1 71 (34,1) 1 102 (10,1) 1
Consumption < 10x/week 70 (36,6) 0,95 (0,73-1,22) 84 (43,9) 0,89 (0,72-1,10) 64 (33,5) 0,98 (0,74-1,29) 21 (10,9) 1,08 (0,61-1,93)
Vegetables
Consumption ≥ 11x/week 71 (37,9) 1 25 (48,8) 1 72 (34,1) 1 103 (11,8) 1
Consumption < 11x/week 80 (37,5) 0,99 (0,76-1,27) 84 (44,4) 0,91 (0,73-1,12) 63 (33,3) 0,97 (0,74-1,28) 17 (9) 0,75 (0,42-1,36)
aúd
e C
ole
tiv
a,
24(1):323-332,
2019
foods rich in fiber, vitamins and minerals, such as vegetables and fruits by this population6,17,25,26. Inadequate feeding favors changes in lipid profile and contributes to overweight, and it is import-ant to encourage the practice of healthy feeding since the childhood to prevent such changes17.
Although this study does not demonstrate a significant association between the nutritional status and children’s lipid profile, it is noteworthy that 25.4% of the children were overweight. Ac-cording to the Household Budget Survey (HBS) 2008-2009, children between 5 and 9 years old, present a lower prevalence for malnutrition and higher for obesity, with a weight deficit diag-nosed at 4.1% and overweight in 33.5% of Bra-zilian children27. The increase in body adiposity may contribute to changes in lipid profile and cardiovascular risk in adult life28.
Despite the significant association found be-tween candy consumption and HDL, many foods had no significant association with lipid profile. A limiting factor is that children’s feeding was assessed through food records and FFQ, which, even though the filling forms were clarified, they may have led to an underestimation and/or over-estimation of the quantities, types of foods that were consumed and offered to the children, as well as memory bias by mothers and/or guard-ians.
Another limitation of this study was that not all mothers and/or guardians were able to re-spond to variables such as maternal education, family income, family history of dyslipidemia, maternal work, breastfeeding, birth weight and child’s daily time in front of the TV, thus there were losses in the sample regarding their infor-mation.
Therefore, we concluded that the children presented a high prevalence of changes in the lipid profile, which is directly related to factors such as early weaning, family history of dyslip-idemia, sedentary lifestyle and inadequate food consumption.
Therefore, nutritional education activities and programs aimed at this group, which con-template the practice of physical activity, exclu-sive breastfeeding and healthy feeding, are neces-sary in order to prevent such changes, since they may remain during adolescence and adulthood.
Collaborations
NA Souza and SA Vieira - Contribution to the study: data collection and analysis, article elabo-ration. PCA Fonseca and CA Andreoli - Contri-bution to the study: data collection and analysis. SE Priore - Contribution to the study: data ana-lysis and article elaboration. SCC Franceschini - Contribution to the study: article elaboration and work guidance.
Acknowledgments
The project was funded by the State of Minas Gerais Research Support Foundation (FAPEMIG).
Table 4. Final model of the Poisson Regression analysis for the variables associated with children’s lipid profile from 4 to 7 years old.
Lipid Profile Variables Adjusted RP (CI95%) Value p*
Total cholesterol11 Presence of familial dyslipidemia 1,33 (1,02-1,74) 0,035
LDL cholesterol2 Presence of familial dyslipidemia 1,30 (1,04-1,63) 0,020
Early weaning (<4 months) 1,29 (1,05-1,59) 0,016
HDL cholesterol3 Candy consumption > 7x/week 1,54 (1,05-2,25) 0,026
Triglycerides4 Presence of familial dyslipidemia 2,20 (1,23-3,94) 0,007
S
ouza N
References
1. Reuter EM, Reuter CP, Burgos LT, Reckiziegel MB, Ne-del FB, Albuquerque IM, Pohl HH, Burgos MS. Obesi-dade e hipertensão arterial em escolares de Santa Cruz do Sul – RS, Brasil. Rev Assoc Med Bras 2012; 58(6):666-672.
2. Goldani MZ, Mosca PRF, Portella AK, Silveira PP, Silva CH. O impacto da transição demográfico-epidemioló-gica na saúde da criança e do adolescente do Brasil. Rev HCPA 2012; 32(1):49-57.
3. Santos MG, Pegoraro M, Sandrini F, Macuco EC. Risk factors for the development of atherosclerosis in childhood and adolescence. Arq Bras Cardiol 2008; 90(4):301-308.
4. Nobre LN, Lamounier JA, Franceschini SCC. Socio-demographic, anthropometric and dietary determi-nants of dyslipidemia in preschoolers. J Pediatr 2013; 89(5):462-469.
5. Barbosa L, Chaves OC, Ribeiro RCL. Anthropometric and body composition parameters to predict body fat percentage and lipid profile in schoolchildren. Rev Paul Pediatr 2012; 30(4):520-528.
6. Silva RA, Kanaan S, Silva LE, Peralta RHS. Estudo do perfil lipídico em crianças e jovens do ambulatório pe-diátrico do Hospital Universitário Antônio Pedro as-sociado ao risco de dislipidemias. J Bras Patol Med Lab
2007; 43(2):95-101.
7. Honorato ASD, Bando E, Uchimura TT, Junior MM. Perfis antropométrico, lipídico e glicêmico em adoles-centes de uma instituição filantrópica no noroeste do Paraná. J Bras de Patol Med Lab 2010; 46(1):7-15. 8. Franca E, Alves JGB. Dislipidemia entre Crianças e
Adolescentes de Pernambuco. Arq Bras Cardiol 2006; 87(6):722-727.
9. Ramos AT, Carvalho DF, Gonzaga NC, Cardoso AS, Noronha JAF, Cardoso MAA. Lipid profile in over-weight children and adolescentes. Journal of Human Growth and Development 2011; 21(3):780-778. 10. Giuliano ICB, Coutinho MSSA, Freitas SFT, Pires
MMS, Zunino JN, Ribeiro RQC. Lípideos Séricos em Crianças e Adolescentes de Florianópolis, SC – Estudo Floripa Saudável 2040. Arq Bras Cardiol 2005; 85(2):85-91.
11. Sociedade Brasileira de Cardiologia (SBC). I Diretriz de Prevenção da Aterosclerose na Infância e na Adoles-cência. Arq Bras Cardiol 2005; 85(Supl. 6):1-36. 12. Jelliffe DB. Evaluación del estado de nutrición de la
co-munidad. Ginebra: Organización Mundial de La Salud; 1968.
13. World Health Organization (WHO). Training course on child growth assessment. Geneva: WHO; 2008. 14. World Health Organization (WHO) [página na
Inter-net]. Growth Reference 5–19 Years [acessado 2015 Ago 12]. Disponível em: http://www.who.int/growthref/en/. 15. Asayama K, Oguni T, Hayashi K, Dobashi K, Fukunaga
Y, Kodera K, Tamai H, Nakazawa S. Critical value for the index of body fat distribution based on waist and hip circumferences and stature in obese girls. J Obes Relat Metab Disor 2000; 24(8):1026-1031.
16. Ribas AS, Silva LCS. Dislipidemia em Escolares na rede Privada de Belém. Arq Bras Cardiol 2009; 92(6):446-451.
17. Barros VO, Silva ML, Gonçalves CC, Tavares JS, Silva ME, Guedes ATL, et al. Perfil alimentar de crianças com excesso de peso atendidas em Unidades Básicas de Saúde da Família em Campina Grande-PB. Alim Nutri
2011; 22(2):239-245.
18. Faria EC, Dalpino FB, Takata R. Serum Lipids and li-poproteins in children and adolescents from a public university hospital outpatient clinic. Rev Paul Pediatr
2008; 26(1):54-58.
19. Mendes GA, Martinez TL, Izar MC, Amancio OM, Novo NF, Matheus SC, Bertolami MC, Fonseca FAH. Perfil Lipídico e Efeitos da Orientação Nutricional em Adolescentes com História Familiar de Doença Arte-rial Coronariana Prematura. Arq Bras Cardiol 2006; 86(5):361-365.
20. Victora CG, Horta BL, Loret de Mola C, Quevedo L, Pinheiro RT, Gigante DP, Gonçalves H, Barros FC.As-sociation between breastfeeding and intelligence, edu-cational attainment, and income at 30 years of age: a prospective birth cohort study from Brazil. Lancet Glob Health 2015; 3(4):199-205.
21. Simom VGN, Souza JMP, Souza SB. Aleitamento mater-no, alimentação complementar, sobrepeso e obesidade em pré-escolares. Rev Saude Publica 2009; 43(1):60-69. 22. Siqueira RS, Monteiro CA. Amamentação na infância
e obesidade na idade escolar em famílias de alto nível socioeconômico. Rev Saude Publica 2007; 41(1):5-12. 23. Fagundes ALN, Ribeiro DC, Naspitz L, Garbelini LEB,
Vieira JKP, Silva AP, Lima VO, Fagundes DJ, Compri PC, Juliano Y. Prevalência de sobrepeso e obesidade em escolares da região de Parelheiros do município de São Paulo. Rev Paul Pediatr 2008; 26(3):212-217.
24. Ribeiro RQC, Lotufo PA, Lamounier JA, Oliveira RG, Soares JF, Botter DA. Fatores adicionais de risco car-diovascular associados ao excesso de peso em crianças e adolescentes. O estudo do coração de Belo Horizonte.
Arq Bras Cardiol 2006; 86(6):408-418.
25. Bortoline GA, Gubert MB, Santos LMP. Consumo ali-mentar entre crianças brasileiras com idade de 6 a 59 meses. Cad Saude Publica 2012; 28(9):1759-1771. 26. Farias Junior G, Osório MM. Padrão alimentar de
crianças menores que cinco anos. Rev Nutr 2005; 18(6):793-802.
27. Instituto Brasileiro de Geografia e Estatística (IBGE).
Pesquisa de orçamentos familiares 2008-2009. Antropo-metria e estado nutricional de crianças, adolescentes e adultos no Brasil. Rio de Janeiro: IBGE; 2010.
28. Pizzi J, Silva LR, Moser D, Leite N. Relação entre ateros-clerose subclínica, pressão arterial e perfil lipídico em crianças e adolescentes obesos: uma revisão sistemáti-ca. Arq Bras Endocrinol Metab 2013; 57(1):1-6.
Article presented 07/18/2016 Approved 03/20/2017
Final version presented 03/22/2017
This is an Open Access article distributed under the terms of the Creative Commons Attribution License