Carlota Moutinho Pascoal
Licenciada em Bioquímica
Immunological aspects of glycosylation: from aberrant to
defective glycosylation
Dissertação para obtenção do Grau de Mestre em
Bioquímica para a Saúde
Orientador: Paula Videira, Profesora Auxiliar, FCT/UNL
Co-orientador: Tiago João Ferro, MSc, UCIBIO
Faculdade de Ciência e Tecnologia
–
Universidade Nova de Lisboa
iii
Copyright
Direitos de Autor
Immunological Aspects of Glycosylation: from aberrant to defective glycosylation
Carlota Moutinho Pascoal
FCT-UNL, UNL
The Faculty of Sciences and Technology and the NOVA University of Lisbon have the right, forever and without geographical limits, to file and publish this dissertation through printed copies reproduced in paper or by digital means, or by any other mean known or that is invented, and to disclose it through scientific repositories and to allow its copying and distribution for non-commercial educational or research purposes, provided that the author and editor are credited.
A Faculdade de Ciências e Tecnologia e a Universidade Nova de Lisboa têm o direito, perpétuo e
sem limites geográficos, de arquivar e publicar esta dissertação através de exemplares impressos
reproduzidos em papel ou de forma digital, ou por qualquer outro meio conhecido ou que venha a
ser inventado, e de a divulgar através de repositórios científicos e de admitir a sua cópia e distribuição
com objetivos educacionais ou de investigação, não comerciais, desde que seja dado crédito ao
v
The work developed during this master project has originated:
Oral presentations:
Carlota Pascoal, Rita Francisco, Vanessa dos Reis Ferreira, Paula A. Videira, A new approach to boost biomedical knowledge across rare diseases: the symptom profile and experience of children and adults with CDG,How patient centricity shapes the future of healthcare in Portugal: Results from
CDG & Allies-PPAIN, FCT-UNL, May 16th, Caparica, Portugal, 2017
Posters:
Pascoal C, Francisco R, Marques-da-Silva D, Morandat P, Videira PA, Forbat L and dos Reis Ferreira V, Outcomes measures for clinical trials in rare diseases: PMM2-CDG as a model, International
scientific CDG symposium, Irish College, July 13th-14th, Leuven, Belgium, 2017
Scientific articles (approved for publication):
Francisco R, Pascoal C, Marques-da-Silva D, Morava E, Gole GA, Coman D, Jaeken J, dos Reis Ferreira V, Keeping an Eye on Congenital Disorders of O-Glycosylation A systematic literature review,
submitted in Journal of Inherited Metabolic Disease.
Carrascal MA, Silva M, Ramalho JS, Pen C, Martins M, Pascoal C, Amaral C, Serrano I, Oliveira MJ, Sackstein, Videira PA, Inhibition of fucosylation in human invasive ductal carcinoma reduces E-selectin ligand expression, cell proliferation and ERK1/2 and p38 MAPK activation, submitted in
Molecular Oncology.
Patient-friendly document (Portuguese and English version, under graphic design with expected publication by the end of 2017):
Carlota Pascoal, Rita Francisco, Dorinda Marques-da-Silva, Vanessa dos Reis Ferreira, Paula A. Videira, Revised by: Eva Morava, David Cassimanand Jaak Jaeken, Immunological aspects of Congenital Disorders of Glycosylation (CDG): a community friendly document, a project led by
vii
“Don’t limit yourself. Many people limit themselves to what they can do.
You can go as far as your mind lets you.
What you believe, remember, you can achieve.”
ix
Aknowledgements
First of all, I would like to thank Prof. Paula Videira due to the amazing opportunity given to me to work in her Glycoimmunology group, for being my mentor over this year and for all the given knowledge, advice and encouragement.
I am sincerely grateful to Tiago Ferro, for accepting the co-supervision of this thesis and for all the teaching, guidance, patience and help in my times of despair or existential crisis.
To Dr. Vanessa Ferreira, the APCDG and the CDG&Allies-PPAIN, I am thankful for believing in me and for all the opportunities to work on something that truly warms my heart.
I could not fail to thank Rita Francisco for all the excellent work that we developed together, for all the support and motivation. Also, to Pierre Morandat for all the ‘informatics teaching’ and Dorinda Marques-da-Silva for all the advice.
I thank my lab colleagues: Constança, Roberta, Fanny, Liliana, Mylène, Diana and Zélia, for all the help provided, friendship and amazing times in the lab.
To all my friends that supported me during this (rough!) year. I am extremely lucky to have so many good people in my life. I can not avoid giving a big THANK YOU to Joana, Juliana, Ana Raquel, Bruno, Rafael, Gabriela, Nádia, Daniel, Nuno, Inês, Cláudia, Patrícia, Mendonça, Pedro Reis, Nuno Marques, Andreia, Leonor, Patrícia Patrão, Filipe, Reis, Ricardo, Mini, Sofia, Daniel, Miguel, Patrícia Sequeira, Bárbara, Joana Gonçalves, Catarina and António.
To our collaborators for providing essential material for the development of this work, namely to Dr. Fabio Dall’Olio for the colorectal cancer cell lines and Dr. Joseph Lau for the ST6Gal I enzyme and antibody.
To my precious family, specially to my parents and brother that made the (im)possible for me to be who I am and where I am today, to my “second parents”, my uncles, that welcomed and hosted me into their home as their own daughter and to my cousins, for all the times of laughter.
xi
Abstract
Glycosylation is crucial in many biological processes, like cell recognition, signaling and development. Many diseases present altered glycosylation and two extremes are cancer and congenital disorders of glycosylation (CDG), with aberrant and defective glycosylation, respectively. Sialic acids are glycans’ terminal sugars with an immunomodulatory role and when decreased, typically activate immune cells, as dendritic cells. Interestingly, both ST6Gal-I and its derived α2,6 sialylation are overexpressed in cancer. Here, we hypothesized that cancer cells secret functional ST6Gal-I that modulates immune cells’ glycosylation and their activity as a cancer immune evasion mechanism.
Also interestingly, patients with PMM2-CDG (the most frequent CDG type) present immunological affectation. Here, we hypothesized that the PMM2-CDG-defective glycosylation observed also influences the function of immune cells.
Therefore, the main goals of this study comprised the assessment of the immunological aspects of cancer cells and CDG glycosylation. Specifically, we intended to (1) study the expression and secretion of ST6Gal-I by colorectal cancer (CRC) cells and test its function in modulating immune cells activity; (2) develop a PMM2-CDG leukocyte cell line as a model to unravel patients’ immunity and to evaluate their response to mitogenic stimulation. Moreover, as PMM2-CDG have a profound impact in patients’ quality of life (QoL), patient and observer reported outcomes measures (PROMs and ObsROMs) were reviewed. These may integrate primary endpoints in clinical trials to find treatment to PMM2-CDG.
Our data demonstrated that (1) CRC cells secret ST6Gal-I enzyme, however further work is needed to evaluate its role in immune modulation; (2) PMM2-CDG T cells have higher proliferation capacity and IFN-γ cytokine expression, in response to a mitogen as compared to the healthy control and (3) there are significant numbers of tools for future evaluation of PMM2-CDG patients’ and caregivers’ QoL.
This study may contribute to better understand the glycan-related pathological mechanisms.
Keywords:
xiii
Resumo
A glicosilação é crucial em muitos processos biológicos, como o reconhecimento, sinalização e desenvolvimento celular. Muitas doenças apresentam glicosilação alterada e dois extremos são o cancro e doenças congénitas da glicosilação (CDG), com glicosilação aberrante e defeituosa, respectivamente.
Ácidos siálicos são açúcares terminais de glicanos com papel imunomodulatório e, quando diminuídos, tipicamente ativam células imunes, como as células dendríticas. Curiosamente, tanto o enzima ST6Gal-I como a sua derivada sialilação α2,6 estão sobreexpressas em cancro. Aqui, pôs-se a hipótepôs-se que as células cancerígenas pôs-secretam ST6Gal-I que modula a glicosilação das células imunes e a sua atividade como um mecanismo de evasão imunológica.
Por outro lado, pacientes com PMM2-CDG (o tipo de CDG mais frequente) apresentam envolvimento imunológico. Aqui, pôs-se a hipótese que a glicosilação defeituosa observada em PMM2-CDG também influencia a função das células imunes.
Assim, os principais objetivos deste estudo abrangeram a avaliação dos aspectos imunológicos da glicosilação em cancro e CDG. Especificamente, pretendemos (1) estudar a expressão e secreção de ST6Gal-I por células de cancro colorectal (CRC) e testar a sua capacidade de modular a atividade das células imunes; (2) desenvolver uma linha celular leucocitária PMM2-CDG como um modelo para desvendar a imunidade dos pacientes e avaliar a sua resposta a uma estimulação mitogénica. Para além disso, como a PMM2-CDG tem um profundo impacto na qualidade de vida (QoL) dos pacientes, foram revistos patient e observer reported outcomes
measures (PROMs e ObsROMs). Estas medidas podem vir a integrar endpoints primários em
ensaios clínicos para encontrar tratamento para a PMM2-CDG.
Os nossos dados demostraram que (1) células de CRC secretam o enzima ST6Gal-I, contudo, é necessário trabalho futuro para avaliar o seu papel na modulação imune; (2) Células T PMM2-CDG têm uma capacidade de proliferação e expressão da citocina IFN-γ mais elevadas em resposta a uma estimulação mitogénica em comparação com o controlo saudável e (3) existe um número significante de instrumentos para futura avaliação da QoL de pacientes PMM2-CDG e dos seus cuidadores.
Este estudo pode contribuir para uma melhor compreensão dos mecanismos patológicos relacionados com glicanos.
Palavras-chave:
xv
Table of Contents1.
Introduction ... 1
1.1.
Immune system ... 1
Innate immune response ... 1
Adaptive immune response ... 1
Mitogen Stimulation... 3
1.2.
Glycosylation ... 3
Glycosylation and its immunological function ... 5
Sialic Acids roles in the immune system ... 5
Sialyltransferases ... 6
β
-
galactoside α2,6
-sialyltransferase 1 ... 7
Biological roles of ST6Gal-I soluble form: extrinsic glycosylation. ... 8
1.3.
Cancer ... 8
Cancer Hallmarks ... 8
Cancer evasion of the immune response ... 9
Glycosylation and Cancer ... 10
Colorectal cancer ... 11
ST6Gal-I and CRC ... 11
1.4.
Congenital Disorders of Glycosylation ... 12
PMM2-CDG ... 13
PMM2-CDG immunological involvement ... 14
1.5.
Patient Reported Outcome Measures and Observer Resported Outcome Measures ... 14
1.6.
Introduction to the aims of this thesis ... 15
2.
Materials and Methods ... 17
2.1.
Cell culture ... 17
Isolation, cryopreservation, thawing and culture of peripheral blood mononuclear
cells
17
Culture of CRC cell lines ... 17
2.2.
Immunomagnetic separation ... 18
2.3.
Assay to test the specificity of the anti-ST6Gal-I antibody. ... 18
2.4.
Assay to test the expression of ST6Gal-I in CRC cell lines. ... 18
2.5.
Assay to test the secretion of ST6Gal-I by CRC cell lines... 19
xvi
2.7.
Immortalization of PMM2-CDG-PBMCs cells ... 19
2.8.
Flow Cytometry ... 20
SNA staining ... 20
Evaluation of PBMCs populations ... 20
Evaluation of the PBMCs’ proli
feration capacity after mitogen stimulation ... 21
2.9.
Evaluation of cytokines by enzyme-linked immunosorbent assay ... 21
2.10.
Real-Time Quantitative Polymerase Chain Reaction ... 22
Evaluation of the immortalization process ... 22
Evaluation of cytokine gene expression ... 22
2.11.
Exploratory literature review to find PROMs and ObsROMs ... 24
3.
Results and Discussion ... 25
3.1.
General introduction ... 25
3.2.
Part 1
–
CRC and ST6Gal-I ... 27
ST6Gal-I expression analysis of CRC cell lines. ... 27
Assessment of ST6Gal-I secretion by CRC cell lines. ... 30
3.3.
Part 2
–
CDG immunological assessment ... 32
PMM2-CDG-PBMCs Immortalization ... 32
Assessment of PBMCs populations ... 34
Optimization of the T cell mitogenic stimulation and proliferation ... 37
Evaluation of the PMM2-CDG mitogenic response ... 45
3.4.
Part 3
–
Exploratoty review of PROMs and ObsROMs for PMM2-CDG QoL evaluation ... 48
4.
Conclusions and Future Perspectives ... 53
5.
References ... 55
6.
Appendix ... 65
6.1.
Appendix 1: Solutions ... 65
6.2.
Appendix 2: Techniques used in this project ... 65
Flow cytometry ... 65
Real Time
–
quantitative Polymerase Chain Reaction ... 66
6.3.
Appendix 3: Search terms employed in the literature review ... 68
Patients Quality of Life ... 68
Parents Quality of Life ... 70
xvii
Index of Figures
1. Introduction ... 1
Figure 1.1 – N-glycans and O-glycans. N-glycans are linked via a N-linkage to Asn whereas O-glycans are linked via a O-linkage to Ser/Thr. Adapted from Pinho and Reis 2015.28 ... 4
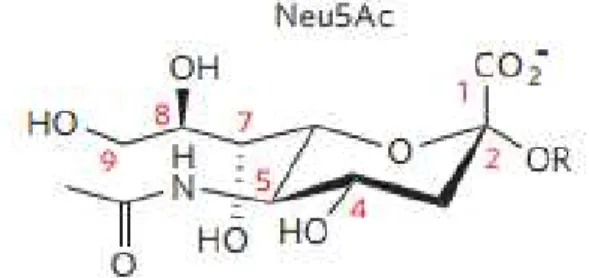
Figure 1.2 - Neu5Ac chemical structure. Adapted from Varki and Schauer 2009.49 ... 6
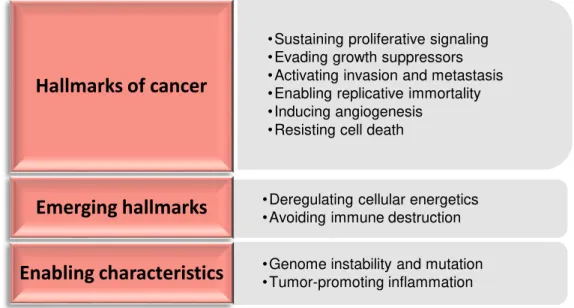
Figure 1.3 – Hallmarks, emerging hallmarks and enabling characteristics of cancer. Adapted from Hanahan and Weinberg 2011.89 ... 9
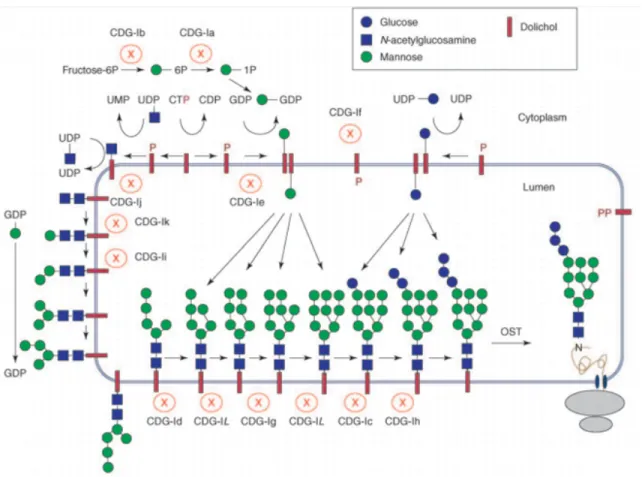
Figure 1.4 -Congenital disorders of N-glycosylation. Each CDG type arises from a mutation in a specific gene that codifies a specific enzyme of the biosynthetic pathway. The different CDGs are represented with the old nomenclature. The new nomenclature was introduced in 2009. From Jaeken et al. 2009.120 ... 13
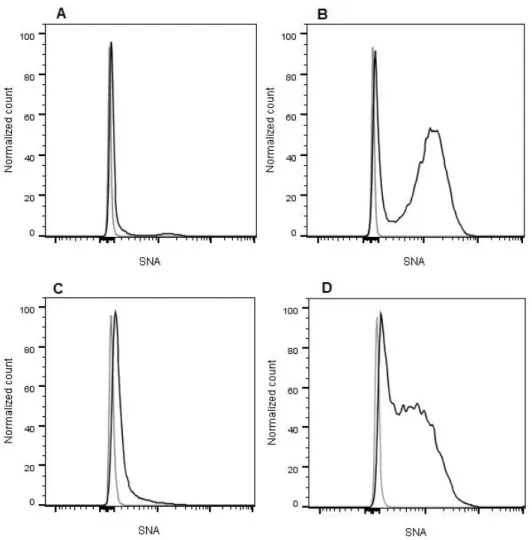
3. Results and Discussion ... 25 Figure 3.1 - α-2,6 sialylation of CRC cell lines. Flow cytometric analysis of the SNA staining of (A) SW48 NC, (B) SW48 ST6, (C) SW948 NC and (D) SW948 ST6 cell lines. In all 4 histograms, the xx axis represents the fluorescence intensity of the SNA-conjugated fluorophore and the yy axis represents the normalized event count. The grey line corresponds to the negative control (US cells) and the black line corresponds to the stained cells... 27
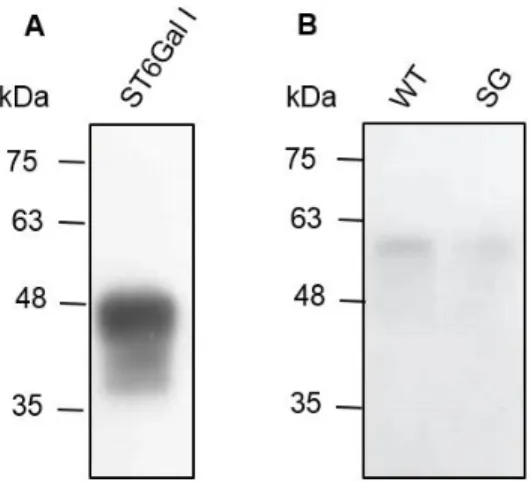
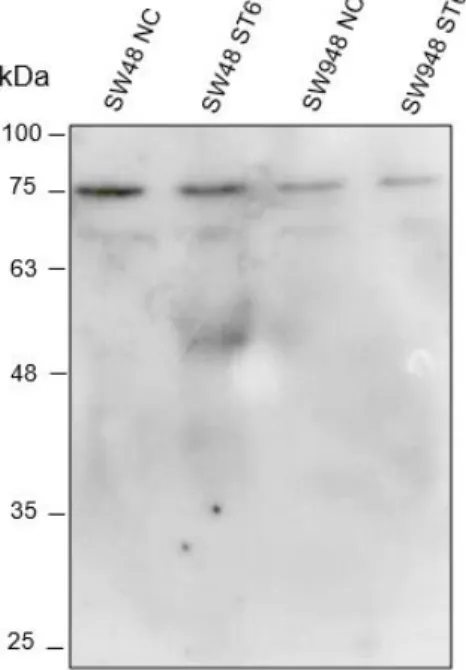
Figure 3.2 - Analysis of the anti-ST6Gal-I Ab specificity by WB. Assessment of the binding of the anti-ST6Gal-I Ab using (A) the purified enzyme ST6Gal-I and (B) WT and SG mice tissue lysates. ... 28 Figure 3.3 –ST6Gal-I expression at the protein level by CRC cell lines. Assessment by WB of the presence of ST6Gal I protein in the cell lysates of the SW48 NC, SW48 ST6, SW948 NC and SW948 ST6 cell lines using the anti-ST6Gal-I Ab. ... 29
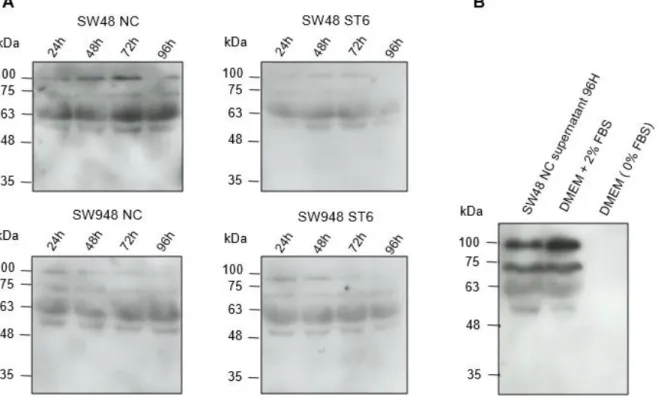
Figure 3.4 –ST6Gal-I secretion to the extracellular medium by CRC cell lines. Analysis by WB of the presence of the ST6Gal-I enzyme using the anti-ST6Gal-I Ab in (A) the supernatants of the SW48 NC, SW48 ST6, SW948 NC and SW948 ST6 cell lines at 24 H, 48 H, 72 H and 96 H and (B) the medium DMEM with 2% FBS or without FBS compared with the 96 H supernatant of the SW48 NC cell line (control). ... 30 Figure 3.5 - ST6Gal-I secretion to the extracellular medium by the SW48 NC and SW48 ST6 cell lines. Analysis by WB of the presence of ST6Gal-I using the anti-ST6Gal-I Ab in the
supernatants at 72 H. Supernatants were 12 times concentrated. ... 31
xviii
Figure 3.7 - Microscopy image of senescent PMM2-CDG-PBMCs. EBV-immortalized PMM2-CDG-PBMCs at the passage 15 after immortalization. Black arrows indicate cell aggregates. ... 33 Figure 3.8 - Blood populations analysis by flow cytometry. Assessment of (A) monocytes, (B) B lymphocytes and (C) TC and TH lymphocytes populations of the PMM2-CDG donor (left) and his healthy sibling (right). ... 35 Figure 3.9 – Mechanism of cell staining using CFSE. Once the CFSE non-fluorescent precursor CFDASE enters the cells, the acetate group is removed by intracellular esterases, exposing the succinimidyl group of the fluorescent CFSE. CFSE stays inside the cell due to its low cell
permeability where it reacts to amino groups of proteins to form CFR1 or CFR2 conjugates. CFR1 represents conjugates that have the capacity to exit the cell or are rapidly degraded and CFR2 are the conjugates that become stable inside the cells. From Quah et al. 2007.171 ... 38
Figure 3.10 – Optimization of T cell mitogenic stimulation by flow cytometry. CFSE-stained PBMCs were stimulated with 4 different combinations of PMA and Ion and the proliferation index (PI) were obtained over time. ... 39 Figure 3.11 – Optimization of T cell mitogenic stimulation by flow cytometry. CFSE-stained CD3+ cells were stimulated with 4 different cmbinations of PMA and Ion and the proliferation index (PI) was obtained over time. ... 39
Figure 3.12 - PBMCs stimulation optimization by flow cytometry. CFSE-stained PBMCs subjected to 6 combinations of PMA and Ion during 24 H (blue), 48 H (orange), 72 H (yellow) and 96 H (green), unstimulated CFSE-stained PBMCs (red) and US cells (black). ... 41 Figure 3.13 - PBMCs mitogenic stimulation optimization by flow cytometry. PBMCs’ PI over time using 6 different combinations of PMA and Ion . ... 42 Figure 3.14 – Optimization of the PBMCs CellTraceTM Far Red staining by flow cytometry. Three different gating strategies were employed, namely, PBMCs, and two different lymphocytic populations, L1 and L2 (A). CellTrace Far Red-stained cells subjected to 10 nM PMA plus 0.125 μM during 24H (blue), 48H (orange) and 72H (yellow), CFSE-stained PBMCs without stimulation (red) and unstained cells (black), gating PBMCs (B), L2 (C) or L1 (D). ... 43 Figure 3.15 – TNF-α genetic expression analysis by RT-qPCR. TNF-α relative expression of (A) (grey) unstained PBMCs, (green) CFSE stained PBMCs and (red) Far Red stained PBMCs 18 hours after staining and (B) CFSE (green) or Far Red (red) stained PBMCs 24 and 48 hours after PMA and Ion stimulation. ... 44
Figure 3.16 – PMM2-CDG cells proliferation capacity analysis by flow cytometry.0,05 μM CellTraceTM Far Red-stained PBMCs subjected to 10 nM PMA plus 0.125 μM during 24 H (green)
xix
Figure 3.17 – PMM2-CDG cells proliferation capacity analysis by flow cytometry. CellTraceTM Far Red-stained PMM2-CDG and control PBMCs were stimulated with 10 nM PMA and 0,125 Ion M during 3 days and the proliferation index (PI) were obtained over time. ... 46Figure 3.18 – IFN-γ genetic expression analysis by RT-qPCR. IFN-γ relative quantification of PMM2-CDG and control PBMCs, 24H after mitogenic stimulation. ... 47 Figure 3.19 – IFN-γ production analysis by ELISA. Quantification of IFN-γ concentration on the extracellular medium of PMM2-CDG and control cells, 72H after mitogenic stimulation... 47
Figure 3.20 –Correlation between the QoL and PMM2-CDG symptoms keywords used in the search for the PROMs and ObsROMs literature review after SQL language selection. The area of the circles is proporcional to the number of articles retrived. ... 49 Figure 3.21 – Flowchart of the articles selection for the literature review of PROMs and ObsROMs, from initial search to final included articles. ... 51 Figure 3.22 –Number of patients’ QoL assessment PROMs and ObsROMs found depending on assessed domains. ... 51
6. Appendix ... 65
xxi
Index of Tables
2. Materials and Methods
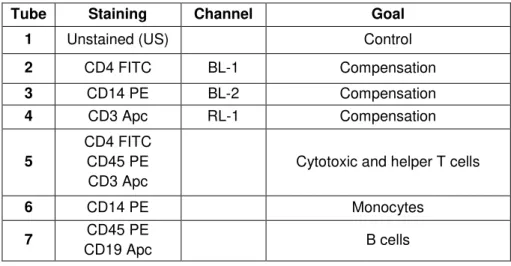
Table 2.1- Scheme of the conditions used in the flow cytometric evaluation of PBMCs populations. Legend: FITC - fluorescein isothyocyanate, PE – phycoerythrin, Apc –
allophycocyanin. ... 20 Table 2.2 - cDNA synthesis PCR program ... 23 Table 2.3 - RT-PCR reaction conditions. ... 23
3. Results and Discussion
Table 3.1 - Summary of PBMCs populations percentages of the PMM2-CDG patient and the healthy sibling. Reference values accordingly to Invitrogen cell count table.167 *percentage
regarding CD3+ population. ... 37
xxiii
List of Abbreviations
Ab(s) Antibody (antibodies) APC Antigen presenting cells
Apc Allophycocyanin APR Acute phase response APP Acute phase proteins
Asn Asparagine
ATM Ataxia telangiectasia mutated Ser/Thr kinase
BACE 1 Beta-site-amyloid precursor protein-cleaving enzyme 1 CD Cluster of differentiation
CDG Congenital Disorders of Glycosylation
CFDA-SE Carboxifluorescein diacetate succinimidil ester CFSE Carboxyfluorescein succinimidyl ester
Chk2 Checkpoint kinase 2
CMP-Sia(s) Cytidine-5’-monophospho-sialic acid(s) CRC Colorectal Cancer
CT Threshold cylcle
DAG Diacylglycerol
DAMP(s) Damage-associated molecular pattern(s) (mo-)DC(s) (monocyte-derived) Dendritic cell(s)
DDR(s) Deoxyribonucleic acid damage response(s) (c)DMEM (complete) Dulbecco’s Modified Eagle Medium
(c)DNA (complementary) Deoxyribonucleic acid EBV Epstain Barr Virus
ECM Extracellular matrix
EDTA Ethylenediaminetetraacetic acid ELISA Enzyme-linked immunosorbent assay
ER Endoplasmic reticulum FITC Fluorescein isothyocyanate
FBS Fetal bovine serum FSC-A Forward scatter - area
GADPH Glyceraldehyde 3-phosphate dehydrogenase GalNAc N-acetylgalactosamine
(Galβ1-4)GlcNAc (Galactose β1-4) N-acetylglucosamine HI High intensity
xxiv
HRP Horseradish peroxidase (HR)QoL (Health related) Quality of life
HSP(s) Heat-shock protein(s) IFN Interferon
Ig(s) Immunoglobulin(s) IL(-XR) Interleucin(-X receptor)
Ion Ionomycin
IP3 Ionositol triphosphate
LCL(s) Lyphoblastic cell line(s) LI Low intensity
MAPK Mitogen-activated protein kinase
MHC (-I /-II) Major histocompatibility complex (class I/ class II) MW Molecular weight
Neu5Ac N-acetylneuraminic acid
NFAT Nuclear factor of activated T cells NK Natural killer
ObsROM(s) Observer reported outcome measure(s) PAMPs Pathogen associated molecular patterns PBMCs Peripheral blood monocuclear cells
PBS Phosphate buffered saline PE Phycoerythrin
PI(s) Proliferation index(indexex)
PIP2 Phosphotidylinositol 4,5 bisphosphate
PKC Protein kinase C
PMA Phorbol myristate acetate PMM2 Phosphomannomutase 2
PROM(s) Patient reported outcome measure(s) PRRs Pattern recognition receptors
PVDF Polyvinylidene fluoride
RDBMS Relational database management system (m)RNA (messenger) Ribonucleic acid
(c)RPMI (complete) Roswell Park Memorial Institute medium RT Room temperature
RT-qPCR Real time quantitative polymerase chain reaction
SDS-PAGE Sodium dodecyl sulfate - polyacrylamide gel eletrophoresis Ser Serine
xxv
Sia(s) Sialic acid(s)SNA Sambucus nigra
SQL Structured Query Language ST Sialyltransferase(s)
ST3Gal β-galactoside α2,3 sialyltransferase ST6Gal β-galactoside α2,6 sialyltransferase
ST6GalNac N-acetyl-galactosamine α2,6 sialyltransferase ST8Gal α2,6 sialyltransferase
TBS-T Tris buffered saline(-tween) TC cells Cytotoxic (CD8+) T cells
TCR T cell receptor TH cells Helper (CD4+) T cells
TERT Telomerase reverse transcriptase Thr Threonine
TNF Tumor necrosis factor US Unstained
1
1. Introduction
1.1. Immune system
The immune system can be described as a set of molecules, cells and tissues responsible for conferring protection against foreign bodies to the organism. However, the immune system must have the ability to distinguish self- from non-self molecules, in order to act in a protective manner. The next topics will describe the complexity of the immunological system and its function in the protection of the organism.
Innate immune response
There are two types of immune responses that complement each other. Innate immune response is a non specific first line of attack to pathogens, whether microbes or even toxins, constituted by biological barriers (epithelia and antimicrobial agents), phagocytic cells (neutrophils, macrophages), dendritic cells (DCs), natural killer (NK) cells, among others, and also by molecules such as complement system proteins.1 The cells that are part of this kind of immunity have pattern recognition receptors (PRRs) that not only recognize moieties known as pathogen associated molecular patterns (PAMPs), but also danger-associated molecular patterns (DAMPs) derived from host cells with changes in homeostasis.2 These receptors have a broad specificity as they are able to recognize groups of pathogens with the same PAMP.1 After recognition, transcription factors like nuclear factor κB and interferon (IFN) regulatory factors are activated which triggers the expression of chemokines, cytokines, among others.3 Chemokines and cytokines (or interleucins – ILs) are secreted proteins that not only promote the recruitment and activation of immune cells which are responsible for the destruction and clearance of pathogens, but also may induce the acute phase response (APR).1,4 APR is a mechanism of the innate immune response with the aim of reestablishing homeostasis after an immune challenge and is characterized by the modulation of hepatic synthesis of a wide group of proteins. Proteins that have their concentration increased during APR are referred to as positive acute phase proteins (APP), in contrast with negative APP that have their concentration diminished.4 The innate immune response also has a main role in the activation of the adaptive immune response, as described in the next topic.
Adaptive immune response
2
3
cytokine is mainly produced by activated macrophages and lymphocytes in response to inflammatory or infectious conditions. When released, it has a chemotactic effect for the recruitment of leukocytes and promote inflammation features as the expression of endothelial adhesion molecules for leukocyte extravasation to the sites of infection, vasodilatation and expression of pro-coagulant factors.14Mitogen Stimulation
A mitogen is a polyclonal activator substance that triggers signal transduction pathways in which mitogen-activated protein kinase (MAPK) is involved, leading to cell division (mitosis) and proliferation.15 In contrast with antigens, being polyclonal activators, mitogens activate lymphocytes independently of their antigenic specificity.16 Therefore, they are often used to stimulate lymphocytes and thereby assess immune function.17,18
Activation of human T cells via surface receptors is associated with hydrolysis of membrane phosphotidylinositol 4,5 bisphosphate (PIP2), resulting in the generation of the second messengers ionositol triphosphate (IP3) and diacylglycerol (DAG). Subsequently, IP3 causes the release of Ca2+ from intracellular stores and DAG activates protein kinase C (PKC) and MAPK pathways. The increase in Ca2+ concentration is necessary for the nuclear factor of activated T cells (NFAT) signaling that controls the induction of several cytokine gene expression.19 Phorbol myristate acetate (PMA) and calcium ionophores, such as ionomycin (Ion), are mitogens widely used to assess immune function.20,21 PMA is a mitogen which diffuses through the cell membrane into the cytoplasm, where it directly activates PKC mimicking the action of surface receptor-derived DAG.22,23 Besides activating NFAT signaling, Ion triggers the hydrolisis of phosphoinositides and induces the activation of PKC.24,25 Several studies highlight the synergistic role of Ca2+ with PMA derived from the enhancement of PKC activation.21,24,26
1.2. Glycosylation
4
Figure 1.1 – N-glycans and O-glycans. N-glycans are linked via a N-linkage to Asn whereas glycans are linked via a O-linkage to Ser/Thr. Adapted from Pinho and Reis 2015.28
5
protein. This Ser/Thr-GalNac structure forms the core to longer and more complex structures. In contrast to N-glycans, O-glycans are small and non-processed structures, being the glycans constructed by single sugar transfers catalyzed by glycosyltransferase enzymes, and not by the transfer of any pre-assembled precursors36. The importance of glycosylation in biological systems is well ilustrated by the existance of several diseases that have been associated with glycosylation defects, for instance, cancer, congenital disorders of glycosylation (CDG), Alzheimer’s disease as well as Parkinson’s disease.28,37–39Glycosylation and its immunological function
It is well known that glycans play an active role in almost every aspect of immunology. In fact, surface immune receptors are glycoproteins and their glycan content dictates their biological function. For instance, T cell receptor (TCR) glycosylation has been shown to modulate functional avidity, receptor clustering and association with other cell surface proteins.40,41 Glycan-binding proteins constitute another major component of the immune system and are called lectins that include C-type lectins, Siglecs and galectins.42 The binding of glycans to lectins and Siglecs and the subsequent steric modulation of molecular interactions is involved in either innate and adaptive immune responses.43 Also, Abs and cytokines are secreted glycoproteins and glycan content can modulate their activity.44,45 Furthermore, lymphocyte development rely on glycan changes to give rise to the different subsets from the cell progenitors and leukocyte homing upon the recognition of glycans expressed in epithelial sites near infection or inflammation by selectins.46,47 Moreover, concerning pathogens, the majority of immunogens are glycans or glycoconjugates, for instance bacterial lipopolysaccharides, once more revealing the importance of carbohydrates in immunological function.42
Sialic Acids roles in the immune system
6
Figure 1.2 - Neu5Ac chemical structure. Adapted from Varki and Schauer 2009.49
Sias play an extensive list of biological roles. Their presence in secreted glycoproteins suggests that they have an important action in their stabilization, as it is the case for the secreted adiponectin from adipocytes.50 Sias electronegative charge influences the binding and transport across membranes due to attractive and repulsive forces, for instance, they can repel proteases and glycosidases preventing degradation of surface glycoproteins.51 In the immunological field, Sias have a dualistic role. They can act as masks of antigens, receptor and the glycans they are attached and subsequently avoid recognition, for instance, sialylation of the receptor β1-integrin was found to protect cancer cells against, galectin-mediated apoptosis.52,53 In contrast, they are crucial ligands for pathogenic receptors or cell surface lectins. For instance, Sias recognition by influenza virus receptors is a necessary step for infection.54 Importantly, Sias play a crucial role in cell recognition and trafficking.55,56 More emphasis will be placed on Sias’ functions in the cancer context in the topic 1.3.5.
Sialyltransferases
7
galactose β1-4 N-acetylglucosamine (Galβ1-4GlcNAc) found as a free disaccharide or as the terminus of a glycan; ST6GalNAc family contains six different subfamilies responsible for the transfer of the Sias to GalNAc through a α2,6 linkage; and finally, the last family, ST8Sia which contains also six subclasses that catalyze the transfer of Sias to other terminal Sias in a α2,8 linkage.59–61 The products from all these reactions can be experimentally recognized by specific lectins. In the context of this thesis, it is important to highlight the Sambucus nigra lectin (SNA) isolated from elderberrybark. This lectin preferentially binds to galactose-linked Sia by an α2,6 linkage (ST6Gal product) and by α2,3 linkage to a lesser degree (ST3Gal product).62 Taking into consideration the scope of this thesis, we will focus on the ST6Gal family, namely the subfamily ST6Gal-I will be further explored in the next topic.
β-galactoside α2,6-sialyltransferase 1
ST6Gal-I (E.C.2.4.99.1) is involved in the addition of α2,6-linked Sia residues to Galβ 1-4GlcNAc on N-glycans. In mammals, ST6Gal-I shows a broad tissue distribution with different patterns of expression, with a particular high expression in the liver.63 Human ST6Gal-I is localized within the Golgi complex and consists of a type II membrane protein (C-terminal oriented to the lumen) with a sequence of 406 aminoacids with two potential N-glycosylation sites.64,65 At the transcriptional level, both in normal and in cancer tissues, the single ST6Gal-I gene expression is regulated by different promoters.66 The ST6Gal-I liver expression is accomplished and dependent on the promoters P1 and P3, the first one being the main responsible for the liver ST6Gal-I transcripts. The P3 promoter is constitutive and non-specifically expressed within different tissues. Besides P3, three other promoters mediate the ST6Gal-I expression in B cells, namely, P2a, P2b and P2c. Finally, the ST6Gal-I expression in lactating mammary gland was found to be mediated by P4.67 The differential usage of promoters and alternative modes of exon splicing originate messenger ribonucleic acid (mRNA) transcripts with divergent 5’-untranslated regions.68 Three transcripts have been found so far, the Y+Z form that is thought to represent the basal expression, the hepatic form which represents the major liver transcript, and yet another B cell specific.66 The generation of ST6Gal-I-deficient mice has already shown the importance of this enzyme activity for the immune system. They have an impaired immune response in terms of B cell activation and humoral activity, alterations in thymopoiesis, granulopoiesis and in eosinophil and DC profiles.69–73 Also, some ST6Gal-I products constitute ligands for certain lectins, for instance the mature B cell surface marker CD22.74 In contrast,
α2,6 sialylation is responsible for blocking the recognition of glycans by β-galactoside-containing lectins (galectins).52
8
catalytic activity, being biologically functional. However, the soluble form recognized different asialoproteins equally in contrast to the membrane form that recognized them in a different manner, suggesting lower acceptor specificity derived from truncation of the full-length ST6Gal-I.76
Biological roles of ST6Gal-I soluble form: extrinsic glycosylation.
It is well known that glycosyltransferases, including ST6Gal-I, are present extracellularly in the bloodstream.77 However, the possibility of such enzymes to act as extracellular glycan-modifying enzymes seemed unlikely because soluble ST6Gal-I glycosylation was not efficient as it seemed that there were not enough sugar donor substrates available.78 This concept is now being revised due to recent observations. Firstly, circulatory ST6Gal-I (already known to be a positive APP, but with an unclear contribution79) was found to be a regulator of inflammatory cells production.71,80,81 Secondly,
α2,6 sialylation of bone marrow hematopoietic stem cells is mediated by extracellular ST6Gal-I as these types of cells does not express the enzyme endogenously.82 Besides, ST6Gal-I-deficient mice revealed that IgG sialylation can occur in the bloodstream in a B cell secretory pathway-independent manner.83 Importantly, platelets were shown to be efficient sources of glycosyltransferases and CMP-Sia donor substrate upon activation and capable of driving the extrinsic sialylation in vitro.84,85 More
recently, Manhardt et al. 2017 have shown that extrinsic sialylation does occur to a significant extent
in a platelet function-dependent manner, although this process is not constitutive.86 All these reports point towards an alternative pathway to generate or remodel cell surface glycans that consequently influence the function of the immune system.
1.3. Cancer
Cancer is one of the leading causes of mortality worldwide, with approximately 8 million cancer-related deaths and 14.1 million new cases in 2012.87 In 2025, it is expected that more than 20 million new cases will arise showing the major impact of cancer globally. Every cancer type arises from genetic mutations or epigenetic alterations derived from chemical (tobacco, alcohol, among others), physical (radiation) or biological (infection, chronic inflammation) carcinogenics.87 Malignant transformation is accompanied and characterized by disruption of genetic information that dictate the characteristics of a normal cell and up or downregulated expression of multiple genes that enhance tumor cells proliferation capacity and their survival, for instance, by the downregulation of genes involved in the apoptosis.88 The features of cancer will be elucidated in the point 1.3.1.
Cancer Hallmarks
9
proliferative signaling), but also are able to overcome antigrowth signals. These properties, along with the capability to evade apoptosis, confer tumor cells an unlimited replicative potential.89 This uncontrolled proliferation is sustained by an adaptation mechanism to support the altered biosynthetic requirements. In this situation, known as Warburg effect, there is an up-regulation of autophagy to provide recycled metabolic intermediate and the activation of the alternative aerobic glycolysis metabolic profile, i.e. the conversion of glucose to lactate in the presence of oxygen.90 Tumor expansion is achieved due to the angiogenic deregulation and allows tumor cells to have access to oxygen and nutrients necessary for cell growth, although the hypoxic niche of tumor growth metabolism is supported by the Warburg metabolic shift.89,90 Alterations in the expression of cell-cell adhesion molecules and integrins (responsible for cell-extracellular matrix (ECM) adhesion), as well as activation of ECM-degrading proteases are factors that enable tumor growth and metastatic capability. Besides, there are two emerging hallmarks that might be included referring to the capabilities of deregulating cellular energetics and evading immune response. Besides, genome instability and tumor-promoting inflammation are considered two enabling characteristics that allows the acquisition of all these hallmarks.89Cancer evasion of the immune response
The immune system (already depicted in the topic 1.1) has three important roles in the prevention of cancer. Firstly, as previously mentioned, immune cells can eliminate viral infections that can induce virus-induced tumors. Secondly, the destruction of pathogens and resolution of the inflammatory state will prevent tumors promoted by an inflammatory microenvironment. Finally, the
•Sustaining proliferative signaling •Evading growth suppressors •Activating invasion and metastasis •Enabling replicative immortality •Inducing angiogenesis
•Resisting cell death
Hallmarks of cancer
•Deregulating cellular energetics •Avoiding immune destruction
Emerging hallmarks
•Genome instability and mutation •Tumor-promoting inflammation
Enabling characteristics
10
immunological system can identify tumor-specific antigens or stress-induced molecules and proceed with tumor cells elimination (tumor immune surveillance).91 However, tumors are still capable of developing in spite of the existence of this protective mechanism in immunocompetent individuals. Cancer cells mediate the production of chemokines that recruit CD4+FOXP3+CD25+ T cells (also known as regulatory or suppressive T cells) with an enhanced suppressive activity to downregulate the induction or proliferation of TC cells to the tumor microenvironment.92 Other cytokines/chemokines/factors present in the tumor microenvironment can act themselves as suppressive factors or even promote cancer growth and progression. Cancer cells use downregulation of the antigen presentation machinery, including MHC-I, decreasing the expression of tumor antigens and thus escaping recognition and elimination by the TC cells. Tumor cells also have the advantage to fail to express costimulatory molecules and to downregulate death receptors, which induce anergy or tolerance in T cells and prevents death-ligand-mediated cell killing.93 Besides, they are capable of deviating the immune response from TH1 to TH2, a state that has been proposed to facilitate tumor growth.93,94 Also, there is evidence that tumor cells can eliminate tumor-specific TC cells through apoptosis.93 Finnaly, the glycosylation also play a important role in cancer immune evasion being the aberrantly high expression of Sia in tumor cells’ surface (topic 1.3.3) envolved in antigen masking and prevention of recognition by the immune system.95
Glycosylation and Cancer
11
Colorectal cancerColorectal cancer (CRC) is a major cancer burden being the third type of cancer with more incidence (9.7%) and the fourth responsible for more cancer-related mortality (8.5%), globally.87 This type of cancer may rise from different causes, namely, genetic heritage, dietary composition or even environmental factors.87 The development of this type of cancer was proposed to be multi-stepwise by Fearon and Vogelstein 1990 and rely on mechanisms that involve chromosomal instability, microsatellite instability, aberrant deoxyribonucleic acid (DNA) methylation and DNA repair defects.101,102 It starts with the accumulation of a set of mutations in the normal colon that creates an hyperproliferative benign adenoma. These mutations affect for instance the RAS gene and cause the
inactivation of the tumor suppressor gene, considering adenomatous polyposis coli. The evolution to a malign carcinoma is related to events like mutations in p53 and gain of the chromosome 8q. The development of the CRC metastatic capacity occurs in 10 years, due to the acquisition of another set of genetic and epigenetic mutations in specific oncogenes and/or tumor suppressor genes as well as the loss of chromosome 8q.102 The disease heterogeneity at the molecular level of CRC defining aggressiveness and therapy resistance, as well as the different clinical presentation depending on the tumor site show the dangerousness of this type of cancer.102 Treatment of CRC is typically limited to surgical resection with the possibility of adjuvant chemo or radiotherapy conjugation, however, there is still a high risk of metastasis with a low survival rate due to failure of treatment response.103 CRC tissue or cells have pronounced differences in glycosylation compared to normal cells, specifically in N-glycans, O-glycans, glycosphingolipids, fucosylation, sialylation and Lewis antigens patterns, that influence tumorigenesis, metastasis, anti-tumor immunity and resistance to therapy.104
In the context of this thesis, more emphasis will be placed in the altered α2,6 sialylation derived from the activity of ST6Gal-I (topic 1.3.5).
ST6Gal-I and CRC
12
or substrates whose expression is different from tissue to tissue and even cell line to cell line from the same type of tumor.99 Besides cell migration and invasion, ST6Gal-I may also play a pivotal role in cell death evasion by preventing Fas or TNF-α-mediated apoptosis.110,111 More recently, it was suggested that ST6Gal-I promote tumorigenesis and can act as a cell marker and regulator of cancer stem cells, i.e., cells capable of give rise to different types of cells within the tumor.105 Regarding soluble ST6Gal-I, higher levels of this form in the bloodstream have been correlated with progression and metastasis of CRC, however the possible usage of this enzyme as a biomarker and its biological function in the cancer context remains elusive.112
1.4. Congenital Disorders of Glycosylation
13
Figure 1.4 -Congenital disorders of N-glycosylation. Each CDG type arises from a mutation in a specific gene that codifies a specific enzyme of the biosynthetic pathway. The different CDGs are represented with the old nomenclature. The new nomenclature was introduced in 2009. From Jaeken et al. 2009.120
PMM2-CDG
PMM2-CDG (previously known as CDG Ia) is the most frequent type of CDG and is derived from mutations in the PMM2 gene that codifies the phosphomannomutase 2 (PMM2) enzyme (EC
14
PMM2-CDG immunological involvement
Contrasting to other types of CDG, PMM2-CDG has a minor immunological involvement since only a small set of patients have been reported with immunological issues.118 However, the mechanisms underlying immunological affectation are yet not well understood. Recurrent and severe infections and fever-triggered stroke-like episodes are the main immune symptoms, whereas the first has been found to affect PMM2-CDG patients throughout childhood and to disappear during adult life.124 Several pathogens have been identified in the origin of these infections, namely Pneumocystis carinii125, Streptococcus pyogenes126, Pseudomonas, RSV, Influenza pneumonia, E. Coli, S. viridans and, in same case, vaccination of patients was found to be ineffective or to elicit illness127. Although hypogammaglobulinemia has been found to occur in some patients, no correlation was found between low immunoglobulin levels and infections in 15 PMM2-CDG patients.128 The recruitment of neutrophils in response to a stimuli (chemiotaxis) was also found to be decreased in few cases.127 Blood levels of certain cytokines were found altered in certain conditions showing an altered inflammatory response, maybe due to an overload of underglycosylated proteins in the ER.129 Other rare clinical presentations were also reported, namely thrombocytopenia and hyperferritemia in the absence of an infection and with an unexplained macrophage activation.130 Blood proteins and cell surface glycoproteins related with the immune response were also found to be decreased or altered in terms of mass/charge or α2,6 sialylation.118
15
1.6. Introduction to the aims of this thesisGlycosylation is known to be crucial in many biological processes and altered glycosylation is related with many diseases influencing phenotypic maniphestations.37 Regarding the immunological system, glycosylation is essential for events like cellular recognition, signaling, lymphocyte development and lymphocyte homing.40,42–47
Recent studies are highlighting the immunomodulatory role of cell surface Sias. Indeed, observations from our group suggested that sialidase treatment on human monocyte-derived DCs (moDCs) increase the expression of maturation markers, their genetic expression of pro-inflammatory cytokines and the priming and activation of T lymphocytes. This increase in functionality was attributed to α2,6 sialic acid removal, as shown by the analysis of ST6Gal-I-/- mice DCs.137 A number of STs are in the origin of cell surface sialylation. Specifically, the α2,6 sialylation is catalyzed by the ST6Gal and the ST6GalNAc families that differ in terms of their Sias acceptor specificity, galactose and GalNAc, respectively.59 Regarding ST6Gal-I, besides its membrane-bound form, this enzyme presents a cleaved biologically functional secreted form, which points towards an alternative pathway of extrinsic glycosylation that is able to modulate the cell surface glycosylation.75,76,80,84,85 Our group is part of a consortium with 15 European partners in the fields of glycobiology, glycoimmunology and biomarker research that aims to understand the structure-function relationship of glycans in CRC for finding improved diagnostic and prognostic biomarkers, and pave the way for novel therapeutic targets. Thus, a part of this master project aims to explore the aberrant glycosylation of CRC cells and its implications in the immune system, contributing to the ultimate goal of the consortium. CRC has been found to upregulate the expression and activity of ST6Gal-I and subsequently increase the levels of α2,6 sialylation, which influences malignancy in terms of invasive and metastatic potencial.138 Therefore, we hypothesized that CRC cells possibly secret ST6Gal-I and this enzyme can modify the extrinsic glycosylation of immune cells and modulate their immune function.
16
PMM2-CDG is a very debilitating condition and have a profound negative impact in patients’ and caregivers’ QoL, especially due to lack of treatment, lack of care guidelines and the disease heterogeneity.134 This reality made us get envolved in the working group of CDG & Patient Reported Outcomes dedicated to understand CDG symptoms, the family experience and the impacts of this illness. Since the increased efforts to find curative treatment for CDG are now highlighting the necessity of specific patient reported outcomes assessment tools to evaluate the QoL as a primary endpoint in clinical trials, to find, adapt and/or validate suitable existing PROMs or ObsROMs would fulfill the existing gap and facilitate clinical outcome assessments.
17
2. Materials and Methods
2.1. Cell culture
Isolation, cryopreservation, thawing and culture of peripheral blood mononuclear cells
Peripheral blood mononuclear cells (PBMCs) for optimization studies were isolated from buffy-coats of male healthy volunteers between 18 and 60 years old, provided and ethically approved by the Portuguese Blood Institute. The blood samples from the 35 years old PMM2-CDG patient donor enrolled in this study and the corresponding 39 years old healthy sibling (control without mutations in the PMM2 gene) were donated with consent for experimental purposes. PBMCs were
isolated by density gradient centrifugation using Biocoll (Merck Millipore). 30 mL of buffy-coat was centrifuged at 1100 g, for 10 minutes, at room temperature (RT), without brake, and the PBMCs as well as the plasma were collected to a 50 mL falcon to which phosphate buffered saline (PBS) (Appendix 1) was added up to 40 mL. After mixing, the cell suspension was divided and slowly added to 12 mL of Biocoll at RT, and centrifuged at 1100 g for 30 minutes, without brake. The interface ring was collected to a new tube, diluted with PBS up to 40 mL and the cell suspension was centrifuged at 1100 g for 10 minutes at RT. The supernatant was discarded and the pellet resuspended in 10 mL of PBS. Cells were counted under the optic microscope using a Neubauer chamber. The cell suspension was centrifuged at 400 g for 10 minutes at RT for platelet removal. The PBMCs were frozen at -80º in Roswell Park Memorial Institute medium (RPMI) supplemented with 10% (v/v) Fetal Bovine Serum (FBS), 1% (v/v) penicillin/streptomycin, 1% (v/v) glutamine, 1% (v/v) non-essential aminoacids and 1% (v/v) sodium pyruvate (complete RPMI – cRPMI), as well as 10% dimethyl sulfoxide. When thawed, PBMCs were cultured in cRPMI in an incubator at 37ºC with a humidified atmosphere and 5% CO2, except in the first 18 H in which they were maintained in cRPMI with 20% FBS before any other procedure. Both RPMI and supplements were from Gibco®, Life Technologies.
Culture of CRC cell lines
trypsin-18
ethylenediaminetetraacetic acid (EDTA) (Gibco®, Life Technologies) for 5-10 minutes, followed by the addition of 3 times the volume of trypsin of pre-warmed medium and a centrifugation at 200 g, during 5 minutes at RT.
2.2. Immunomagnetic separation
In order to isolate CD3+ cells, thawed PBMCs were centrifuged and resuspended in 80 µL of beads buffer (Appendix 1) and 20 µL of CD3 magnetic microbeads (Miltenyi Biotec) for each 3x10⁷ cells. After incubating for 30 minutes at 4ºC, cells were washed with beads buffer and centrifuged at 900 g for 10 minutes at RT. The pellet was resuspended in 2 mL of beads buffer and added to a LS column assembled to a MidiMACS Separator in a MACS Multistand (Miltenyi Biotec), previously activated with 3 mL of beads buffer. After the column was washed three times with 3 mL of beads buffer, the column was removed from the action of the magnetic field, and the positive fraction was eluted using a plunger. The CD3+ cells were counted and cultured in cRPMI until further use.
2.3. Assay to test the specificity of the anti-ST6Gal-I antibody.
To test the specificity of the anti-ST6Gal-I Ab, purified ST6Gal-I (a kind gift from Joseph Lau) was used. To obtain lysates, tissues from ST6Gal-Ideficient(SG)69 ant wild type (WT) mice (obtained from Consortium for Functional Glycomics) were defrosted and washed with PBS to remove the excess of blood. After cutting the tissue in small pieces using a scalpel as quickly as possible to prevent degradation by proteases, ~300 μL of ice cold IP Lysis/Wash Buffer (Thermo Scientific) complemented with protease inhibitors (Roche) per ~3 mg of tissue was added and homogenized. The pellet pestle (Sigma-Aldrich) was rinsed with another volume of lysis buffer and the suspension was incubated during 20-30 minutes with periodic vortexing every 5 minutes. A centrifugation at 17000 g during 20 minutes at 4ºC was preformed to remove cell debris, the protein concentration of the supernatant was quantified using the Pierce BCA Protein Assay Kit (Thermo Scientific) following manufacturer instructions, and the supernatant was saved at -80ºC until further use. The specificity for ST6Gal-I was assessed using the Sodium Dodecyl Sulfate-Polyacrylamide Gel Eletrophoresis (SDS-PAGE) and Western Blot (WB) techniques as described in the point 2.6.
2.4. Assay to test the expression of ST6Gal-I in CRC cell lines.
19
2.5. Assay to test the secretion of ST6Gal-I by CRC cell lines.Two different protocols were attempted to assess ST6Gal-I secretion. In the first one, cells were cultivated in cDMEM with 2% FBS with a cell density of 1×10⁶ cells/mL and supernatants were recovered after 24 H, 48 H, 72 H and 96 H. In the second one, cells were cultured in cDMEM + 10% FBS with a cell density of 1×10⁶ cells/mL. When confluency was achieved, the medium was changed to cDMEM without serum. Supernatants were recovered after 24H, 48H and 72H. A 12 times concentration of the supernatants was done using Amicons Ultra 0.5 mL centrifugal filter devices (Merck Millipore) by a centrifugation at 14000 g during 10 minutes at RT. The presence of ST6Gal-I in the supernatants was assessed using the SDS-PAGE and WB techniques as described in the point 2.6.
2.6. SDS-PAGE and WB
SDS-PAGE and WB were performed to test the Ab specificity used in this study (point 2.3.) and to test the presence of ST6Gal-I whether in cell lysates (point 2.4.) or in supernatants (point 2.5.). Samples were loaded in 4% stacking (Appendix 1) and 12% resolving gel (Appendix 1) and the electrophoretic run was performed in running buffer (Appendix 1) at 80V-100 V for 30 minutes, and at 150 V until the end of the run. The proteins transfer into a polyvinylidene fluoride (PVDF) membrane was performed in transfer buffer (Appendix 1) at 400 mA for 1 H and the membrane was blocked with a 5% non-fat milk powder (VWR®) diluted in tris buffered saline with 0.1% Tween-20 (TBS-T 0,1%) during 1 H at RT. Then, the membrane was probed with 10 µg/mL of anti-ST6Gal-I Ab diluted in TBS-T 0,1% (Appendix 1) overnight at 4ºC. After washing with TBS-TBS-TBS-T 0,1%, a horseradish peroxidase (HRP) goat anti-mouse Ig Ab (BD PahrmingenTM) at a 1:2500 dilution in TBS-T 0,1% was added and incubated at RT for 1 H. After washing, detection was performed using Lumi-Light Western Blotting Substrate (Roche), mixing the two reagents in a 1:1 proportion and incubating the membrane during 1 minute at RT. Finally, revelation was achieved exposing the membrane to Amersham Hyperfilm ECL (GE Healthcare Life Sciences) using Corestream® Kodac® autoradiography GBX developer/replenisher and Corestream® Kodac® autoradiography GBX fixer/replenisher (Sigma).
2.7. Immortalization of PMM2-CDG-PBMCs cells
20
containing medium was replaced every 3-4 days using the same antibiotic concentration. 10‐15 days after selection, clones were picked for expansion and positive ones were screened. Morphology was assessed with optical microscopy.
2.8. Flow Cytometry
Flow cytometry is a technique that allows a multi-parameter analysis of single cells in a suspension (more information in Appendix 2, topic 6.2.1.). This technique was employed in this work to evaluate α2,6 sialylation (point 2.8.1.), PBMCs populations (2.8.2.) and to assess cell proliferation (2.8.3.), using the Attune® Acoustic Focusing Cytometer (Applied Biosystems).
SNA staining
To evaluate the differences of cell surface content in α2,6 sialylation, SW48 NC, SW48 ST6, SW948 NC and SW948 ST6 were pelleted by centrifugation at 300g, during 5 minutes at RT and resuspended in 500 µL FBS-containing medium. The cells were stained with 2 μL of fluorescein isothyocyanate (FITC)-conjugated SNA lectin for 5-10 minutes on ice. Then, cells were diluted in PBS 1x and centrifuged in the same condition as before. The cells were analyzed right away after resuspended in 300 µL of PBS and at least 10000 events were acquired.
Evaluation of PBMCs populations
Before cryopreservation, PMM2-CDG and control cells were stained with several Abs according to Table 2.1 to access for cell surface markers. To each tube containing 100000 cells in 100 µL of PBS, 3 µL of each Ab were incubated on ice during 15 minutes in the dark. The cells were washed with 1 mL of PBS, centrifuged at 200 g during 5 min at 4ºC and the pellet was resuspended in 500 µl of PBS. The cells were analyzed right away and at least 10000 events were acquired.
Table 2.1- Scheme of the conditions used in the flow cytometric evaluation of PBMCs populations. Legend: FITC - fluorescein isothyocyanate, PE – phycoerythrin, Apc – allophycocyanin.
Tube Staining Channel Goal
1 Unstained (US) Control
2 CD4 FITC BL-1 Compensation
3 CD14 PE BL-2 Compensation
4 CD3 Apc RL-1 Compensation
5
CD4 FITC CD45 PE
CD3 Apc
Cytotoxic and helper T cells
6 CD14 PE Monocytes
21
Evaluation of the PBMCs’ proliferation capacity after mitogen stimulationTo study cells proliferative capacity, two different CellTraceTM Cell Proliferation Kits (InvitrogenTM, Life Technologies) were used. All optimization steps were performed with cryopreserved cells with at least one year old. 24 H after thawing, the cells were centrifuged at 300 g during 5 minutes at RT (the following steps of centrifugation were performed in the same conditions) and resuspended in PBS. After centrifuging, cells were counted and the necessary number of cells were resuspended in 2 mL of PBS and a 0.2 μM CellTraceTM carboxyfluorescein succinimidyl ester (CFSE) solution was added in a 1:1 proportion, slowly and directly into the tube walls, for a final concentration of 0.1 μM. After gently mixing, the suspension was incubated during 10 minutes at 37ºC in the dark. To remove the free dye in solution, 10 mL of pre-warmed PBS with 2% FBS were added and incubated for 5 minutes at 37ºC, in the dark. After centrifugation, the cells were resuspended and cultured in pre-warmed cRPMI media and incubated for 18 H before any other procedure to allow acetate hydrolysis to occur. Once CFSE was found to affect cell viability, CellTraceTM Far Red Cell Proliferation Kit (InvitrogenTM, Life Technologies), with lower cell toxicity at working concentrations, was used following the same experimental conditions, except for CellTraceTM Far Red reagent concentration. Two different concentrations of this reagent were tried: specifically, the recommended concentration 1 μM and 0.05 μM. Labeled PBMCs at a concentration of 1x10⁶ cells/mL were stimulated with several combinations of phorbol 12-myristate 13-acetate (Sigma) and Ion (Sigma) and cultured in a 96-well round bottom plate (Costar). PMA concentrations were limited to 20 nM, 10 nM or 1 nM and Ion concentrations varied between 1 µM, 0,5 µM, 0,25 µM and 0,125 µM. The medium was supplemented with human IL-2 (Miltenyi Biotec) at a final concentration of 1 ng/mL to provide T cell survival signals. Cells were collected after 1, 2 and 3 days. Cell fluorescence was collected and the data were analyzed using Attune cytometric software and ModFit LT 3.2 software (Verity Software House, Topsam, ME), allowing to assess the cell proliferation index, which represents the average number of cells that were originated from a single cell of parental generation. The parental generation was set based on the analysis of data obtained from the cells maintained 18 H in culture after staining.
2.9. Evaluation of cytokines by enzyme-linked immunosorbent assay
22
standard and sample were added to their respective wells in duplicate and incubated at RT for 2 H. The plate was washed five times using 200 µL of washing buffer (Appendix 1). 50 µL of biotinylated detector Ab, previously diluted 1:1000 in blocking buffer, were added to each well and incubated for 30 minutes at RT. After another series of five washing steps, 50 µL of TMB substrate at RT were added to each well and the plate was incubated for at least 30 minutes in the dark until optimal color development. The reaction was stopped with 25 µL of 4M HCl and the optical density was read at 450 nm on a SpectraMax 190 Microplate Reader (Molecular Devices) and the data were acquired using the SoftMax Pro software (version 6.4.). The results were analyzed using Microsoft Excel and GraphPad Prism (version 6).
2.10. Real-Time Quantitative Polymerase Chain Reaction
Real-Time Quantitative Polymerase Chain Reaction (RT-qPCR) is an alternative to the conventional PCR technique that allows the quantification of the amplified nucleic acid as the reaction occurs (more information in the Appendix 2, topic 6.2.2.). In this project, RT-qPCR was used to evaluate the efficiency of the PMM2-CDG-PBMCs immortalization (topic 2.10.1.) and to measure cytokine genetic expression (2.10.2.)
Evaluation of the immortalization process
The analysis of the immortalization process was performed by ABM services. RNA was extracted from EBV-PBMCs using TRIzol reagent and cDNA was synthesized by reverse transcription. For the RT-qPCR reaction, specific EBV primers were mixed with 1 µL of 0.1 µg/µL of cDNA template. The EBV forward and reverse primers sequences consisted in 5’ AAA CCT CAG GAC CTA CGC TGC and 5’AGA CAC CGT CCT CAC CAC, respectively. In this experiment, the SYBR Green technology was used, resorting to the Step OneTM Real-Time PCR instrument with a ROX passive reference dye. This inert dye is used to normalize the variations between wells due to pipetting errors or even instrument limitations.
Evaluation of cytokine gene expression
23
centrifugation. The DNAse I solution was prepared by mixing DNAse I with digestion buffer in a 1:8 proportion and 80 µL of this solution were added to each column. After incubation for 15 minutes at RT, the columns were washed once with 250 µL of washing solution 1 and twice with 500 µL of washing solution 2 by centrifugation. The remaining ethanol was removed by centrifugation of the column without any volume. The column was placed into a clean collection tube and RNA was eluted with 55 µL of elution solution by centrifugation. The flow-through was collected, added again to the binding column and centrifuged to elute the remaining RNA. The eluted and purified RNA was immediately converted into cDNA.The conversion of RNA to DNA was performed resorting to the High-Capacity cDNA Transcription Kit (Applied Biosystems) on the basis that random primers will bind to the RNA allowing the reverse transcriptase enzyme to execute the transcription. 50 µL of each sample of purified RNA were added to a PCR tube (VWR). 50 µL of a mix with the necessary reagents for the conversion was added to each tube. This mix was constituted by 10 µL of buffer 10x, 10 µL of random primers 10x, 4 µL of 100 mM deoxynucleoside triphosphates (dNTPs), 7,5 µL of reverse transcriptase and 18,5 µl of water molecular biology (NZYTech) for sample. RNA conversion was achieved using the program described in Table 2.2, on a Programmable Thermal Controller PTC-100TM (MJ Research), and cDNA were stored at -20ºC.
Table 2.2 - cDNA synthesis PCR program
Step 1 Step 2 Step 3 Step 4
Temperature (ºC) 25 37 85 4
Time 10 min 120 min 5 sec ∞
For the RT-qPCR, TaqMan chemistry was used. The reaction was carried out in 0,1 mL PCR tubes (Simport) in a total volume of 10 µL. The reactions were prepared in duplicate by adding 3 µL of cDNA, 5 µL of TaqMan Fast Universal PCR Master Mix 2x and 2 µL of probe (Applied Biosystems). The probes included β-actin and glyceraldehyde 3-phosphate dehydrogenase (GADPH) as the endogenous controls, TNF-α and IFN-γ. For this experiment, Rotor-Gene 6000 Series (Corbett) with the conditions described in Table 2.3 were used.
Table 2.3 - RT-PCR reaction conditions.
Cycle 1 40-50 cycles
Temperature (ºC) 95 95 60