Repositório ISCTE-IUL
Deposited in Repositório ISCTE-IUL:
2020-03-05
Deposited version:
Post-print
Peer-review status of attached file:
Peer-reviewed
Citation for published item:
Bassi, F. & Dias, J. G. (2019). The use of circular economy practices in SMEs across the EU. Resources, Conservation and Recycling. 146, 523-533
Further information on publisher's website:
10.1016/j.resconrec.2019.03.019
Publisher's copyright statement:
This is the peer reviewed version of the following article: Bassi, F. & Dias, J. G. (2019). The use of circular economy practices in SMEs across the EU. Resources, Conservation and Recycling. 146, 523-533, which has been published in final form at https://dx.doi.org/10.1016/j.resconrec.2019.03.019. This article may be used for non-commercial purposes in accordance with the Publisher's Terms and Conditions for self-archiving.
Use policy
Creative Commons CC BY 4.0
The full-text may be used and/or reproduced, and given to third parties in any format or medium, without prior permission or charge, for personal research or study, educational, or not-for-profit purposes provided that:
• a full bibliographic reference is made to the original source • a link is made to the metadata record in the Repository • the full-text is not changed in any way
The full-text must not be sold in any format or medium without the formal permission of the copyright holders.
Serviços de Informação e Documentação, Instituto Universitário de Lisboa (ISCTE-IUL) Av. das Forças Armadas, Edifício II, 1649-026 Lisboa Portugal
Phone: +(351) 217 903 024 | e-mail: [email protected] https://repositorio.iscte-iul.pt
1
The use of circular economy practices in SMEs across the EU 1
2
Abstract 3
This study explores the circular economy (CE) practices of Small and Medium Enterprises (SMEs) in 4
the 28 European Union (EU) member states. Five measures of CE are studied, namely Re-planning 5
the way water is used to minimize usage and maximize re-usage, Using renewable energy, Re-6
planning energy usage to minimize consumption, Minimizing waste by recycling or reusing waste or 7
selling it to another firm, and Redesigning products and services to minimize the use of materials or 8
using recycled materials. Multilevel ordinal probit models that control within- and between-9
variability across European Union countries are estimated. Results show that CE measures across EU 10
countries are very heterogeneous. At the firm level, we find that firm size (number of employees and 11
total turnover in 2015) and percentage of firms’ turnover invested in R&D in 2015 are significant in 12
explaining within-country variations. The multilevel structure (between-country variability) accounts 13
for 6.1% to 15.1% of the total variability of CE measures. These results have implications for the 14
design of framework policies at EU level given that the firms surveyed are SMEs, the segment in 15
which these CE measures most need improved planning and implementation. 16
17
Keywords: Circular economy, small and medium-sized enterprises (SMEs), cross-cultural research, 18
multilevel modeling, European Union. 19
2 1 Introduction
21
The concept of the circular economy (CE) was introduced at the end of the last century; since the 22
first scientific papers on the topic were published in the 1980s, it has received increasing attention 23
from scholars (Lieder and Rashid, 2016). Although this vast literature offers many definitions of the 24
circular economy, the key concept refers to harmonizing economic growth and environmental 25
protection. A popular definition of the circular economy takes advantage of the easy-to-remember 26
3Rs: reduction, reusing, and recycling, and it describes the practical approach to the concept (see, 27
for example, Liu et al., 2017). The Ellen MacArthur Foundation (2015) proposes a more 28
comprehensive definition that includes environmental and economic advantages, according to which 29
the circular economy is “an industrial economy that is restorative or regenerative by intention and 30
design”. This recent definition incorporates the idea of ensuring the safe entry of bio-nutrients in the 31
biological sphere. Another important notion in this context is the difference between the circular 32
economy and the linear production system: whereas the linear system perceives end-of-life products 33
as waste, the circular economy sees them as resources, and this also has an impact on the 34
environment, on resource scarcity, and on economic benefits. Other papers (e.g., Kopnina, 2018) 35
underline the difference between CE and other paradigms of sustainability, like the quite popular 36
cradle-to-cradle (C2C) developed by McDonough and Braungart (2002). As its name suggests, the 37
aim of C2C is to return raw materials that have been taken from nature back to nature. C2C goes 38
beyond the 3Rs principle by recognizing that although the 3Rs are a way of limiting environmental 39
damage, they do not eliminate waste. 40
The circular economy was formally adopted in 2002 by the Central Government of China as a new 41
development strategy to protect the environment and limit the production of pollution. This led to 42
many scientific publications on both theoretical aspects of CE and its practical implementations for 43
China and/or works authored by Chinese researchers. However, the roots of the topic are in Europe; 44
the concept stems from the 1976 report to the European Commission by Stahel and Reday (1976), 45
with another important contribution coming from the two British environmental economists Pearce 46
and Turner (1990). Indeed, the concept has become increasingly accepted in the various regions of 47
the developed world. In 2014, the European Commission (the body responsible for proposing new 48
EU legislation) published its 2015 Circular Economy Package with the stated objective of “closing the 49
loop” of product lifecycles (European Commission, 2014, 2015). In particular, the guidelines state 50
that products should be redesigned so that they are easy to maintain, repair, remanufacture or 51
recycle, which is another way of describing the 3R principle. Hughes (2017) provides an overview of 52
this package. Forerunner countries such as Finland, the Netherlands, and the UK have adopted and 53
applied national-level policies explicitly framed as circular (Repo et al., 2018). Stahel (2016) reports 54
3
that a study of seven European nations found that a shift to a circular economy would reduce each 55
nation’s greenhouse-gas emissions by up to 70% and grow its workforce by about 4% — the ultimate 56
low-carbon economy. Nevertheless, implementing the circular economy is a challenging task given 57
the prevalence of a linear mindset in industry and society. According to various researchers, it is 58
easier to see environmental benefits than economic benefits. Implementing circular economy 59
practices often entails industries making extra investments that might not be considered profitable 60
(Dalhammar, 2016). It is generally believed that policy initiatives favoring the circular economy are 61
required worldwide. In Europe, the current rules do little to foster this market development 62
(Dalhammar, 2016). 63
It is recognized that the choices of firms and people on production and consumption styles are all 64
vital for sustainable development and consumers also need to embrace CE. As a result, many papers 65
have analyzed the profiles of the so-called green consumers and their behavior regarding household 66
waste reduction, reuse, recycling, green purchasing and focusing on different parts of the world: UK 67
(McDonald and Oates, 2003), Sweden (Jansson et al., 2010), Japan (Hanyu et al., 2000), and China 68
(Huang et al., 2006). On the other hand, published research on firms addresses specific economic 69
sectors (e.g. Ge and Jackson (2014) refer to the automotive sector) or geographical areas (e.g. 70
Dalhammar (2016) for Scandinavia). The circular economy has developed mainly in big industries 71
and has not spread sufficiently to SMEs (Ormazabal et al., 2018). 72
Small and medium-sized enterprises (SMEs) represent 99% of all businesses in the EU1 varying from
73
99.5% (Germany and Luxembourg) to 99.9% (France)2. Between 2002 and 2010, the SMEs in EU had
74
a much higher employment growth rate (1% annually) than the large enterprises (0.5%)3; and in
75
recent years, they have created most of the new jobs. Not only are they a very big group, but they 76
also contribute to a large share of the overall pollution (ECEI, 2010). Nevertheless, specific research 77
on CE practices in the SME segment is scarce. This paper focuses on the use of circular economy 78
practices in the European Union (EU) by SMEs; specifically, it analyzes the activities of European 79
SMEs with regard to the circular economy. The European Union funds many projects fostering CE 80
practices in SMEs (https://www.clustercollaboration.eu/). Some recent literature focuses in 81
particular on the topic of barriers and enablers of implementing the circular economy by small and 82
medium-size firms (see, for example, Rizos et al., 2016). 83
1 Small and medium-sized enterprises (SMEs) are defined in the EU recommendation 2003/361
(http://data.europa.eu/eli/reco/2003/361/oj). It means less than 250 employees, or ≤50m€ turnover, or ≤ 43m€ balance sheet total.
2 Eurostat (http://appsso.eurostat.ec.europa.eu/nui/show.do?dataset=sbs_sc_sca_r2&lang=en) (accessed
on 26.08.2018).
3 Eurostat (http://europa.eu/rapid/press-release_MEMO-12-11_en.htm?locale=en) (accessed on
4
Schaltegger and Wagner (2011) studies the conditions under which sustainability innovation 84
emerges spontaneously in companies. They identify, for example, industry life cycle as a crucial 85
factor. del Rio Gonzàles (2005) identifies factors external and internal to the firm that stimulate the 86
adoption and diffusion of clean technology; while external factors relate mainly to regulations, 87
internal factors involve employees, organizational culture, brand image and reputation, competitive 88
advantage and strategic intent, and environmental management capacities. It is important to 89
understand that SMEs are not smaller versions of their larger counterparts (Welsh and White, 1981). 90
Most of these internal conditions are influenced by a more difficult separation between decision 91
making and management and the ownership of the capital. Firm size is particularly relevant as 92
medium-sized organizations, both in terms of the number of employees and turnover, are more 93
engaged in CE practices (Hoogendoorn et al., 2015). Another important factor is the type of market 94
being served. Hoogendoorn et al. (2015) show that SMEs selling directly to consumers are just as 95
likely to engage in greening processes as those selling to other companies. Finally, the firm’s age has 96
also been researched as an influencer of the firm’s engagement in CE practices. Neubaum et al. 97
(2004) conclude that scarcity of resources and concern about survival may have a negative influence, 98
whereas Hockerts and Wüstenhagen (2010) show the opposite relation. On the other hand, 99
Hoogendoorn et al. (2015) found that age did not have any influence on environmental practices. 100
This research aims to assess the firm factors that can influence CE practices in all sectors of the EU’s 101
SMEs. We study specific dimensions of CE activities: energy efficiency, waste of water, and the use of 102
recycled materials. Based on previous studies, we expect that the level of tangibility of the industry 103
and the type of market, i.e., whether the firm sells services or goods to either consumers or 104
companies, and R&D spending have a positive impact on the implementation of CE practices. The 105
age of the firm is not expected a priori to have a role in the implementation of CE practices. 106
Descriptive statistics show that although circular economy practices are adopted by firms in all 28 107
European countries, there are differences both within countries due to firms’ characteristics – 108
dimension, age, turnover, type of activity – and between countries: environmental and energy-109
saving practices are not given the same attention everywhere in Europe. Thus, there is a hierarchical 110
structure in the population of SMEs in the EU, i.e., firms are nested within European countries; as a 111
result, we will consider heterogeneity between different types of firm and between different 112
countries. This research draws on information about SMEs operating in all economic sectors in all 28 113
European Union countries, collected in Eurobarometer surveys. The estimation of multilevel ordinal 114
probit regression models investigates the possible determinants of the adoption of practices at the 115
firm level and also evaluates the effect of differences between countries. 116
5
The paper is organized as follows. Section 2 describes data and methods (multilevel analysis). 117
Section 3 reports the results of model estimation with reference to our sample of European firms. 118
Section 4 concludes and provides lines for future research. 119
120
2 Methods 121
2.1 Eurobarometer data set 122
This research uses data from the Flash Eurobarometer 441 (European SMEs and the circular 123
economy) conducted in the 28 EU Member States4 in April 2016 and involves 10,618 interviews
124
under the supervision of the European Commission (European Commission, 2016).5 This is a unique
125
and representative sample of EU firms selected by multi-stage random sampling that allows a 126
comparative study of different countries as data is collected using a common methodology. Firms 127
employing from 1 to 250 persons within manufacturing, retail, and services are the respondent 128
units. Questions are about circular economy-related activities in the last three years and 129
characteristics of the firms. The questionnaire is translated into the native language of the 130
interviewee and back-translated to ensure the quality of the questionnaire. The European weights, 131
reproducing the actual “number of cases for each country”, ponder the sample size with the 132
universe size (derived from EUROSTAT population data or from other national statistics institutions) 133
to obtain a stratified sample, and were applied to the data set. This methodological care enhances 134
the usefulness of this secondary data for scientific research, even though contents are constrained 135
and selected based on policy-oriented priorities of the European Commission. 136
137
2.2 The multilevel model 138
The data at our disposal are hierarchical, i.e., SMEs are nested into countries; this structure requires 139
appropriate models to be used for the analysis, something that has not been previously done in the 140
literature (e.g., Hoogendoorn et al., 2015). The study applies a multilevel ordinal probit regression 141
model to be estimated simultaneously at two levels: the individual level measures the impact that 142
the characteristics of the firms in each country have on their CE intentions and behaviors; the 143
country level highlights the similarities (or differences) between EU countries. As firms from the 144
4 The 28 EU countries in this analysis are listed in Table 2.
5 The Eurobarometer surveys examine European opinion and behavior on many distinct topics ranging from
the support for developing countries and opinions on EU policy to the implementation of new technology. Data can be accessed from: www.gesis.org/eurobarometer-data-service/search-data-access/data-access
6
same country share a set of characteristics, the traditional assumption of independence is violated. 145
Such a nested structure is taken into account by the multilevel modeling, making it a particularly 146
suitable model to apply in our analysis (Hedeker and Gibbons, 1994; Hox, 2002; Snijders and Bosker, 147
2012). For example, estimating an ordinary linear regression model on hierarchical data is not 148
correct since (i) residuals may not be assumed independent and (ii) it is not possible to disentangle 149
variability at the various levels (Snijders and Bosker, 2012). The value 𝑦 measures the response of 150
individual 𝑖 (SME 𝑖) from country 𝑗 on the item 𝑘 regarding CE intentions on an ordinal scale. Ordinal 151
data is modeled by assuming an underlying continuous latent variable, 𝑦∗ , that measures the 152
propensity of individual 𝑖 in country 𝑗 to choose category 𝑚 and is related with the ordinal item by 153
thresholds: 154
𝑦 = 𝑚, if 𝜏 , < 𝑦∗ < 𝜏 , (1) 155
where 𝜏 , is the threshold for item 𝑘 that defines the categories m = 0, … , M, with 𝜏 , = −∞ and 156
𝜏 , = ∞. Thus, higher values of 𝑦∗ indicate higher categories of the observed ordinal variable. For 157
an M-level ordinal variable, 𝑀 − 1 thresholds are required. The ordinal variables are explained by a 158
set of 𝑃 observed covariates (𝑥 ). The linear component of the model is given by 𝑦∗ = 𝜷𝒙 + 159
𝑢 + 𝜖 , where 𝒙 is the vector that contains the observed covariates for observation 𝑖 in 160
cluster/country 𝑗, 𝜷 is the vector of regression parameters (fixed effects), 𝑢 is the random effect for 161
cluster/country 𝑗, and 𝜖 is the error term. The thresholds replace the intercept in the model, 162
whereas the random effect (𝑢 ) represents factors affecting 𝑦∗ that are shared by all units within 163
cluster/country 𝑗, after controlling individual covariates. The multilevel ordinal probit regression 164
model assumes standard normal errors and that random intercepts (𝑢 ) are independent of the 165
errors (𝜖 ) and normally distributed: 𝑢 ~ 𝑁(0, 𝜎 ). The intra-class correlation coefficient (ICC) is the 166
proportion of the total dispersion that is explained by the country level: 𝐼𝐶𝐶 = 𝜎 /(1 + 𝜎 ). 167
Descriptive statistics and chi-square tests are used to describe the data and test independence 168
between non-metric variables, respectively. In hypothesis testing, the maximum probability of type I 169
error (level of significance) is set at 0.05. 170
171
2.3 Variables 172
Two sets of variables are selected from the Eurobarometer sample: implementation (behavior and 173
intentions) of the CE activities in the 28 European Union by SMEs and profiling variables. 174
7
The questionnaire does not provide a definition of CE, but the respondents are asked to report on 175
the adoption in the last three years of five CE activities: re-planning the way in which water is used 176
to minimize usage and maximize re-usage, using renewable energy, re-planning energy usage to 177
minimize consumption, minimizing waste by recycling or reusing waste or selling it to another firm, 178
and redesigning products and services to minimize the use of materials or using recycled materials. 179
These five CE activities refer to energy efficiency, waste of water, and use of recycled materials that 180
are among the EU policy objectives for environmental issues; they refer specifically to the category 181
of making products more efficient (European Commission, 2003). The scale of measurement defines 182
a spectrum from no intention to adopt in the near future to an observed behavior, using the ordinal 183
categories: 1 - “No, and we do not plan to do so”, 2 - “No, but we plan to do so”, 3 - “Yes, activities 184
are underway”, and 4 - “Yes, activities have been implemented”. These answers generate ordinal 185
response variables for the multilevel probit regression models. In all models, a random effect at the 186
country level is specified in order to account for differences across countries. 187
The independent variables characterizing the firms are the number of employees (full-time 188
equivalent), the date when the firm was established, firm's total turnover in 2015, type of 189
products/services being sold, and percentage of firm's turnover invested in R&D in 2015. The 190
categories of these variables are depicted in Table 1. As the firm’s size is measured using two 191
different indicators, namely the number of employees and total turnover, the association between 192
the two variables was analyzed to avoid problems of multicollinearity in the regression models. 193
Kendall’s tau-c correlation, which varies between -1 and 1, confirms that the association between 194
the two ordinal variables (0.12) is weak (unweighted sample). 195
Six multilevel probit models are estimated as follows: first, a binary dependent variable, which 196
assumes a value of 1 if the firm undertook at least one CE activity in the past three years (the 197
dependent variable assumes the value 0, if the firm did not undertake any of the five CE activities)6;
198
then, five ordinal probit regression models which refer to each specific CE activity proposed in the 199
questionnaire using the ordinal scale defined above. 200 201 202 203 204
6 The binary probit regression model is an ordinal probit regression model with a single threshold between the
8 3. Results
205
3.1 Sample characterization 206
Table 1 reports the characterization of the sample of SMEs with reference to the number of 207
employees, the age of the firm, the total turnover in 2015, the percentage invested in research and 208
development (R&D), and the types of products or services being sold. Most of the SMEs have less 209
than 10 employees (92.7%), were founded before 2010 (80.5%), more than 95% of SMEs had a total 210
turnover of up to 10 million euros in 2015, more than 75% of them invested less than 5% of firm’s 211
turnover in R&D in 2015. Regarding the tangibility and type of market, we find that 43.2% of firms 212
sell products directly to consumers, 36.1% sell products to companies or other organizations, 43.4% 213
sell services directly to consumers, and 50.9% sell services to companies or other organizations. 214
From an inferential perspective, we conclude that all SME characteristics, except age, are statistically 215
associated with the binary variable indicating whether or not the firm undertook some CE practice 216
(the chi-square test shows a p-value <0.001). The decision to undertake activities recommended by 217
the European Union is significantly associated with the number of employees: larger firms are more 218
prone to circular economy policies. Circular economy practices are used slightly less in firms that 219
provide services. The type of client and all types of products/services being sold except services to 220
organizations are significant. In this latter case, there is no difference between adopting and not 221
adopting circular economy-related activities in the past three years. Finally, there is a significant 222
direct association between investing a larger percentage of the turnover in research and 223
development and the implementation of circular economy-related activities in the past three years. 224
[Table 1 about here.] 225
Table 2 summarizes the sample at the country level, i.e., it provides insights into the variability 226
between countries in terms of firms’ size and products vs. services sold. These figures are 227
comparable since statistics are calculated with weighted data that account for the differences in the 228
number of firms in various countries. There is an almost negligible difference in the distribution of 229
firms by the number of employees; however, Ireland has the largest proportion of big firms, 230
Germany has the highest percentage of firms with between 10 and 49 employees, and Greece has 231
the highest proportion of small firms. The data on the distribution of firms by type of activity shows 232
greater heterogeneity. 233
[Table 2 about here.] 234
9
Additional information is provided on the percentage of firms in each category that undertook any 235
circular economy related activity in the past three years. Of the 10,618 interviewed firms, 73.2% 236
undertook at least one of the five above-mentioned green actions in the last three years. 237
Table 3 reports figures on the adoption of circular economy practices at the country level. Countries 238
are ranked in descending order for the percentage of the sampled firms’ adoption of at least one 239
circular economy practice in the last three years. The most virtuous country is Malta, where over 240
90% of SMEs have undertaken at least one of these five CE following activities. The lowest 241
percentage (43.8%) is observed in Bulgaria; there is a non-negligible heterogeneity in the 242
percentages referring to all 28 EU countries. Less heterogeneity appears in the percentage of total 243
turnover devoted by firms to research and development in 2015. 244
[Table 3 about here.] 245
Figure 1 depicts the information contained in Table 3. The EU-28 countries are positioned on the 246
two-dimensional graph, showing the percentage of SMEs that undertook at least one circular 247
economy activity in the past three years (horizontal axis) and the percentage of SMEs that invested 248
more than 20% of the turnover in 2015 in research and development (vertical axis). Neighboring 249
points in the graph represent countries with similar behavior. Malta has an interesting profile: 250
although it has the highest percentage of firms that apply CE policies, very limited resources are 251
devoted to research and development. The behavior of Romania is also unusual: it has the highest 252
percentage of firms investing more than 20% of turnover in R&D, but only slightly more than 60% of 253
them adopt CE policies. Countries can be classified into four homogeneous groups (not considering 254
Malta and Romania). The first group is formed by Estonia, Bulgaria, Lithuania, Latvia, and Hungary. In 255
these countries, CE activities are not diffused and investment in R&D is low. The group composed of 256
the United Kingdom, Luxemburg, Austria, Belgium, Estonia, Portugal, Spain, and Ireland is 257
characterized by firms that are very receptive to good ecological practices. A third very small group is 258
formed by France and Hungary, where investment in R&D is especially low. Finally, the fourth and 259
biggest group containing all other EU countries has an average profile for both the surveyed 260
behaviors. 261
[Figure 1 about here.] 262
263 264
10 3.2 Overall circular economy-related activity 266
The figures in Table 4 show which factors have a statistically significant effect on the probability of a 267
firm adopting at least one suggested action. Firm’s age has no significant effect. Firm's size, total 268
turnover, and percentage invested in R&D have a significant positive effect; as the firm’s size 269
increases in terms of employees and/or turnover, the probability of adopting at least one CE activity 270
rises. Type of activity, which combines tangibility of the industry (product vs service) and type of 271
market (business to business vs business to consumers), generally has a positive effect but with a 272
different magnitude across categories; firms selling services directly to consumers are the most 273
prone to CE. Because the variance of the random effect is positive (p<0.05), there is heterogeneity in 274
this behavior between countries. The intra-class correlation coefficient (ICC) is 0.114, i.e., the 275
country level accounts for 11.4% of the variability. This result confirms the evidence reported in 276
Figure 1 and Tables 2 and 3. 277
[Table 4 about here.] 278
Figures 2, 3, 4, 5, and 6 represent the percentage of responses to the question on the adoption of 279
the five CE practices by country. The profiles of each country in the five figures are quite distinct, 280
indicating that behavior is different. Below, we will analyze the adoption of each practice, 281
commenting on both the relative figure and the results of the multilevel ordinal probit regression 282
model reported in Table 5. 283
284
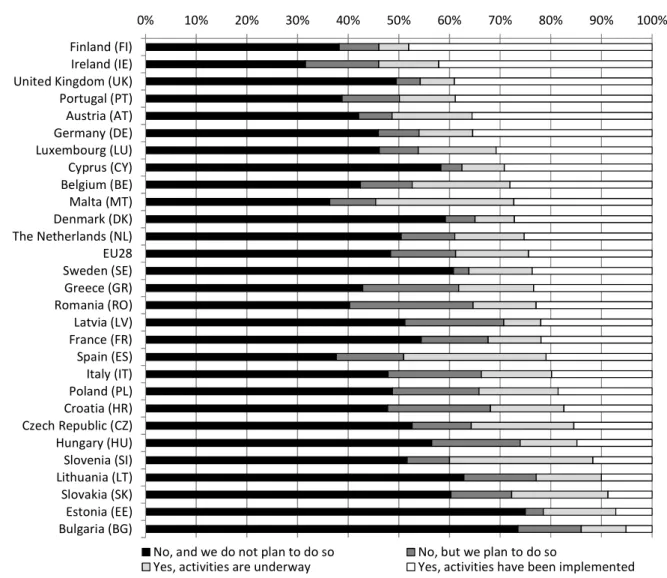
3.3 Re-planning the way water is used to minimize usage and maximize re-usage 285
Re-planning water usage falls into the category of environmental policies aimed at making products 286
more energy efficient. Moreover, the environment also benefits from less resource depletion. With 287
reference to the entire sample, an average of 18.8% of firms in Europe implemented this action in 288
the past three years or have some activities underway, 7.1% plan to do so, 69.6% of firms neither 289
perform this activity nor plan to do so in the future. However, as can be seen from Figure 2, the 290
situation differs greatly across countries. The percentage of adoption in the most virtuous countries 291
– Ireland, Luxemburg, and Portugal – is over 30%; a second group has an above average percentage 292
(Belgium, Spain, Finland, France, and Great Britain); all the other countries are below the average. 293
[Figure 2 about here.] 294
Model estimates in Table 5 show that firms’ age does not have a significant effect. The number of 295
employees has a significant and positive impact on the probability of undertaking this policy; the 296
11
effect increases with size. Total turnover has a positive significant effect only for firms with a 297
turnover of more than 10 million Euros. Selling products or services directly to consumers has a 298
significant positive effect on the behavior under analysis. Finally, the higher the percentage of total 299
turnover invested in R&D, the more likely the firm is to adopt CE activities. As noted previously, 300
heterogeneity across countries cannot be neglected (positive variance of the random effect) and the 301
ICC is 10.4%. 302
[Table 5 about here.] 303
304
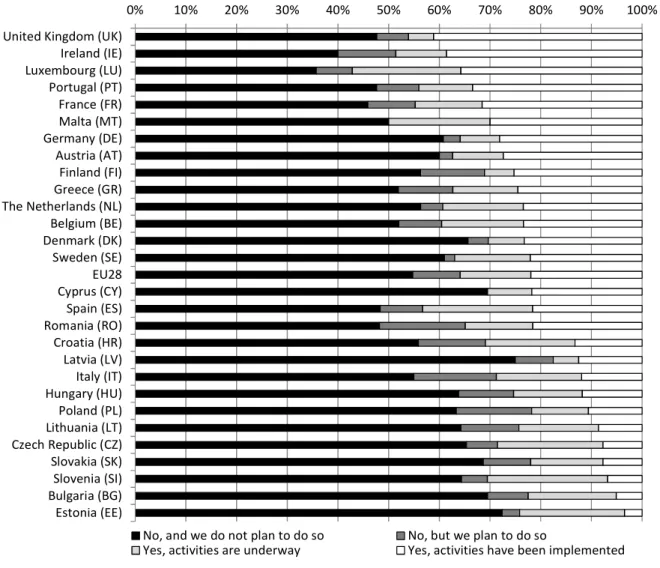
3.4 Use of renewable energy 305
The European Community Directive on renewable energy (European Community, 2009) requires that 306
at least 20% of Europe's total energy needs are met with renewables by 2020. As can be seen from 307
our data, only 15.8% of firms had adopted this CE framework in 2015 or were in the process of doing 308
so, and 67.1% do not plan to comply in the near future. Moreover, heterogeneity across countries is 309
non-negligible in this case (Figure 3); Austria has the highest percentage of firms using renewable 310
energy and Poland the lowest. The group of virtuous countries with over 30% of firms using 311
renewable energy is quite different from that of the previous policy and is made up of Austria, 312
Germany, and Luxemburg. Belgium, the Netherlands, Finland, France, Great Britain, Ireland, Malta, 313
Sweden, and Slovenia are above the average. 314
[Figure 3 about here.] 315
The results of the estimation of the ordinal regression model (Table 5) are very similar to those 316
described in the previous paragraph, except for the negative effect of firms founded in the last year; 317
in this case, younger firms are less prone to adoption, and the effect is also non-significant for firms 318
that sell products directly to consumers. The country level accounts for 8.5% (ICC). With regards to 319
total turnover, it has a negative effect on the adoption of this policy when it is very low, below 320
50,000 Euros, but a positive effect when very high, over 10 million. 321
322
3.5 Re-planning energy usage to minimize consumption 323
In the last 50 years, the consumption of energy by the industrial sector has more than doubled and 324
its cost has increased; moreover, the majority of sources are non-renewable and the environmental 325
impacts are therefore significant. Minimizing energy consumption is a very important goal at EU 326
12
level. Energy consumption can be reduced through more energy-efficient production processes; 327
these include energy efficient particle size reduction and the efficient use of raw materials (Garetti 328
and Taisch, 2011). Our survey analysis does not investigate the specific actions undertaken by firms 329
to minimize energy consumption and they may vary in line with various firm characteristics. 330
However, it detects that 37.7% of European SMEs undertook or are undertaking some measures. 331
This is the most adopted green action as it has the strongest direct link to cost reduction. It is 332
adopted by over 50% of firms in several countries (Finland, Ireland, and Malta) and by below or 333
around 20% in few countries, most of which are in Eastern Europe (Bulgaria, Estonia, and Lithuania) 334
(Figure 4). 335
[Figure 4 about here.] 336
The determinants for adopting this policy are given in Table 5: size - the bigger the firm, the larger 337
the positive effect; total turnover - a positive effect is detected after 500,000 Euros; the type of 338
production - significant positive effect for goods and services sold directly to consumers; percentage 339
of turnover devoted to R&D - increasing positive effect. We conclude that the heterogeneity at the 340
country level explains 6.5% of the dispersion in the model. 341
342
3.6 Minimizing waste by recycling or reusing waste or selling it to another company 343
Waste disposable, separation and reuse has emerged as a crucial issue in the EU and it is frequently 344
referenced in EU documents (see, for example, European Commission, 2012). For example, the EU 345
planned measures to increase waste reuse offer a range of environmental, economic, and social 346
benefits. This option, however, has only been developed to a limited extent in the EU, as our data 347
demonstrate; in fact, our analyses show that only 55.4% of EU firms have adopted or are about to 348
adopt this policy. The most virtuous group of countries is composed of the United Kingdom, Ireland, 349
and Malta (Figure 5). 350
[Figure 5 about here.] 351
Table 5 reports the inferential results. The likelihood of undertaking this activity increases with the 352
firms’ size (number of employees and total turnover), and the percentage of turnover devoted to 353
R&D. Type of activity is also significant, which means that both the tangibility of the product and the 354
type of clients are important. Firm’s age is not significant. Water reuse is the item with the biggest 355
country-level effect (ICC=0.151). 356
13
3.7 Redesigning products and services to minimize the use of materials or using recycled materials 358
A sustainable design approach for new products/services with a much better environmental 359
performance is a key element to achieve sustainability. By the end of 2015, 34.4% of EU firms 360
undertook or were undertaking these practices. The leading countries are Luxemburg and Malta 361
(Figure 6). 362
[Figure 6 about here.] 363
The positive determinants of this behavior according to the model estimation are firm’s size, 364
turnover over 500,000 Euros, type of activity, investment in R&D, and age, since there is a significant 365
positive effect for the oldest SMEs (Table 5). This CE strategy has the smallest country-level impact 366
(ICC=0.061). 367
368
4 Discussion and conclusion 369
Despite the growing number of European Union policies on environmental issues, these policies are 370
only adopted by a small proportion of firms and notably small and medium enterprises. This study 371
focuses on SMEs as most of the research about the circular economy has examined big industries. 372
This article provides an overview of the five CE activities which SMEs in the European Union practice 373
or intend to implement. More specifically, it shows the variability of practices across countries and 374
examines the SME conditions that influence this adoption. 375
The paper analyzes survey data collected by the European Commission within the Eurobarometer 376
framework. This specific survey dates from April 2016 and the sample is made up of over 10,000 377
SMEs distributed across all 28 EU countries. The sample is composed of firms of different sizes, ages, 378
and types of activity to ensure it is representative of the entire population. As a result, this research 379
extends previous knowledge, which concentrated either on limited geographical areas or specific 380
economic activities. The survey data allows us to explore the spread of CE practices in SMEs across 381
EU member states and to evaluate the determinants of this behavior. 382
We found that 73.2% of the firms undertook or were in the process of undertaking at least one CE 383
activity in the past three years; however, the situation varies greatly across countries. At the firm 384
level, the determinants of green behavior are size, total turnover, percentage of turnover devoted to 385
R&D, and type of activity. Other potential covariates, such as age, were not found to be statistically 386
significant. 387
14
Minimizing waste by recycling or reusing waste or selling it to another company is the CE practice 388
adopted most by SMEs (55.4% of firms have adopted or are about to adopt this policy), followed by 389
re-planning energy usage to minimize consumption (37.7% of SMEs) and redesigning products and 390
services to minimize the use of materials or using recycled material (34.4%). This last practice goes 391
beyond efficiency as it involves a fundamental reassessment of the use of resources; thus, the fact 392
that a very high percentage of firms do not intend to implement it in almost all 28 EU countries is a 393
striking result. The use of renewable energy was adopted or considered for the immediate future by 394
only 15% of firms, making it the CE practice with the lowest percentage. However, re-planning the 395
way water is used to minimize usage and maximize re-usage had only a slightly higher percentage 396
(18.8%). 397
The five practices also differ in relation to the firm characteristics with a significant effect on their 398
adoption. Notwithstanding, the firm’s size and the percentage of total turnover devoted to R&D 399
have a statistically significant effect in all models, indicating that these two elements may become 400
crucial factors in the development of green actions. The practices of redesigning products and 401
services and minimizing waste by recycling are also determined by resources since there is a positive 402
effect on the probability of their adoption only for firms with a total turnover greater than 500,000 403
Euros. 404
This result indirectly indicates that enterprises with few resources may be able to afford practices 405
such as reduction of waste but not more demanding redesigning practices. This evidence casts some 406
doubts on the equation between CE and efficiency; whereas efficiency simply means to produce 407
more value with less input, CE practices imply a new way of thinking, that is, not only reducing inputs 408
or waste but, as C2C suggests, returning raw materials to the environment. 409
Other interesting evidence emerges through an analysis of the variability in the adoption of CE 410
practices across the 28 EU member states. The ICC figures estimated with the multilevel ordinal 411
regression models show that redesigning products and services has the lowest level of variability; in 412
other words, in SMEs across all countries in the EU, redesigning products and services is not among 413
the first practices adopted but, in addition to this, there are no plans to adopt this strategy. Only 414
Portugal, France, Great Britain, Luxembourg, and Ireland have over 30% of firms already 415
implementing this action. On the other hand, the percentage for Eastern European countries and 416
Italy is almost negligible. The implementation is underway in more than 20% of firms in Estonia, 417
Czech Republic, Luxembourg, Spain, and Slovenia. Minimizing waste is the practice with the greatest 418
variability across countries because, although it has an average implementation by SMEs, almost no 419
firms adopt it in a small group of countries, namely in Bulgaria and Estonia. It is a concern that EU 420
15
SMEs have no plans to adopt redesigning practices as this was one of the main approaches of the EU 421
circular economy package. 422
The case of Malta is interesting as the small country has the highest percentage of SMEs that 423
undertook at least one CE related activity. However, in 2016, the municipal waste recycling rate 424
(including composting) reported by Malta to Eurostat was 7 %7, which means that Malta is one of
425
the 14 European countries lagging behind the 2020 target of 50% preparation for re-use/recycling of 426
municipal waste; this result shows the need for more country-specific and detailed studies as it 427
seems there may be very different situations within countries (according to the Eurobarometer data, 428
the Maltese SMEs were the most proactive in the EU). 429
Evidence emerging from our analyses suggests a number of lines of future research, both within 430
specific countries, as in the example of Malta, and also between countries with different 431
characteristics or belonging to different regions of the EU. For example, our models could include 432
covariates collected at county level, such as indicators of economic and social wealth that are 433
available in official statistics and are disseminated by National Statistical Institutes and Eurostat. This 434
type of analysis could also help explain why certain practices are seldom adopted in some 435
geographical areas, while others are lacking across almost all EU member states. Whereas the 436
former should be promoted with country specific policies, EU policy orientation should be redefined 437
for the latter with new incentives for all EU state members. Moreover, it would be fruitful to extend 438
some recent studies on the internal and external drivers favouring the adoption of CE practices (e.g. 439
Yadav et al., 2018) by analysing these in conjunction with firms’ conditions. The Eurobarometer 440
surveys collect regular information on CE practices; thus, further analyses would allow our findings 441
to be compared with others using future data. For example, information obtained from the two-442
yearly Eurobarometer survey on resources efficiency and green markets in SMEs in Europe could be 443
used to explain some of the results obtained in our research. A future stream of research might also 444
compare SMEs with large companies using a representative sample of all EU firms. Such a sample 445
could shed light on the scale factors that would allow the five CE activities to be implemented. 446
Green competences in European SMEs are an additional topic of interest, namely, finding out how 447
many workers perform green jobs and the importance of these skills in the eyes of managers. The 448
relationship between CE practices, employment, and green skills has recently found space in the 449
reference literature (see, for example, Ghisellini et al. 2016) and seems a promising field to be 450
explored to explain the adoption of CE practices at firm and country levels. This is the case of SMEs 451
in particular as the segment is usually described as lagging behind in terms of CE. However, the 452
16
failure to act may be due to insufficient resources and expertise rather than a lack of positive 453
attitudes towards green practices (Cassells and Lewis, 2011). 454
In conclusion, more research is needed to disseminate this knowledge and develop this new way of 455
thinking in SMEs. Not only do these results generate novel ideas for future research but they also 456
provide EU policymakers with indications of key priorities and the information required. 457
458
References 459
Cassells, S., Lewis, K., 2011. SMEs and environmental responsibility: Do actions reflect attitudes? 460
Corp. Soc. Responsib. Environ. Manag. 18(3), 186-199. 461
Dalhammar, C., 2016. Industry attitudes towards ecodesign standards for improved resource 462
efficiency. J. Clean. Prod. 123, 155-166. 463
del Rio Gonzàlez, P., 2005, Analysing the factors influencing clean technology adoption: a study of 464
the Spanish and paper industry, Bus. Strateg. Environ. 14, 20-37. 465
Ellen MacArthur Foundation, 2015. Towards the Circular Economy: Economic and Business Rationale 466
for an Accelerated Transition, Isle of Wight. Available:
467
https://www.ellenmacarthurfoundation.org/assets/downloads/TCE_Ellen-MacArthur-468
Foundation_9-Dec-2015.pdf (accessed 14.04.2018). 469
European Commission, 2003. Communication on Integrated Product Policy Building on 470
Environmental Life-Cycle Thinking. Available: https://eur-lex.europa.eu/legal-471
content/EN/TXT/?uri=CELEX%3A52003DC0302 (accessed 28.04.2018). 472
European Commission, 2012. Impact Assessment of the Communication: A Blueprint to Safeguard 473
Europe's Water Resources. Available: http://eur-lex.europa.eu/legal-474
content/EN/TXT/?uri=CELEX:52012DC0673 (accessed 28.04.2018). 475
European Commission, 2014. Towards a Circular Economy: a Zero Waste Program for Europe. 476
Available: http://eur-lex.europa.eu/legal-content/EN/TXT/?uri=CELEX:52014DC0398R%2801%29 477
(accessed 23.03.2018). 478
European Commission, 2015. Closing the Loop - an EU Action Plan for the Circular Economy, 614 479
Communication from the Commission to the European Parliament, the Council, the European 480
Economic and Social Committee and the Committee of the Regions. European Commission, 481
Brussels. Available: http://eur-lex.europa.eu/legal-content/EN/TXT/?uri=CELEX:52015DC0614 482
(accessed 12.04.2018). 483
European Commission, 2016. European SMEs and the Circular Economy (Flash Eurobarometer 411). 484
Brussels, April. 485
17
European Commission Enterprise and Industry (ECEI), 2010. SMEs and the Environment in the 486
European Union. Teknologisk Institut, Denmark. 487
European Community, 2009. Directive 2009/28/EC of the European Parliament and of the Council on 488
the promotion of the use of energy from renewable sources. Available: https://eur-489
lex.europa.eu/legal-content/EN/ALL/?uri=celex%3A32009L0028 (accessed on 4.05.2018). 490
Garetti, M., Taisch, M., 2011. Sustainable manufacturing: trends and research challenges. Prod. Plan. 491
Control. 23, 83-104. 492
Ge, X., Jackson, J., 2014. The big data application strategy for cost reduction in automotive industry. 493
SAE Int. J. Commer. Veh. 7, 588-598. 494
Ghisellini, P., Cialani, C., Ulgiati, S. 2016. A review on circular economy: the expected transition to a 495
balanced interplay of environmental and economic system. J. Clean. Prod. 114, 11-32. 496
Hanyu, K., Kishino, H., Yamashita, H., Hayashi, C., 2000. Linkage between recycling and consumption: 497
a case of toilet paper in Japan. Resour. Conserv. Recycl. 30, 177-199. 498
Hedeker, D., Gibbons, R.D., 1994. A random-effects ordinal regression model for multilevel analysis. 499
Biometrics. 50, 933-944. 500
Hockerts, K., Wüstenhagen, R., 2010. Greening Goliaths versus emerging Davids – Theorizing about 501
the role of incumbents and new entrants in sustainable entrepreneurship. J. Bus. Ventur. 25(5), 502
481-492. 503
Hoogendoorn, B., Guerra, D., van der Zwan, P., 2015. What drives environmental practices of SMEs?. 504
Small Bus. Econ. 44, 759-781. 505
Hox, J. 2002. Multilevel Analysis: Techniques and Applications. Quantitative Methodology Series, 506
Lawrence Erlbaum Associates Publishers, Mahwah, NJ, US. 507
Huang, P.S., Zhang, X.L., Deng, X.D., 2006. Survey and analysis of public environmental awareness 508
and performance in Ningbo, China: A case study on household electrical and electronic 509
equipment. J. Clean. Prod. 14, 1635-1643. 510
Hughes, R., 2017. The EU Circular Economy package - life cycle thinking to life cycle law?, 24th CIRP 511
Conference on Life Cycle Engineering, Procedia CIRP, 61, 10-16. 512
Jansson, J., Marell, A., Nordlund, A., 2010. Green consumer behavior: determinants of curtailing and 513
eco-innovation adoption. J. Consum. Mark. 27, 358-370. 514
Kopnina, H., 2018. Teaching circular economy: overcoming the challenge of green-washing. In 515
Dhiman, S., Marques, J. (Eds.) Handbook of Engaged Sustainability. Springer, New York, pp. 809-516
833. 517
Lieder, M., Rashid, A., 2016. Towards circular economy implementation: A comprehensive review in 518
context of manufacturing industry. J. Clean. Prod. 115, 36-51. 519
18
Liu, L., Liang, Y., Song, Q., Li, J., 2017. A review of waste prevention thorough 3R under the concept 520
of circular economy in China. J. Mater. Cycles Waste Manage. 19, 1314-1323. 521
McDonald, S., Oates, C., 2003. Reasons for non-participation in a curbside recycling scheme. Resour. 522
Conserv. Recycl. 39, 369-385. 523
McDonough, W., Braungart, M., 2002. Cradle to Cradle: Remaking the Way We Make Things, North 524
Point Press, New York. 525
Neubaum, D., Mitchell, M., Schminke, M., 2004. Firm newness, entrepreneurial orientation, and 526
ethical climate. J. Bus. Ethics. 52(4), 335-347. 527
Ormazabal, M., Prieto Sandoval, V., Puga-Leal R., Jaca, C. 2018. Circular economy in Spanish SMEs: 528
Challenges and opportunities. J. Clean. Prod. 185, 157-167. 529
Pearce, D.W., Turner, R.K., 1990. Economics of Natural Resources and the Environment. Harvester 530
Wheats Heaf, London. 531
Repo, P., Anttonen, M., Mykkanen, J., Lammi, M., 2018. Lack of congruence between European 532
citizen perspectives and policies on circular economy. Eur. J. Sustain. Dev. 7, 249-264. 533
Rizos, V., Behrens, A., van der Gaast, W., Hofman, A., Ioannu, A., Kafyeke, T., Flamos, A., Rinaldi, S., 534
Papadelis, Hirschnitz-Gabers, M., Topi, C., 2016. Implementation of circular economy business 535
models by small and medium size enterprises (SMEs): Barriers and enablers, Sustainability. 8, 536
1212. 537
Schaltegger, S., Wagner, M. 2011. Sustainable entrepreneurship and sustainable innovation: 538
categories and interactions. Bus. Strateg. Environ. 20, 222-237. 539
Snijders, T.A.B., Bosker, R.J., 2012. Multilevel Analysis: An Introduction to Basic and Advances 540
Multilevel Modeling, Sage, London. 541
Stahel, W.R., Ready, G., 1976. The potential for substituting manpower for energy. Report to the 542
Commission of the European Communities. 543
Stahel, W.R., 2016. The circular economy. Nature. 531, 453-438. 544
Welsh, A., White, J., 1981. A small business is not a little big business. Harv. Bus. Rev. 59(July-545
August), 18-32. 546
Yadav, N., K. Gupta, L. Rani, D. Rawat, 2018. Drivers of sustainability practices and SMEs: A 547
systematic literature review. Eur. J. Sustain. Dev. 7(4), 531-544. 548
19
Figure 1. European countries by percentage of SMEs investing more than 20% of 2015 turnover in 550
R&D and percentage of SMEs that undertook at least one CE activity in the last three years 551
552
553 554
20
Figure 2. Re-planning the way water is used to minimize usage and maximize re-usage (in the last 3 555 years) 556 557 558 0% 10% 20% 30% 40% 50% 60% 70% 80% 90% 100% Ireland (IE) United Kingdom (UK) Portugal (PT) Finland (FI) Belgium (BE) Luxembourg (LU) France (FR) Germany (DE) EU28 Austria (AT) Romania (RO) Spain (ES) The Netherlands (NL) Malta (MT) Cyprus (CY) Poland (PL) Greece (GR) Hungary (HU) Latvia (LV) Denmark (DK) Italy (IT) Sweden (SE) Czech Republic (CZ) Croatia (HR) Slovenia (SI) Slovakia (SK) Lithuania (LT) Bulgaria (BG) Estonia (EE)
No, and we do not plan to do so No, but we plan to do so
21 Figure 3. Use of renewable energy (in the last 3 years). 559 560 561 0% 10% 20% 30% 40% 50% 60% 70% 80% 90% 100% Austria (AT) Germany (DE) Finland (FI) Luxembourg (LU) Belgium (BE) Malta (MT) Sweden (SE) Ireland (IE) United Kingdom (UK) France (FR) EU28 The Netherlands (NL) Cyprus (CY) Slovenia (SI) Portugal (PT) Denmark (DK) Latvia (LV) Croatia (HR) Spain (ES) Hungary (HU) Italy (IT) Greece (GR) Czech Republic (CZ) Romania (RO) Slovakia (SK) Lithuania (LT) Poland (PL) Bulgaria (BG) Estonia (EE)
No, and we do not plan to do so No, but we plan to do so
22
Figure 4. Re-planning energy usage to minimize consumption (in the last 3 years). 562 563 564 0% 10% 20% 30% 40% 50% 60% 70% 80% 90% 100% Finland (FI) Ireland (IE) United Kingdom (UK) Portugal (PT) Austria (AT) Germany (DE) Luxembourg (LU) Cyprus (CY) Belgium (BE) Malta (MT) Denmark (DK) The Netherlands (NL) EU28 Sweden (SE) Greece (GR) Romania (RO) Latvia (LV) France (FR) Spain (ES) Italy (IT) Poland (PL) Croatia (HR) Czech Republic (CZ) Hungary (HU) Slovenia (SI) Lithuania (LT) Slovakia (SK) Estonia (EE) Bulgaria (BG)
No, and we do not plan to do so No, but we plan to do so
23
Figure 5. Minimizing waste by recycling or reusing waste or selling it to another company (in the 565 last 3 years). 566 567 568 0% 10% 20% 30% 40% 50% 60% 70% 80% 90% 100% Ireland (IE) United Kingdom (UK) Finland (FI) Luxembourg (LU) Malta (MT) Portugal (PT) Austria (AT) France (FR) The Netherlands (NL) Belgium (BE) Germany (DE) EU28 Cyprus (CY) Croatia (HR) Spain (ES) Denmark (DK) Romania (RO) Greece (GR) Sweden (SE) Hungary (HU) Poland (PL) Italy (IT) Latvia (LV) Czech Republic (CZ) Lithuania (LT) Slovenia (SI) Slovakia (SK) Bulgaria (BG) Estonia (EE)
No, and we do not plan to do so No, but we plan to do so
24
Figure 6. Redesigning products and services to minimize the use of materials or using recycled 569
materials (in the last 3 years). 570 571 572 573 574 0% 10% 20% 30% 40% 50% 60% 70% 80% 90% 100%
United Kingdom (UK) Ireland (IE) Luxembourg (LU) Portugal (PT) France (FR) Malta (MT) Germany (DE) Austria (AT) Finland (FI) Greece (GR) The Netherlands (NL) Belgium (BE) Denmark (DK) Sweden (SE) EU28 Cyprus (CY) Spain (ES) Romania (RO) Croatia (HR) Latvia (LV) Italy (IT) Hungary (HU) Poland (PL) Lithuania (LT) Czech Republic (CZ) Slovakia (SK) Slovenia (SI) Bulgaria (BG) Estonia (EE)
No, and we do not plan to do so No, but we plan to do so
25 Table 1. Overall characterization of the sample. 575 576 577 Undertook some circular economy related activity in past 3 years
Did not undertake circular economy related activities in past 3 years
Total
73.18 26.82
Number of employees (full-time equivalent) ***
1 to 9 employees 91.67 95.36 92.66
10 to 49 employees 7.05 4.20 6.28
50 to 250 employees 1.29 0.43 1.06
Date firm established
Before 1 January 2010 80.69 79.89 80.47
Between 1 January 2010 and 1 January 2015 16.95 17.40 17.07
After 1 January 2015 2.36 2.71 2.46
Firm's total turnover in 2015 ***
Less than 25 000 euros 10.23 17.06 12.04
More than 25 000 to 50 000 euros 10.12 11.92 10.59
More than 50 000 to 100 000 euros 12.56 12.44 12.53
More than 100 000 to 250 000 euros 19.37 17.23 18.81
More than 250 000 to 500 000 euros 16.41 16.41 16.41
More than 500 000 to 2 million euros 19.14 16.60 18.47
More than 2 to 10 million euros 7.27 5.61 6.83
More than 10 million euros 4.90 2.73 4.33
Products/services being sold (multiple choice)
Products directly to consumers *** 45.84 36.12 43.23
Products to companies or other organizations *** 39.17 30.37 36.81
Services directly to consumers *** 45.07 38.90 43.42
Services to companies or other organizations 51.08 50.33 50.88
Firm's turnover in 2015 invested in R & D (%) ***
Less than 5% 78.05 86.11 75.26 From 5% to 9.9% 8.85 5.83 7.54 From 10% to 14.9% 6.01 2.97 4.87 From 15% to 19.9% 1.75 0.77 1.39 20% or more 5.33 4.32 4.75 Note: *** p < 0.001
26
Table 2. Country-level overview of firms: Company size and products. 578
579 580
Country Number of employees (full-time equivalent) Products/services being sold (multiple choice: Yes) 1 to 9 employees 10 to 49 employees 50 to 250 employees Products directly to consumers Products to companies or other organizations Services directly to consumers Services to companies or other organizations Austria (AT) 86.93 11.11 1.96 47.06 43.14 50.98 53.59 Belgium (BE) 94.38 4.87 0.75 52.81 42.54 49.06 55.06 Bulgaria (BG) 90.97 7.64 1.39 38.89 30.56 37.76 44.06 Croatia (HR) 91.43 7.14 1.43 35.71 45.71 39.13 55.07 Cyprus (CY) 95.65 4.35 0.00 54.17 54.17 34.78 39.13 Czech Republic (CZ) 96.10 3.25 0.65 40.91 38.23 51.40 52.60 Denmark (DK) 89.42 8.65 1.92 31.73 53.33 30.77 55.77 Estonia (EE) 92.86 7.14 0.00 25.00 27.59 50.00 72.41 Finland (FI) 92.23 6.80 0.97 37.50 43.69 56.73 75.00 France (FR) 94.95 4.40 0.65 54.55 43.58 55.41 53.03 Germany (DE) 81.52 15.81 2.67 39.33 40.91 41.30 54.25 Greece (GR) 97.05 2.65 0.29 37.17 48.53 35.10 49.26 Hungary (HU) 93.91 5.22 0.87 40.61 53.91 37.55 62.88 Ireland (IE) 89.87 6.33 3.80 48.10 22.78 49.37 41.77 Italy (IT) 94.71 4.77 0.52 44.62 23.33 34.33 33.22 Latvia (LV) 88.10 9.52 2.38 38.10 38.10 48.78 64.29 Lithuania (LT) 91.43 7.14 1.43 41.43 31.43 47.89 50.70 Luxembourg (LU) 85.71 14.29 0.00 50.00 50.00 50.00 64.29 Malta (MT) 91.67 8.33 0.00 45.45 50.00 41.67 45.45 Poland (PL) 95.13 3.89 0.97 42.92 42.78 48.68 65.69 Portugal (PT) 95.41 4.05 0.54 54.18 38.92 48.11 53.24 Romania (RO) 87.92 10.14 1.93 37.20 22.22 33.33 54.11 Slovakia (SK) 96.81 2.66 0.53 32.45 25.00 47.62 47.87 Slovenia (SI) 93.55 4.84 1.61 35.48 54.10 32.26 57.38 Spain (ES) 94.46 4.90 0.64 30.88 35.79 37.73 53.32 Sweden (SE) 94.06 4.95 0.99 31.68 40.92 36.42 74.83 The Netherlands (NL) 95.03 4.05 0.92 38.86 44.01 37.38 61.33
27
Table 3. Country-level overview of SMEs: R & D and Circular economy. 581 582 583 584 585 586 587 588 589 590 591
Country Firm's turnover in 2015 invested in R & D (%)
Less than 5% From 5% to 9.9% From 10% to 14.9% From 15% to 19.9% 20% or more Malta (MT) 77.78 11.11 11.11 0.00 0.00 91.67 Ireland (IE) 74.32 13.51 6.76 0.00 5.41 88.61 Luxembourg (LU) 76.92 7.69 7.69 0.00 7.69 85.71 Spain (ES) 79.20 8.21 8.11 1.53 2.96 84.74 Austria (AT) 80.14 9.59 4.79 0.00 5.48 84.21
United Kingdom (UK) 81.74 6.04 3.51 1.26 7.44 84.06
Belgium (BE) 77.20 9.60 6.00 3.20 4.00 83.96 Portugal (PT) 86.23 6.29 3.89 0.30 3.29 82.21 Finland (FI) 81.00 8.00 6.00 0.00 5.00 78.64 Germany (DE) 78.65 6.29 6.63 1.24 7.19 77.87 France (FR) 88.95 5.56 3.34 0.52 1.63 74.10 Greece (GR) 79.26 9.29 3.41 2.48 5.57 73.45 Croatia (HR) 83.08 9.23 4.62 1.54 1.54 73.16 The Netherlands (NL) 74.25 11.84 7.89 1.50 4.51 73.11 Sweden (SE) 87.12 3.39 3.39 1.69 4.41 71.29 Czech Republic (CZ) 78.26 7.97 3.86 2.66 7.25 70.35 Slovenia (SI) 68.33 10.00 8.33 3.33 10.00 69.35 Cyprus (CY) 75.00 12.50 4.17 0.00 8.33 66.67 Italy (IT) 79.45 9.31 4.63 1.86 4.75 66.61 Denmark (DK) 80.61 6.12 4.08 2.04 7.14 62.50 Slovakia (SK) 88.70 4.52 2.26 0.56 3.95 62.23 Poland (PL) 67.97 14.06 6.67 2.03 9.28 62.03 Romania (RO) 63.68 7.96 8.46 4.48 15.42 61.84 Hungary (HU) 84.91 8.96 2.36 0.94 2.83 56.96 Latvia (LV) 82.93 7.32 4.88 0.00 4.88 53.66 Lithuania (LT) 89.86 2.90 4.35 0.00 2.90 47.14 Estonia (EE) 89.29 3.57 3.57 0.00 3.57 44.83 Bulgaria (BG) 91.43 1.43 4.29 0.00 2.86 43.75 Undertook some circular economy related activity (Yes)
28 Table 4. Multilevel binary probit regression results. 592
Undertook some circular economy related activity in past 3 years
Estimate S.E. p-value
Level 1 - Regression model: Fixed effects
Number of employees (full-time equivalent)
1 to 9 employees (ref.)
10 to 49 employees 0.174 0.078 0.026
50 to 250 employees 0.401 0.103 <0.001
Date firm established
Before 1 January 2010 (ref.)
Between 1 January 2010 and 1 January 2015 0.071 0.054 0.190
After 1 January 2015 -0.004 0.183 0.983
Firm's total turnover in 2015
Less than 25,000 euros (ref.)
More than 25,000 to 50,000 € 0.104 0.109 0.339
More than 50,000 to 100,000 € 0.057 0.111 0.605
More than 100,000 to 250,000 € 0.175 0.083 0.036
More than 250,000 to 500,000 € 0.241 0.090 0.008
More than 500,000 to 2 million € 0.388 0.105 <0.001
More than 2 to 10 million € 0.369 0.148 0.013
More than 10 million € 0.662 0.165 <0.001
Products/services being sold (multiple choice)
Products directly to consumers 0.182 0.058 0.002
Products to companies or other organizations 0.258 0.072 <0.001
Services directly to consumers 0.285 0.049 <0.001
Services to companies or other organizations 0.044 0.073 0.547
Firm's turnover in 2015 invested in R & D (%)
Less than 5% (ref.)
From 5% to 9.9% 0.326 0.109 0.003 From 10% to 14.9% 0.460 0.097 <0.001 From 15% to 19.9% 0.532 0.226 0.019 20% or more 0.378 0.147 0.010 Thresholds τ1 0.015 0.124 0.906
Level 2 - Random effects
Var(uj) 0.129 0.034 <0.001
ICC 0.114
Note: Residual variance equals 1.
29 Table 5. Multilevel ordinal probit regression results.
Re-planning the way water is used to minimize usage and maximize re-usage (in the last
3 years)?
Use of renewable energy (in the
last 3 years)? minimize consumption (in the last Re-planning energy usage to 3 years)?
Minimizing waste by recycling or reusing waste or selling it to another company (in the last 3
years)?
Redesigning products and services to minimize the use of materials or using recycled materials (in the
last 3 years)?
Estimate S.E. p-value Estimate S.E. p-value Estimate S.E. p-value Estimate S.E. p-value Estimate S.E. p-value
Level 1 - Regression model: Fixed effects
Number of employees (full-time
equivalent)
10 to 49 employees 0.131 0.053 0.013 0.111 0.048 0.020 0.137 0.042 0.001 0.273 0.049 <0.001 0.104 0.046 0.022
50 to 250 employees 0244 0.080 0.002 0.271 0.082 0.001 0.301 0.052 <0.001 0.431 0.052 <0.001 0.230 0.071 0.001
Date firm established
Between 1 January 2010 and 1 January
2015 -0.052 0.032 0.103 -0.044 0.041 0.288 -0.050 0.034 0.145 0.005 0.044 0.912 0.080 0.041 0.051
After 1 January 2015 0.018 0.120 0.883 -0.299 0.143 0.037 -0.027 0.133 0.839 0.013 0.117 0.909 -0.011 0.111 0.921
Firm's total turnover in 2015
More than 25,000 to 50,000 € -0.037 0.081 0.649 -0.223 0.067 0.001 0.007 0.062 0.909 0.130 0.054 0.015 -0.017 0.066 0.799
More than 50,000 to 100,000 € -0.073 0.070 0.296 -0.069 0.072 0.339 -0.055 0.065 0.400 0.129 0.056 0.022 0.019 0.059 0.746
More than 100,000 to 250,000 € -0.155 0.091 0.090 -0.044 0.071 0.529 0.045 0.072 0.535 0.189 0.054 <0.001 0.062 0.068 0.365
More than 250,000 to 500,000 € -0.079 0.089 0.376 0.012 0.068 0.861 0.104 0.067 0.124 0.303 0.058 <0.001 0.094 0.055 0.085
More than 500,000 to 2 million € -0.076 0.080 0.340 -0.005 0.070 0.946 0.157 0.065 0.016 0.271 0.055 <0.001 0.152 0.066 0.021
More than 2 to 10 million € -0.104 0.099 0.292 0.068 0.094 0.469 0.181 0.077 0.018 0.341 0.076 <0.001 0.244 0.068 <0.001
More than 10 million € 0.260 0.110 0.019 0.240 0.122 0.048 0.398 0.082 <0.001 0.388 0.068 <0.001 0.189 0.095 0.046
Products/services being sold (multiple
choice)
Products directly to consumers 0.112 0.033 0.001 0.075 0.045 0.095 0.180 0.036 <0.001 0.159 0.032 <0.001 0.028 0.037 0.447
Products to companies or other
organizations 0.052 0.041 0.206 0.082 0.053 0.121 0.039 0.044 0.378 0.160 0.034 <0.001 0.134 0.039 0.001
Services directly to consumers 0.273 0.039 <0.001 0.225 0.036 <0.001 0.208 0.028 <0.001 0.206 0.030 <0.001 0.236 0.024 <0.001
Services to companies or other
organizations -0.049 0.041 0.238 0.031 0.042 0.473 -0.033 0.024 0.160 0.003 0.037 0.925 0.018 0.044 0.688
Firm's turnover in 2015 invested in R & D
From 5% to 9.9% 0.202 0.038 <0.001 0.290 0.047 <0.001 0.272 0.056 <0.001 0.147 0.048 0.002 0.413 0.052 <0.001 From 10% to 14.9% 0.243 0.059 <0.001 0.351 0.076 <0.001 0.274 0.043 <0.001 0.236 0.059 <0.001 0.439 0.057 <0.001 From 15% to 19.9% 0.404 0.167 0.015 0.348 0.097 <0.001 0.326 0.115 0.004 0.196 0.107 0.068 0.505 0.121 <0.001 20% or more 0.324 0.070 <0.001 0.364 0.060 <0.001 0.270 0.086 0.002 0.159 0.081 0.049 0.344 0.073 <0.001 Thresholds τ1 0.860 0.103 <0.001 0.790 0.092 <0.001 0.294 0.083 <0.001 0.225 0.091 0.014 0.563 0.089 <0.001 τ2 1.125 0.099 <0.001 1.275 0.096 <0.001 0.626 0.089 <0.001 0.359 0.091 <0.001 0.806 0.092 <0.001 τ3 1.437 0.099 <0.001 1.546 0.106 <0.001 1.055 0.095 <0.001 0.903 0.116 <0.001 1.256 0.110 <0.001
Level 2 - Random effects
Var(uj) 0.116 0.029 <0.001 0.093 0.020 <0.001 0.069 0.021 0.001 0.178 0.047 <0.001 0.065 0.013 <0.001
ICC 0.104 0.085 0.065 0.151 0.061