UNIVERSIDADE DE LISBOA FACULDADE DE CIÊNCIAS DEPARTAMENTO DE BIOLOGIA VEGETAL
Identification of novel glycosylation patterns in cancer and
their role in cancer progression and metastasis
António Gonçalo Almeida Fernandes Mineiro
Mestrado em Biologia Molecular e Genética
Dissertação orientada por:
Prof. Dr.ª Paula Alexandra Quintela Videira Prof. Dr. Pedro João Neves e Silva
i Acknowledgements
À minha família pela força constante e pelo apoio incondicional. À minha Mãe pelo amor, pela força e dedicação, por caminhar sempre ao meu lado em todas as etapas da minha vida. Ao meu Irmão pela amizade, pelo orgulho e por me fazer acreditar. Obrigado por me inspirares. À minha Avó Silvina pelo amor interminável e pelo exemplo de coragem e determinação, por um dia me ter ensinado que não podemos colocar limites nos nossos sonhos. À minha Tia Lurdes e à minha Prima Inês pelo apoio, motivação e pelas gargalhadas intermináveis. E por fim, e porque não podia ser diferente, ao meu Pai…as saudades são cada vez maiores. A vocês eu devo tudo aquilo que sou hoje.
À Professora Paula Videira, por me ter apresentado o gigante mundo da Glicobiologia, por ter acreditado em mim para desenvolver este projeto e por toda a amizade, orientação, conselhos, apoio e por todo o conhecimento que me transmitiu. Durante este ano ajudou-me a crescer não só do ponto de vista científico mais também pessoal. Serei sempre grato pela oportunidade.
À Professora Paula Borralho, por ter aceite ser minha coorientadora e por toda a sua disponibilidade, ajuda e atenção.
Ao Professor Pedro Silva, por ter aceite ser meu orientador e pela sua disponibilidade, ajuda e sentido de humor.
A todos os meus colegas de laboratório, à Zélia Silva, à Roberta Zoppi, à Fanny Deschepper, ao Tiago Ferro, à Carlota Pascoal, à Rita Loios, ao Tiago Costa e ao Vítor Martins, um obrigado pela amizade e companheirismo, pela ajuda, apoio e boa disposição. Um obrigado especial à Érica Freitas pela amizade, apoio e motivação, pelas horas infinitas de trabalho e pelos infinitos planos e tentativas de nos organizarmos. Nós sabíamos que no final ia dar certo!
À Ana Raquel Henriques, por todos os ensinamentos, pela simpatia e ajuda, por partilharmos tantas horas de Imunohistoquímica.
À Mylène Carrascal, um obrigado pela infinita disponibilidade e ajuda.
Não posso também deixar de agradecer ao Professor Jaime Mota pela boa disposição e à Joana Bugalhão pela eterna paciência em me ajudar com aquele Microscópio de Fluorescência.
Aos meus amigos, em especial ao João e à Rita, por todo o apoio e paciência.
Ao Departamento de Ciências da Vida e à Faculdade de Ciências e Tecnologia da Universidade Nova de Lisboa, por me ter acolhido durante este ano e me ter dado a oportunidade de desenvolver o meu projeto.
ii Abstract
Aberrant glycosylation patterns are responsible for a significant increase in tumour malignancy. It is increasingly evident that such patterns play an important role in cancer progression, namely in invasion and metastasis, which is related to poor prognosis in cancer.
The expression of sialofucosylated glycans, such as sialyl-Lewis x and sialyl-Lewis a (sLex/a), by
circulation tumour cells, seems to be essential and able to promote extravasation and tissues invasion, a crucial step in metastasis.
In this thesis, we aimed to identify the expression of aberrant glycosylation patterns, namely the sLex/a
antigens, in colon adenocarcinoma and TNBC tissues, using the immunohistochemical method, and then, using cell lines as experimental model, we have attempted to study the role of these patterns, through the inhibition of fucosylation, in cancer progression and metastasis.
Our results show that inhibition of fucosylation, using 2-fluorofucose inhibitor, is responsible for decreasing the expression of sialofucosylated ligands, such as the minimal determinant for E-selectin binding, the sLex/a, which is expressed in tumour tissues and decorate functionally important
glycoproteins, being the Mucin 1 a candidate to carry this glycosylation pattern. Immunofluorescence assays show that this decrease seems to interfere with the cytoskeleton components, namely the cytokeratins, whose expression is increased. In addition, inhibition of fucosylation was also responsible for decreasing the expression of fibronectin, an important component of the extracellular matrix with functions in fundamental processes in cancer, such as the epithelial-mesenchymal transition. These phenotypic alterations can decrease the proliferative capacity and tumour cells migration, as well as, interfere with signalling pathways by modelling the expression of growth factors involved in the cell cycle progression, tumour growth, angiogenesis and invasion, as well as proinflammatory cytokines, including IL-1β and IL-6, whose expression was assessed by RT-qPCR.
Our results also suggest that the inhibition of fucosylation, besides reducing the expression of aberrant glycosylation patterns, can induce a set of morphological and phenotypic alterations that may lead to the restoring of a less aggressive phenotype considering invasion and cancer metastasis.
These features may be explored in the future to the study and development of new therapies that target the initial stages of metastasis, like the epithelial-mesenchymal transition, and fucosylation.
Keywords:
iii Resumo
A Glicosilação consiste na adição enzimática que glicanos a estruturas não glicídicas, como as proteínas ou os lípidos, onde estão envolvidas enzimas como as glicosiltransferases e as glicosidases. É uma das principais modificações pós-traducionais nos eucariotas, ocorre ao longo da via Reticulo Endoplasmático-cis/trans Golgi e consiste num processo altamente regulado de onde resulta uma extensa diversidade de glicoconjugados. A esta grande diversidade está subjacente uma grande variedade de glicanos que resulta dos diferentes arranjos de açúcares e das diferentes ligações que estabelecem entre si para formar estruturas ramificadas e mais complexas. Existem vários tipos de glicosilação, no entanto, nas proteínas, a N e a O-glicosilação são os mais comuns. Estes dois processos diferem essencialmente no local de ligação à proteína, isto é, no aminoácido ao qual irá ficar ancorado o glicano, e no processamento das estruturas ramificadas.
Cada célula ou tecido, bem como diferentes estágios do desenvolvimento celular, têm uma identidade própria no que se refere aos glicanos que são produzidos. Por sua vez, os glicanos desempenham diversas funções nos mais diversos processos biológicos. Por exemplo, existem glicoproteínas, ou seja, proteínas às quais estão ligados glicanos, com funções fundamentais ao nível do reconhecimento celular, da adesão, da sinalização e até mesmo do próprio folding. Uma proteína pode transportar mais do que um padrão de glicosilação.
Tendo em conta a enorme importância dos glicanos nas funções biológicas, é natural que alterações nos processos de glicosilação sejam responsáveis por comprometer o correto funcionamento dessas mesmas funções ao nível celular, o que muitas das vezes resulta, por exemplo, em defeitos ao nível da adesão celular, com comprometimento da homeostase e do funcionamento dos tecidos. Assim sendo, a expressão de padrões de glicosilação aberrantes está associada ao cancro e é responsável por um aumento da sua malignidade, o que se traduz num rápido avanço na progressão tumoral e na formação de metástases, a principal causa de morte em cancro. Desta forma, defeitos nos padrões de glicosilação estão relacionados com um mau prognóstico em diversos tipos de cancro, entre eles, o cancro de colon, mama e pulmão.
Um dos padrões de glicosilação fortemente associado ao aumento da malignidade tumoral e da metástase é o sialil-Lewis x/a, na maioria das vezes ancorado a glicoproteínas que também desempenham um papel fundamental na progressão tumoral. Por exemplo, a Mucina 1, cuja expressão aumentada e a sua glicosilação alterada, têm sido reportadas em vários tipos de cancro, em especial, no cancro de colon e no cancro da mama. O sialil-Lewis x/a é ainda fundamental no reconhecimento da E-seletina, uma glicoproteína transmembranar muito glicosilada com funções de adesão, cuja expressão é fortemente influenciada pelos indicadores de inflamação, como por exemplo citocinas pró-inflamatórias, entre as quais a IL-1β. A grande maioria dos ligandos de E-seletina expressam este glicano sialofucosilado que, ao reconhecer a E-seletina expressa nas células endoteliais, diminuem o rolamento das células tumorais, aumentam a sua adesão dando-se início à invasão dos tecidos por essas células. A fucose é fundamental neste processo de reconhecimento, bem como os aminoácidos adjacentes e a presença de cálcio. Neste processo estão também envolvidos outros fatores, como por exemplo, os fatores angiogénicos que induzem a proliferação das células endoteliais e o aumento da permeabilidade endotelial, facilitando a entrada, nos tecidos, das células tumorais em circulação. Também na transição epitélio-mesenquima estes padrões de glicosilação parecem desempenhar um papel importante. Este processo consiste num programa celular e molecular em que as células epiteliais vão progressivamente diminuindo a expressão dos seus marcadores epiteliais, como as citoqueratinas e as E-caderinas, e aumentando a expressão dos seus marcadores mesenquimas, nomeadamente, a fibronectina e a vimentina. Assim sendo, as células vão progressivamente perdendo a adesão, descolam-se das massas tumorais primárias e entram em circulação. Por conseguinte, a expressão aumentada de ligandos de E-seletina, bem como de sialil-Lewis x/a, está relacionada com o aumento da progressão tumoral, nomeadamente, da invasão e da metástase.
iv O estudo destes padrões de glicosilação aberrante é fundamental uma vez que estão associados a uma maior malignidade, a um mau prognóstico e, por conseguinte, a uma menor sobrevivência em cancro. Nesta tese, temos como principais objetivos avaliar a expressão de padrões de glicosilação aberrante em tecidos de cancro, identificando novos biomarcadores como potenciais alvos terapêuticos, nomeadamente candidatos a proteínas scaffold que transportem esses padrões de glicosilação, e ainda, avaliar esses padrões em modelos experimentais, designadamente em linhas celulares, de forma a compreender a função desses glicanos, bem como da fucosilação, na progressão tumoral e na metástase. Identificámos estes padrões de glicosilação expressos em tecidos de cancro de colon e de cancro de mama, e através dos ensaios nas linhas celulares, mostrámos que a inibição da fucosilação, utilizando o inibidor 2-fluorofucose, é responsável por diminuir a expressão dos mRNAs das fucosiltransferases (FUT II, FUT IV, FUT V, FUT X e FUT XI) envolvidas na síntese dos antigénios de Lewis, bem como dos próprios ligandos sialofucosilados, como o sialil-Lewis x/a, que revestem glicoproteínas importantes, do ponto de vista funcional, entre as quais a Mucina 1, que também mostrámos estar expressa em tecidos tumorais e com padrões de glicosilação aberrante associados. Mais ainda, esta diminuição parece interferir com os componentes estruturais do citoesqueleto, nomeadamente, as citoqueratinas, que fazem parte dos filamentos intermédios, e cuja expressão, não só é aumentada, como o padrão de expressão é diferente em diferentes linhas celulares de cancro, sugerindo que a fucosilação afeta de forma diferente, diferentes citoqueratinas, confirmando que estas proteínas são uteis como biomarcadores que permitem caracterizar células e estágios tumorais. Relativamente à Mucina 1, verificámos que a inibição da fucosilação aumenta a expressão da sua forma sub-glicosilada que por sua vez fica retida no citosol, confirmando o papel da fucosilação no transporte para a membrana e reforçando uma possível função da Mucina 1 ao nível das vias de sinalização intracelular.
Além disso, a inibição da fucosilação foi também responsável por diminuir a expressão de fibronectina, um importante componente da matriz extracelular, com funções em processos fundamentais em cancro como a transição epitélio-mesenquima. A fibronectina é um marcador mesenquimal cuja expressão fica diminuída, enquanto que as citoqueratinas, um marcador epitelial, aumentam a sua expressão em resposta à inibição da fucosilação. Desta forma, a inibição da fucosilação parece ser capaz de retardar a entrada das células tumorais no programa de transição epitélio-mesenquima.
Estas alterações fenotípicas são capazes de diminuir a capacidade proliferativa e a migração das células tumorais, bem como atuar ao nível das vias de sinalização através da modelação, por um lado, da expressão de fatores de crescimento envolvidos na progressão do ciclo celular, no crescimento tumoral, na angiogénese e na invasão, como os fatores TGF-β (Transforming Growth Factor β), FGF2 (Fibroblast Growth Factor 2) e VEGF-A (Vascular Endothelial Grwoth Factor A), e por outro, na expressão de citocinas pró-inflamatórias, entre as quais a IL-1β e a IL-6. Ou seja, o contexto ao nível do microambiente tumoral é alterado, por consequência do tratamento com o inibidor de fucosilação, o que tem implicações em duas das principais características das células tumorais, a proliferação e a migração, e por conseguinte, na progressão tumoral e na metástase.
No conjunto, os nossos resultados, além de confirmarem a importância dos ligandos de E-seletina ao longo do desenvolvimento tumoral, sugerem que a inibição da fucosilação, além de diminuir a expressão de padrões de glicosilação aberrantes, neste caso o sialil-Lewis x/a, é capaz de induzir um conjunto de alterações morfológicas e fenotípicas, nomeadamente ao nível das citoqueratinas, da fibronectina e da Mucina1, que poderão conduzir ao restauro de um fenótipo menos agressivo no que diz respeito ao desenvolvimento tumoral, nomeadamente a invasão e a metastização tumorais, ou seja, é capaz de retardar a progressão tumoral.
Uma melhor compreensão destas características e propriedades poderão vir a ser exploradas no estudo e no desenvolvimento de novas terapias que tenham como alvo terapêutico as fazes iniciais da metastização, como a transição epitélio-mesenquima, e a fucosilação.
v Palavras Chave:
vi Index
Acknowledgements ... i
Abstract ... ii
Resumo ... iii
Index of figures and tables ... viii
List of abbreviations ... x
1. Introduction ... 1
1.1. Glycosylation ... 1
1.1.1. N-glycosylation and O-glycosylation ... 1
1.2. Cancer ... 2
1.3. Glycosylation and cancer ... 3
1.3.1. Lewis antigens - Sialyl-Lewis A and Sialyl-Lewis X ... 3
1.3.2. Aberrant glycosylation and Metastasis ... 4
1.3.2.1. sLex/a as E-selectin ligands ... 5
1.3.2.2. Glycoproteins as E-selectin ligands in Cancer ... 6
1.4. Epithelial-Mesenchymal Transition (EMT), Invasion and Metastasis ... 6
1.5. Introduction to the aims of this thesis... 7
2. Materials and Methods ... 8
2.1. Histological analysis ... 8
2.2. Cell culture ... 8
2.3. 2-Fluorofucose treatment ... 9
2.4. Flow cytometry ... 9
2.5. Immunofluorescence ... 10
2.6. SDS-PAGE and Western blot ... 10
2.7. Gene expression analysis – RT-qPCR ... 10
2.8. Cell proliferation measurement ... 11
2.9. Wound-healing migration assay ... 11
3. Results ... 12
3.1. E-SL and sLex/a antigens are expressed in colon and breast cancer tissues ... 12
3.2. Colorectal and breast cancer tissues analysis for relevant biomarkers... 13
3.3. Expression of E-SL and sLex/a epitopes in cancer cell lines ... 14
3.4. Treatment with 2-FF decreases sLex/a and increases CK expression. ... 16
3.5. MUC1 is a potential scaffold protein in initiating cancer progression and metastases 18 3.6. Inhibition of fucosylation decreases cell proliferation and migratory capacity ... 19
3.7. Fucosylation increases growth factors and proinflammatory cytokines expression in cancer cells ... 19
vii
4. Discussion ... 24
5. Conclusion and Future perspectives ... 29
6. References ... 30
viii Index of figures and tables
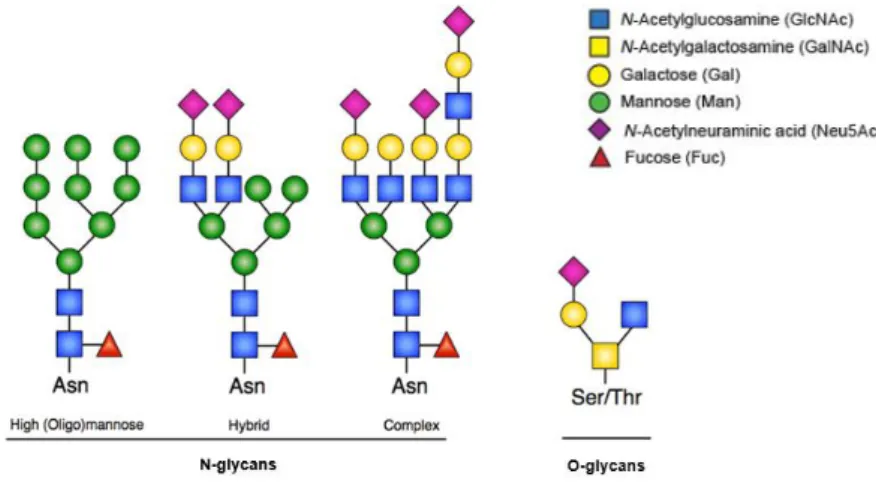
Figure 1.1 – N-glycan and O-glycan structures. N-linked glycosylation occurs through consensus Asn residues whereas O-linked glycosylation occurs through Thr or Ser amino acids. Three different N-glycans share a common core structure. Adapted from Lyons, Milner and Rosenzweig (2015)27. ... 2
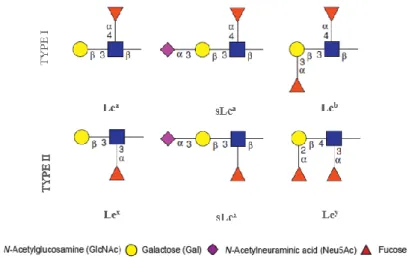
Figure 1.2 – Lewis antigens. They are a group of glycans that carry a Fuc linked to GlcNAc residue. In sialylated forms a sialic acid residue are added to terminal Gal residue. Adapted from Juge (2012)54.
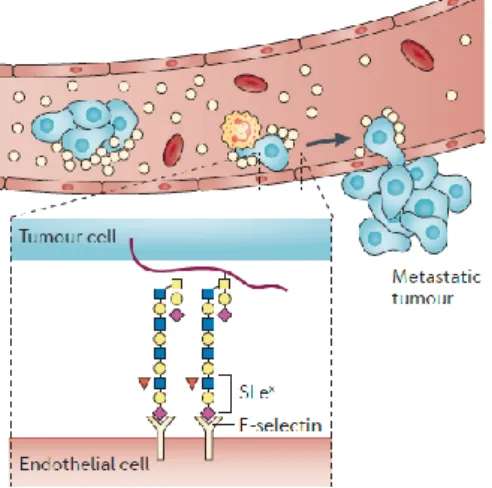
... 4 Figure 1.3 – sLex/a in cancer progression and metastasis. sLex/a expressed in tumour cells plays a role
in extravasation and tissue invasion by recognizing receptors, namely E-selectin, expressed in endothelial cells. Adapted from Pinho and Reis (2015)44. ... 5
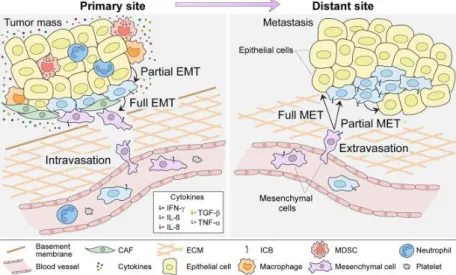
Figure 1.4 – Epithelial-Mesenchymal Transition network. Primary tumour cells start to increase the expression of mesenchymal markers due to the presence of proinflammatory cytokines in the tumoral microenvironment where CAF, MDSC, Macrophages and infiltrated Neutrophils are also present. After undergoing in EMT stage, cancer cells can degrade ECM, go into bloodstream and migrate do distant sites, where, through E-selectin interactions, they colonize new tissues, start do increase the expression of epithelial markers and form new tumour masses, the metastasis. Taken from Sistigo and Nisticò (2017)95. CAF – Cancer-associated fibroblast; MDSC – Myeloid-derived suppressor cell; ICB – Immune
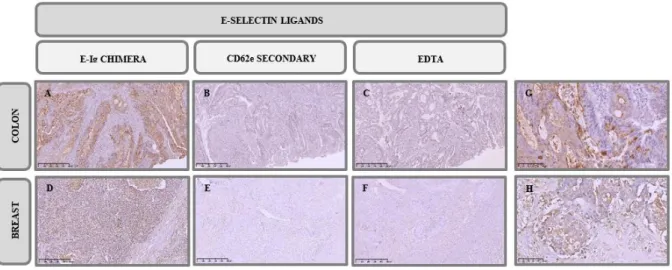
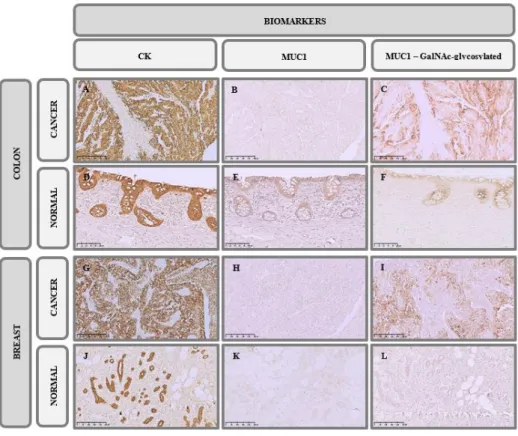
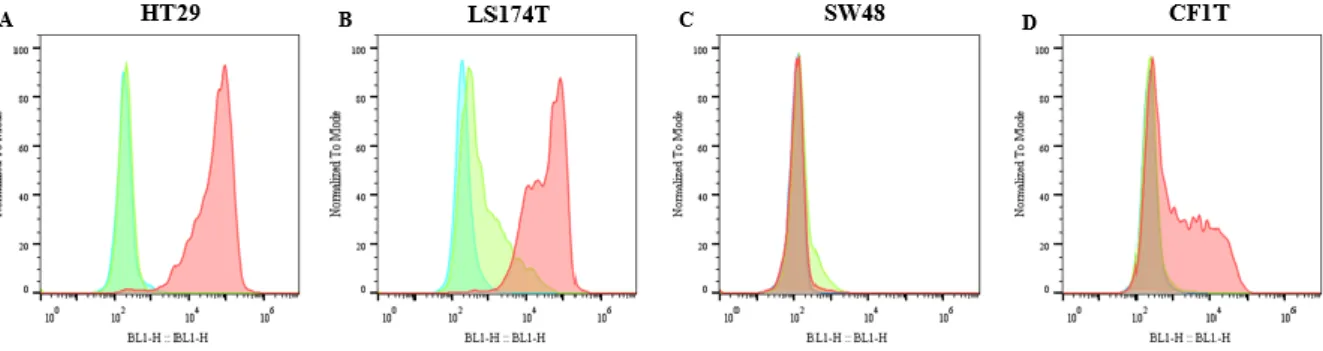
checkpoint blocker; MET – Mesenchymal-epithelial transition; ... 7 Figure 3.1 – Immunohistochemistry analysis of E-SL expression in cancer tissues. IHC staining of A. colon adenocarcinoma and D. TNBC tissues with E-Ig chimera (100X). For control, staining was performed B. E. in the absence of E-Ig and C. F. in the presence of EDTA, a calcium chelant (100X). In G. and H. is represented the same as in A. and D. but with higher magnification (400X). Brown colour indicates E-Ig positive reactivity. From A. to F. scale bar represents 500 μm while in G. and H. represents 100 μm. ... 12 Figure 3.2 – Immunohistochemistry analysis of sLex/a expression in cancer tissues. IHC staining of colon adenocarcinoma tissues with A. HECA-452 mAb, B. anti-CD15s mAb and C. anti-CA19.9 mAb, and TNBC tissues with D. HECA-452 mAb, E. anti-CD15s mAb and F. anti-CA19.9 mAb (100X). Brown colour indicates antibodies positive reactivity. Scale bar represents 500 μm... 13 Figure 3.3 - Immunohistochemistry analysis of CK and MUC1 expression in cancer tissues. IHC staining of colon adenocarcinoma tissues with A. anti-CK mAb B. anti-MUC1 (VU4H5) mAb and C. anti-MUC1 (5E5) mAb, and TNBC tissues with G. anti-CK mAb H. anti-MUC1 (VU4H5) mAb and I. anti-MUC1 (5E5) mAb (100X). Normal colon tissue (D-F) (200X) and breast tissue (J-L) (100X) stained with the same antibodies are also represented. Brown colour indicates antibodies positive reactivity. Scale bar represents 500 μm except in D., E. and F. where it represents 250 μm. ... 14 Figure 3.4 - Immunohistochemistry analysis of proliferative markers in cancer tissues. IHC staining of A. colon adenocarcinoma and B. TNBC tissues with anti-Ki-67 mAb (200X). Brown colour indicates Ki-67 positive reactivity. Scale bar represents 100 μm. Selected area with 400X magnification. ... 14 Figure 3.5 - E-SL expression in cancer cell lines. Flow cytometry analysis of E-SL expression in A. HT29, B. LS174T, C. SW48 and D. CF1T cell lines. Cancer cell lines were stained with E-selectin -Ig chimera (red). Unstained cells (blue) and EDTA (green) are also shown as a control. The xx axis represents fluorescence intensity of the fluorophore and yy axis represents the normalized event count. ... 15 Figure 3.6 - sLex/a expression and cellular distribution in cancer cell lines. A. Western blot analysis of sLex/a expression in HT29, LS174T, SW48 and CF1T cell lines. Cell lysates was resolved by
SDS/PAGE electrophoresis and immunoblotted with HECA-452 mAb which recognizes sLex/a epitopes.
kDa = kilodalton B. Fluorescence microscopy images of sLex/a epitopes. On the first line is presented
sLex/a labelled with FITC antibody (green), on second line nuclei stained with DAPI (blue) and on the
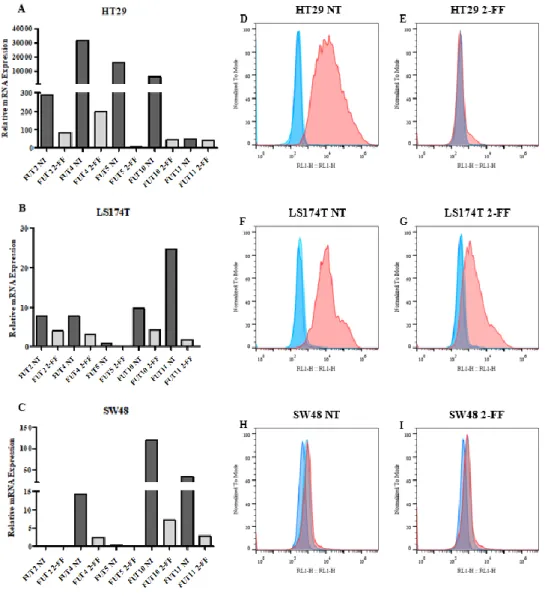
ix Figure 3.7 - Effect of fucosylation inhibitor in sLex/a expression. A-C. RT-qPCR analysis of FUTs gene expression in A. HT29, B. LS174T and C. SW48 cell lines treated with 2-FF inhibitor (2-FF) or not (NT) for 5 days. Values correspond to the amount of mRNA copies of each FUT per 1000 mRNA copies of β-actin and GAPDH housekeeping genes. NT = not treated. D-I. Flow cytometry analysis of sLex/a expression after 2-FF treatment. In D. HT29 F. LS174T and H. SW48 cell lines were not treated
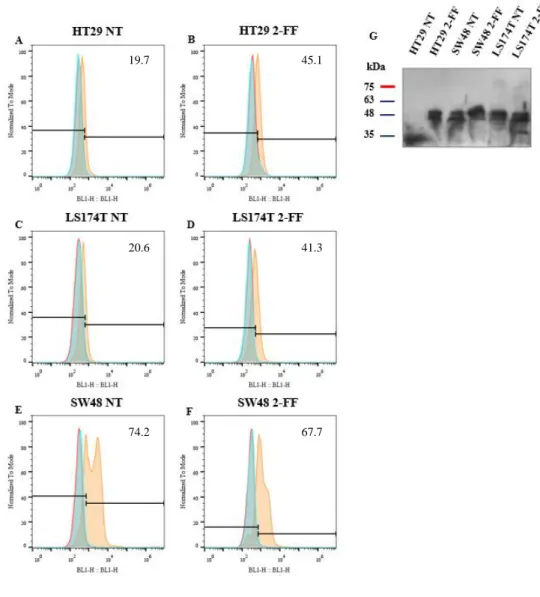
and in E. HT29, G. LS174T and I. SW48 cells were treated with 2-FF inhibitor. Cancer cell lines were stained with HECA-452 mAb (red) or only with secondary antibody (light blue). Unstained cells (dark blue) are also shown. The xx axis represents fluorescence intensity of the fluorophore and yy axis represents the normalized event count. ... 17 Figure 3.8 - Effect of fucosylation inhibitor in CK expression. A-F. Flow cytometry analysis of CK expression after 2-FF treatment. In A. HT29 C. LS174T and E. SW48 cell lines were not treated and in B. HT29, D. LS174T and F. SW48 cells were treated with 2-FF inhibitor. Cancer cell lines were stained with pan-CK (AE1/AE3) mAb (orange) or only with secondary antibody (light blue). Unstained cells (red) are also shown. The xx axis represents fluorescence intensity of the fluorophore and yy axis represents the normalized event count. G. WB analysis of CK expression in HT29, LS174T and SW48 cell lines. Cell lysates was resolved by SDS/PAGE electrophoresis and immunoblotted with pan-CK (AE1/AE3) mAb which recognizes type I and type II CK. NT = not treated. kDa = kilodalton ... 18 Figure 3.9 - MUC1 expression analysis in cancer cell lines. A-F. Flow cytometry analysis of MUC1 expression after 2-FF treatment. In A. HT29 C. LS174T and E. SW48 cell lines were not treated and in B. HT29, D. LS174T and F. SW48 cells were treated with 2-FF inhibitor. Cancer cell lines were stained with anti-MUC1 (VU4H5) mAb (pink) or only with secondary antibody (light blue). Unstained cells (red) are also shown. The xx axis represents fluorescence intensity of the fluorophore and yy axis represents the normalized event count. G. Fluorescence microscopy images of MUC1. On the first line is presented MUC1 labelled with FITC antibody, on second line nuclei stained with DAPI (blue) and on the third line merged image. Scale bar: 1 μm. NT = not treated. H. Cell fluorescence quantification. I. WB analysis of secreted MUC1 in HT29, LS174T and SW48 cell lines. The supernatants of all cell lines at 24 h, 48 h, 72 h and 120 h were resolved by SDS/PAGE electrophoresis and immunoblotted with anti-MUC1 (VU4H5). Not supplemented DMEM and L15 cultures medium were used as control. h = hours. kDa = kilodalton ... 20 Figure 3.10 - Inhibition of fucosylation reduced cell proliferation rates and cell migration capacity. A-F. Effect of 2-FF treatment on cell lines proliferation determined by CFSE dilution method and analysed by flow cytometry. In A. HT29 C. LS174T and E. SW48 cell lines were not treated and in B. HT29, D. LS174T and F. SW48 cells were treated with 2-FF inhibitor. Cells were in culture during 24 h (light blue), 48 h (orange), 72 h (green), 96 h (purple) and 120 h (pink) and then analysed. Unstained cells (red filled curve) are also shown. The xx axis represents fluorescence intensity of the fluorophore and yy axis represents the normalized event count. G. Cancer cell lines proliferation indexes. H. Cancer cell lines migration capacity. NT = not treated ... 21 Figure 3.11 - Growth factors and proinflammatory cytokines expression in cancer cell lines. RT-qPCR analysis of A. TGF-β, B. FGF2 and C. VEGF-A growth factors and D. IL-1β and E. IL-6 proinflammatory cytokines gene expression in HT29, LS174T and SW48 cell lines treated with 2-FF inhibitor (2-FF) or not (NT). Values correspond to the amount of mRNA copies of each marker per 1000 mRNA copies of β-actin and GAPDH housekeeping genes. NT = not treated. n.d. = not detected ... 22 Figure 3.12 - Inhibition of fucosylation reverses the expression of EMT markers. Fluorescence microscopy images of A. fibronectin and B. CK. On the first line is presented fibronectin or CK labelled with FITC antibody, on second line nuclei stained with DAPI (blue) and on the third line merged image. Scale bar: 1 μm. NT = not treated. In C. and D. are represented the cell fluorescence quantification of fibronectin and CK, respectively. ... 23
x List of abbreviations
2-FF – 2-Fluorofucose APC - Allophycocyanin Asn – Asparagine
BSA – Bovine Serum Albumin Ca2+ - Calcium ion
cDNA – complementary Deoxyribonucleic Acid CFSE - Carboxyfluorescein Succinimidyl Ester CK – Cytokeratin (s) CR – Consensus Repeats CRC – Colorectal cancer Ct – Threshold cycle DAB - 3,3’-Diaminobenzidine DAPI - 4’,6-diamidino-2-phenylindole DMEM - Dulbecco’s Modified Eagle Media DMSO - Dimethyl sulfoxide
dNTP (s) – Deoxynucleotide (s) ECM – Extracellular Matrix
EDTA - Ethylenediaminetetraacetic acid EGF – Epidermal Growth Factor
EGFR - Epidermal Growth Factor Receptor EMT – Epithelial-Mesenchymal Transition ER – Endoplasmic Reticulum
E-SL – E-selectin Ligands FBS – Fetal Bovine Serum FITC - Fluorescein Fuc - Fucose
FUT (s) – Fucosyltransferase (s) Gal – Galactose
xi Glc - Glucose GlcNAc – N-Acetylglucosamine GT (s) – Glycosyltransferase (s) h – hour HRP – Horseradish peroxidase IDC – Invasive Ductal Carcinoma IF – Immunofluorescence
Ig (s) – Immunoglobulin (s) IHC - Immunohistochemistry IL- Interleukin
kDa - kilodalton
Lea/b/x/y – Lewis a/b/x/y antigen mAb (s) – Monoclonal antibody (ies) Man – Mannose
MET - Mesenchymal-Epithelial Transition MUC – Mucin
mRNA – Messenger RNA n.d. – Not detected
Neu5Ac – N-acetylneuraminic acid N-GalNAc – N-Acetylgalactosamine NT – Not treated
PBS – Phosphate Buffered Saline PCR – Polymerase Chain Reaction
ppGalNAcT – Acetyl-galactosaminyltransferase PVDF - Polyvinylidene fluoride
qPCR – quantitative Polymerase Chain Reaction RNA – Ribonucleic Acid
RT – Room temperature / Reverse Transcriptase
SDS-PAGE – Sodium dodecyl sulfate – polyacrylamide gel electrophoresis Ser- Serine
xii ST (s) – Sialyl1transferase (s)
ST3GAL (s) – β-galactoside α2,3 sialyltransferase (s) STn – Sialyl-Tn
TACA – Tumour-associated Carbohydrate Antigens TBST – Tris-buffered Saline Solution-Tween TGF-β - Transforming Growth Factor – β Thr – Threonine
TNBC – Triple Negative Breast Cancer TNF-α - Tumour Necrosis Factor α
VNTR - Variable Number of Tandem Repeats WB – Western blot
1 1. Introduction
1.1. Glycosylation
Carbohydrates are one of the organic macromolecules that compose living systems1. The surface of
eukaryotic cells is decorated externally by a dense matrix of glycosidic structures – the glycocalyx, with important biological functions2. Generally, we use the word glycan to describe free or covalently bound
saccharide residues which form the glycoconjugates3. The great glycan’s structural diversity results from
the different types of sugars that compose them, and the different types of bonds established between them4. Each type of cell and tissue has its own identity with regard to glycans which are expressed, in
addition, certain patterns of glycosylation are characteristic of certain stages of development and cell or tissue differentiation5. We call Glycome to the set of all glycans that can be synthesized by an organism6.
Glycans are involved in several cellular functions since structural stability to cell-cell and cell-matrix interactions, as well as cell signalling and even in maintenance of protein folding7,8,9,10.Glycosylation is
not template driven, but may be considered as secondary gene products. In fact, its synthesis is dependent on the expression of genes that encode for certain enzymes and carriers11.
Glycosylation is one of the main post-translational modifications in eukaryotes and consists in the enzymatic addition of glycans to non-glycosidic structures such as proteins and lipids12,13. The
glycosyltransferases (GT) are key enzymes in glycans’ biosynthesis, they act sequentially and are specific to the sugar donor, but can recognize different acceptors, they are classified depending on the sugar they transfer14. Glycosidases are also important in the glycosylation process, these enzymes are
involved in the removal of sugars during the processing of glycans15. Glycosylation occurs essentially
in the Endoplasmic Reticulum (ER) and in the Golgi Apparatus, however, important modifications also occur in the cytoplasm, the cell membrane and in the extracellular matrix (ECM)16. Most of the GTs and
the glycosidases are associated to the ER – cis/trans Golgi network17, and their expression levels,
location and specificity are factors that determine glycosylation patterns18.
1.1.1. N-glycosylation and O-glycosylation
Proteins containing one or more covalently linked glycans to their polypeptide chains are designated as glycoproteins13. There are two fundamental types of protein glycosylation12: N-glycosylation, where are
produced glycans linked to the amide group of the Asparagine residue (Asn) in the lateral chains of the proteins, and O-glycosylation where glycans are bound to the hydroxyl group of Threonine (Thr) or Serine (Ser) residues19,20. Generally, and unlike the O-glycans, the N-glycans are larger and processed
structures21 (Figure 1.1). Different types of glycosylation can be present in the same glycoprotein22.
Focusing on N-glycosylation, about 90% of eukaryotic glycoproteins are N-glycosylated23. The
biosynthesis of N-glycans starts at the ER with the formation of an oligosaccharide precursor bounded to the dolichol phosphate, a lipid transporter initially on the cytosolic face of the reticular membrane, where, before turning to the reticular lumen, N-Acetylglucosamine (GlcNAc) and Mannose (Man) residues are added. Once on the luminal side, Glucose (Glc) is added, and the precursor is transferred in block, by the action of oligosaccharyltransferases, to a nascent protein, forming an N-glycosidic bond between a GlcNAc and an Asn residue that integrates a consensus sequence Asn-X-Ser/Thr (where X can be any amino acid except Proline)24. In the next step, the N-linked glycan is processed by the action
2 trimming, and then others are added – extension. This step takes place initially in the ER and later in the Golgi25,26.
Figure 1.1 – N-glycan and glycan structures. N-linked glycosylation occurs through consensus Asn residues whereas
O-linked glycosylation occurs through Thr or Ser amino acids. Three different N-glycans share a common core structure. Adapted from Lyons, Milner and Rosenzweig (2015)27.
In O-glycosylation, the biosynthesis of O-glycans occur in Golgi by the sequential action of different GTs, whose arrangement influences the pattern of the O-glycan produced28. The first step consists in the
transfer and attachment of N-Acetylgalactosamine (N-GalNAc) to the hydroxyl group of the amino acid Thr or Ser in the protein by the action of Acetyl-galactosaminyltransferase (ppGalNAcT) forming the simplest structure, the Tn antigen, from which the chains are extended by the action of GTs and forming more complex structures29. During chains extension, even structures common to N-glycosylation can be
formed, for example the sLex/a 30, this epitope will be better characterized in section 1.3.1.
In cancer, the sialylation is increased31 and the Tn antigen can be modified, forming the Sialyl-Tn (STn)
antigen32. Short O-glycan structures are common features in cancer33.
1.2. Cancer
According to the World Health Organization (WHO), cancer is one of the leading causes of death in the world, having been responsible for 8.8 million deaths in 2015 and 9.6 million people worldwide are estimated to die from cancer in 201834. In Portugal, the incidence of cancer has increased about 3% per
year and was responsible for the deaths of about 27000 patients in 201535. It is estimated that in 2030
Portugal may reach 60000 new cases of cancer. Among the most lethal cancers are lung, colorectal, stomach, prostate and breast cancer36. Currently, between 30-50% of cancers can be prevented avoiding
risk factors like tobacco, alcohol, diet and sedentary lifestyle and implementing strategies for prevention and early diagnosis34.
Cancer cells break the rules by which multicellular organisms are built and maintained37. The gradual
process of transformation of a normal cell into a cancer cell is called cancerigenesis.
Cancer begins with genetic mutations and epigenetic changes as a result of cell exposure to chemical, physical and biological carcinogenic agents38. These mutations can lead to activation of oncogenes and
inactivation of tumour suppressor genes, cell proliferation and survival are altered, resulting in an uncontrolled division and reduction or inhibition of cell death. Cancer cells become immortal giving
3 rise to an accelerated increase of the cell population that continues to accumulate mutations39. Local
tissues invasion follows as a result of changes in cell adhesion of primary tumour cells and then the spread of those cells to other sites through the circulatory and lymphatic system. Cancer cells are able to survive in circulation and colonize new tissues establishing new cellular interactions and forming metastasis that can become highly invasive. Metastasis consists in the formation of the tumour at new sites as a result of the migration of cancer cells from an initial focus40. Metastasis is the leading cause
of death in cancer41.
In 2010, the so-called Hallmarks of cancer, initially proposed by Hanahan and Weinberg in 2000, were reviewed. These consist of a set of acquired features that allow to characterize the cancer cells during tumour development. It was established as Hallmarks of cancer: sustained proliferative signalling, evade growth factors, resistance to cell death, unlimited replication capacity, reprogrammation of energy metabolism, angiogenesis induction, evading the immune response and tissues invasion and metastasis. Facilitating the establishment of all these features are the genomic instability and the inflammation as well as the tumour microenvironment that has given a new dimension and complexity to the cancerigenesis process42.
1.3. Glycosylation and cancer
Aberrant cancer associated glycosylation patterns were first described more than 45 years ago43. In fact,
during the tumour progression there are significant alterations in glycosylation patterns that are responsible for a significant increase in tumour malignancy44. It is clear that they play an important role
in cancer progression, particularly in signalling pathways and metastasis45,46,47. Certain changes in
glycosylation patterns are strongly related to prognosis in cancer.
There are several mechanisms that can lead to an aberrant glycosylation pattern also called tumour-associated carbohydrate antigens (TACA)48. These are characterized by the presence of incomplete or
truncated glycans, the increase or loss of glycans expression or even the appearance of new structures. To these patterns are also associated changes in the levels of GTs expression and activity as well as changes in sugar transport molecules and consequent accumulation of precursors4549.
Among the TACA we can distinguish the Lewis antigens, in particular sLex and sLea, which can be
present in N- and O-glycans and the Thomsen-Freidenreich antigens, which are truncated O-glycans and include the sialylated form of the Tn antigen, the STn48.
Considering the significant importance of glycosylation, alterations in their expression patterns compromise certain cellular functions, namely cell adhesion and cellular interaction with consequences in invasion and cancer metastasis44,47
1.3.1. Lewis antigens - Sialyl-Lewis A and Sialyl-Lewis X
Lewis antigens are terminal epitopes, normally on cell surface glycoproteins, which constitute a group of loading a α 1,3/4 fucose residue bound to GlcNAc. They are present in both N-glycans and O-glycans and are synthesized by N-acetylglucosaminyltransferases, galactosyltransferases, sialyltransferases (STs) and fucosyltransferases (FUTs)50,51.
4 Structurally, they are tetrasaccharides with a Gal-β(1,3/4)-GlcNAc-R backbone. In type I chains (Lea,
sLea and Leb) the bound is β1,3 while in type II chains (Lex, sLex and Ley) is β1,4. Both types contain a
fucose (Fuc) residue bound to GlcNAc, transferred by FUTs. FUTs can be grouped into three subgroups, α1,2 FUTs, α1,3/4 FUTs and α1,6 FUTs. α1,3/4 FUTs are especially involved in the last stages of Lewis antigens synthesis43,52. In fact, in case of Lewis antigens, Fuc is α1,4 bound in type I and α1,3 in type II
chains. In type I chain, the addition of a Fuc is catalysed by FUT III while in type II chain the FUTs III, IV, V, VI, VII and IX are involved. Finally, terminal galactose (Gal) can be sialylated or fucosylated. In the case of sialylation, which consists in the addition of a sialic acid residue (the N-acetylneuraminic acid (Neu5Ac) is the most common in humans), are involved STs, specially the β-galactoside α2,3 sialyltransferases (ST3GAL), with sLex and sLea formation. If galactose is fucosylated we have the
synthesis of Leb and Ley by FUT I and FUT II (Figure 1.2)50,53.
Figure 1.2 – Lewis antigens. They are a group of glycans that carry a Fuc linked to GlcNAc residue. In sialylated forms a
sialic acid residue are added to terminal Gal residue. Adapted from Juge (2012)54.
Increased expression of sLex/a has been reported in certain types of cancer, such as colon and breast
cancers, and this overexpression is associated with poor prognosis50,55,56,57. Sialylation and fucosylation
have also been implicated in malignant transformation, especially the changes in the levels of STs and FUTs expression, which has been reported in some types of cancer58,59,60.
1.3.2. Aberrant glycosylation and Metastasis
The extravasation of cancer cells to new tissues and distant organs is a fundamental step in tumour invasion and metastasis40. These cells use a process similar to the migration and extravasation of
leukocytes, to invade and colonize new sites61.
Circulating cancer cells need to slow down and create new interactions with endothelial cells in the tissues that they will colonize. Selectins and its ligands, as well as their glycosylation patterns, play an important role in the establishment of these interactions62,63.
5 1.3.2.1. sLex/a as E-selectin ligands
The selectins are glycoproteins present on the cell surface with adhesion functions. They are a family of three calcium-dependent lectins (Type C) which, in addition to transmembrane domain and a short C-terminal cytoplasmic tail, have an N-teminal lectin domain, an Epidermal Growth Factor (EGF)-like domain and a variable number of Consensus Repeats (CR)64. This structure is highly conserved in
mammals65. Depending on where they are expressed, the selectin is called E-selectin (endothelium),
L-selectin (lymphocyte) or P-L-selectin (platelets)64.
E-selectin (CD62e, ELAM-1, LCAM-2), expressed in the activated endothelium, are highly glycosylated transmembrane glycoproteins whose interactions with their sialofucosylated ligands, proteins or lipids, results in decreased rolling and increased cell adhesion, with the establishment of new cell-cell interactions, where Integrins are also involved66,67. The expression of E-selectin, also a marker
of inflammation, is induced by proinflammatory cytokines such as Interleukin-1β (IL-1β) and Tumour Necrosis Factor α (TNF-α)68,69. Cancer cells are able to secrete proinflammatory cytokines, generating
inflammation sites42 and inducing the expression of E-selectin in endothelia, which in turn recognize
their ligands expressed on cancer cells surface. So, cancer cells are recruited and the transendothelial migration and adhesion cascade begins67.
Figure 1.3 – sLex/a in cancer progression and metastasis. sLex/a expressed in tumour cells plays a role in extravasation and tissue invasion by recognizing receptors, namely E-selectin, expressed in endothelial cells. Adapted from Pinho and Reis (2015)44.
E-selectin ligands (E-SL) are generally transmembrane glycoproteins with sialylated and fucosylated structures64. sLex and sLea are two recognizing E-selectin motifs and are part of the proteins and lipids
scaffolds able of binding to E-selectin. Fuc, which interacts with calcium ion (Ca2+) and some amino
acids near the selectin lectin domain, is an essential component for recognition and binding to E-selectin65,70 (Figure 1.3).
Thus, increased expression of sLex/a, as well as E-SL, in tumour cells is strongly related to the metastatic
potential and tumour growth and invasion, being these indicators of malignancy and poor prognosis71,72.
In addition, the increase of E-selectin expression by endothelial cells near metastasis sites also facilitates the extravasation of these cancer cells and tissues colonization64,66.
6 1.3.2.2. Glycoproteins as E-selectin ligands in Cancer
For E-selectin recognition, besides the glycans structure, also the scaffold protein decorated with this glycan plays an important role73. In fact, the role of sLex/a-decorated glycoproteins has been reported in
cancer65,70.
Mucins are a group (MUC1-9) of large glycoconjugates that correspond to strongly O-glycosylated and moderately N-glycosylated proteins that can be soluble, secreted or transmembrane74. When present in
the membranes, they fill the apical surfaces of epithelial cells, especially in the respiratory and gastrointestinal tract, where their distribution follows a specific pattern that characterize these tissues. They protect the organs from infections75. Mucins can exhibit aberrant glycosylation76 patterns and play
an important role in cancerigenesis77.
Mucin 1 (MUC1) is an important cancer associated antigen that is overexpressed in some types of adenocarcinoma, like colon and breast cancer76 and is also implicated in binding to E-selectin78.
O-glycosylation of MUC1 is well characterized in several cell types and tissues unlike N-glycosilation that occurs only in five sites, where just one is extracellular, and which seems to be important for their folding and transport79. In tumour context, the expression of an altered MUC1 interferes, not only with
its biochemical functionality, but also with its distribution76. In cancer cells, MUC1 also participates in
the signal cascades regulating the expression of target genes. For example, MUC1 interacts with β-catenin through phosphorylation of its cytoplasmic tail. Overexpression of MUC1 also attenuates apoptosis through Akt (Protein kinase B) or p53 pathways80.
MUC1 also appears to be implicated in the triggering of the epithelial-mesenchymal transition (EMT) as a result of biochemical changes that lead to loss of cell polarity that increases tumour invasiveness and metastatic potential76,80,81.
1.4. Epithelial-Mesenchymal Transition (EMT), Invasion and Metastasis
The EMT is a molecular and cellular developmental regulatory program in which cells that are initially part of tissue layers acquire the ability to move82. Cancer cells are able to use part of this transition
mechanism for epithelial cells of primary tumours undergo morphological and phenotypic changes, such as loss of adhesion, and acquire a migratory capacity that allows them to invade distant tissues and organs, forming metastasis83. Thus, cells submitted to EMT appear to be intended to migrate42.
This transition mechanism, induced by growth factors like Transforming Growth Factor – β (TGF-β), involves changes in the expression of certain genes, namely the activation of genes encoding for mesenchymal markers, such as Vimentin and Fibronectin, and downregulation of epithelial markers like Cytokeratins (CK), an important component of intermediate filaments, E-cadherins and MUC182,84.
These alterations lead cytoskeleton reorganization and consequent changes in cell polarity. In addition, there are loss of epithelial adhesion and synthesis of components that modify the composition of ECM, affecting tissue structure and cellular communication. Thus, EMT is associated with increased metastatic potential85.
Aberrant glycosylation is also involved in EMT since the expression of certain patterns influences cell adhesion, i.e., they directly influence cellular communication mechanisms, namely in the signal transduction and in the activation of cellular receptors86. Moreover, there are studies showing that
7 fucosyltransferases, namely FUT IV, activate signalling systems that induce the transcription of mesenchymal markers related genes87. Also alterations in the regulation of sialylation were reported
during EMT, which showed to influence the TGF-β sialylation state88.
Fibronectin is a cell-matrix adhesion glycoprotein that bind to the Integrins present on the cell surface, performing an evident structural function89. It is expressed in several types of cancer and seems to be
involved in several stages of tumour development90. In fact, increased expression of fibronectin in cancer
has been related to the promotion of tumour growth91, migration92 and invasion93. Moreover, being an
adhesion protein, influences several signalling events that lead to an increased metastatic potential93,94.
Figure 1.4 – Epithelial-Mesenchymal Transition network. Primary tumour cells start to increase the expression of
mesenchymal markers due to the presence of proinflammatory cytokines in the tumoral microenvironment where CAF, MDSC, Macrophages and infiltrated Neutrophils are also present. After undergoing in EMT stage, cancer cells can degrade ECM, go into bloodstream and migrate do distant sites, where, through E-selectin interactions, they colonize new tissues, start do increase the expression of epithelial markers and form new tumour masses, the metastasis. Taken from Sistigo and Nisticò (2017)95. CAF – Cancer-associated fibroblast; MDSC – Myeloid-derived suppressor cell; ICB – Immune checkpoint blocker; MET – Mesenchymal-epithelial transition;
1.5. Introduction to the aims of this thesis
Aberrant glycosylation patterns are responsible for a significant increase in tumour malignancy. Therefore, in this thesis, we hypothesized that increased expression of sLex/a in cancer tissues induces
more aggressive features in cancer. So, we have as main objectives to evaluate the expression of aberrant glycosylation patterns in cancer, identifying novel biomarkers as potential therapeutic targets, namely scaffold protein candidates, and evaluate these patterns in experimental models seeking to understand the role of these glycans in cancer progression and metastasis.
At first, we started by evaluating the expression of sLex/a and certain biomarkers in colon
adenocarcinoma and TNBC tissues by Immunohistochemistry (IHC). After this characterization, we went to evaluate the expression of these glycans in cell lines and study their role in cancer progression and metastasis, by inhibiting fucosylation and assessing its effects on gene expression and fundamental processes in cancer, such as cell proliferation and migration, using Immunofluorescence (IF), flow cytometry and Western blot (WB) assays. Finally, we evaluated the role of fucosylation in EMT.
8 2. Materials and Methods
2.1. Histological analysis
Formalin fixed paraffin-embedded colon and breast cancer tissues were sectioned and placed onto slides (Thermo Scientific) using standard paraffin microtomy. The NovolinkTM Polymer Detection System
from Leica BIOSYSTEMS was used for all procedures. All the steps of this protocols took place at room temperature (RT).
Slides were deparaffinized in xylene, washed in graded ethanol and rehydrated in de-ionized water. For antigen retrieval, slides were incubated in a microwave for 30 minutes using a citrate buffer pH 6 and thereafter washed with tap water. Endogenous peroxidase activity and proteins were blocked by incubating slides with Peroxidase block and Protein block solutions, respectively, for 5 minutes and then rinsed three times with Tris-Buffered Saline solution with 0.1% Tween 20 (TBST) (Appendix 1). The slides were incubated with HECA-452 mAb (1:50) (BioLegend®
)
, anti-CD15s mAb (1:50) (BD Biosciences), anti-CA19.9 mAb (1:50) (Abcam), anti-CK – clone AE1/AE3 (1:100) (Dako), anti-MUC1 – clone VU4H5 (1:100) (Santa Cruz), anti-MUC1 – clone 5E3 (1:100) (homemade) or anti-Ki67 (1:20) (BioLegend®)
diluted in Diamond Antibody Diluent (Cell Marque) for 45 minutes, followed by incubation with Post primary and NovolinkTM Polymer solutions for 30 minutes. Slides were rinsed threetimes with TBST between each incubation. For E-selectin staining with E-selectin-human Ig Fc chimera (E-Ig) (R&D Systems) an additional step was made. After incubation with E-Ig (1:300), slides were incubated with anti-CD62e mAb (1:250) (BD Biosciences) also diluted in Diamond Antibody Diluent for 30 minutes. In this specific case, all solutions in the staining process had 2 mM of Calcium chloride (CaCl2). Chromogenic detection was performed by incubating slides with 3,3’-Diaminobenzidine
(DAB) Chromigen and NovolinkTM DAB Substrate Buffer (1:20) for 4 minutes. Positive staining
produces a dark brown reaction product. Immediately after the colour development, slides were washed with tap water for 2 minutes. Nuclear contrast staining was performed with hematoxylin (Bio-Optica) for 1 minute. Slides were washed with tap water in order to blueing hematoxylin stain. After the immunohistochemical technique, the slides were dehydrated, treated with increasing concentrations of alcohol, cleared in xylene and mounted in Quick-D-M-Klinipath mounting medium.
Slides were visualised after digital scanning using NanoZoomer-SQ Digital Slide scanner (HAMAMATSU) and NDP.view2 Viewing software (HAMAMATSU). For evaluation, a semi-quantitative approach was established. Cell staining was semi-quantitatively evaluated as 0 when negative, 1 if [1-25]%, 2 if ]25-50]%; 3 if ]50-75]% and 4 if ]75-100]% cells were stained and staining intensity was evaluated as absent (0), weak (1), moderate (2) and strong (3). The score was obtained by multiplying each of the two quantitative values, the % of stained cells and the staining intensity. For Ki-67 analysis, a random area was selected, 100 cells were counted, and the percentage of stained cells calculated.
2.2. Cell culture
CF1T and HT29, LS174T and SW48 cell lines were used as in vitro models of breast cancer and colorectal adenocarcinoma, respectively. HT29 (ATCC®HTB-38TM) cell line was derived from a
44-year-old Caucasian female colon adenocarcinoma. LS174T (ATCC®CL-188TM) cell line was established
9 (ATCC®CCL-231TM) cell line was derived from Dukes’ type C 82-year-old Caucasian female colon
adenocarcinoma. Finally, CF1-T cell line was established from Invasive Ductal Breast Carcinoma (IDC) as described by Carrascal et.al96.
The cell lines used were cultured in T25 culture flasks (SARSTEDT) at 37ºC with 5% Carbon dioxide (CO2) and a humidified atmosphere. CF1T, HT29 and LS174T cells were cultured with Dulbecco’s
Modified Eagle Media (DMEM) (Gibco®, Life Technologies) supplemented with 10% (v/v) Fetal Bovine Serum (FBS) (Gibco®, Life Technologies), 1% (v/v) L-glutamine (Gibco®, Life Technologies) and 1% (v/v) Penicillin/Streptomycin (Gibco®, Life Techonologies). SW48 cells were cultured with Liebovitz L-15 medium (Sigma-Aldrich) supplemented with 10% (v/v) FBS, 1% (v/v) L-glutamine and 1% (v/v) Penicillin/Streptomycin. The medium was changed every 3-4 days. For passages, at 80% of confluency, the culture was washed with 1X Phosphate Buffered Saline (PBS) (Appendix 1) and trypsinized for 5 minutes with 1X trypsin-Ethylenediaminetetraacetic acid (EDTA) (Gibco®, Life Technologies) for cell detachment, followed by a centrifugation step (Eppendorf) at 200g for 5 minutes and sub-cultured according to the desired dilution. All cell lines were stored at -80ºC resuspended in culture medium with 10% (v/v) Dimethyl sulfoxide (DMSO) (Sigma Aldrich).
To determine the cell number necessary for each assay a Neubauer counting chamber (Marienfeld) was used.
2.3. 2-Fluorofucose treatment
Cell lines was treated or not with 1 mM of 2-Fluorofucose (2-FF) inhibitor in supplemented culture medium. Cells must be exposed to the inhibitor for at least 5 days.
2.4. Flow cytometry
For each condition, 3x10⁵ cells were collected, washed with 500 μL of PBS (Appendix 1) and
centrifuged at 200g for 5 minutes. Supernatant was discarded, and cells were washed again with 900 μL of PBS and centrifuged at 200g for 5 minutes. Pellets were resuspended in the desired volume of PBS to be divided as 100 μL in each condition. Expression analyses of sLex/a was performed using
HECA-452 mAb (0.5 μL) for 30 minutes at 4ºC followed by a washing step with 500 μL of PBS and centrifugation at 200g for 5 minutes. Supernatant was discarded, and the cells were incubated with anti-rat IgM-APC secondary antibody (0.5 μL) (BD Pharmingen) at RT for 15 minutes. Next, cells were washed with 500 μL of PBS and centrifuged at 200g for 5 minutes. The supernatant was discarded, and pellets resuspended in 1 mL of PBS. The same procedure was used for MUC1 expression analysis but using anti-MUC1 – clone VU4H5 mAb (1.5 μL) followed by anti-mouse Ig-FITC secondary antibody (1.5 μL) (Dako). For intracellular staining, to assess the expression of CK, we used the Fixation/Permeabilization Solution Kit (BD Bioscience), according to manufacturer’s instructions, before staining cells with anti-CK – clone AE1/AE3 mAb (1.5 μL) for 30 minutes at 4ºC followed by incubation with anti-mouse Ig-FITC secondary antibody (1.5 μL) for 15 minutes at RT. The E-SL expression was analysed incubating cells, after washing, with E-Ig chimera (0.5 μg/μL) plus anti-human Ig-FITC antibody (1 μL) (Sigma-Aldrich) in PBS-Ca2+ or, as negative control, in PBS with 2mM EDTA
for 1 hour at 4ºC. After that, cells were washed with 1 mL of corresponding PBS and centrifuged at 200g for 5 minutes. The supernatant was discarded, and cells resuspended in 1 mL of PBS-Ca2+ or
PBS-EDTA. Control assays were performed incubating cell with only fluorescent-labelled secondary antibodies. Flow cytometry was performed in Attune® Acoustic Focusing Cytometer (Applied Biosystems), at least 1x10⁴ events were acquired and results were analysed using FlowJo v.10 software.
10 2.5. Immunofluorescence
Cells were cultured on round coverslips inside 24 well plates (Orange Scientific) for 24 hours. Then, cells were washed three times with PBS (Appendix 1) for 5 minutes and fixed and permeabilized with 200 μL of Fixation/Permeabilization solution, for 20 minutes at 4ºC. After three washes with PBS for 5 minutes, cells were blocked with 1% Bovine Serum Albumin (BSA) (Sigma-Aldrich) and washed three times again. Next, cells were subject to immunofluorescence staining with HECA-452 mAb (1:50), anti-MUC1 – clone VU4H5 mAb (1:200), anti-CK – clone AE1/AE3 mAb (1:200) or anti-Fibronectin mAb (1:200) during 30 minutes at RT followed by three washes with PBS. Cells were incubated with anti-rat IgM-FITC (1:50) (BD Pharmingen), anti-mouse IgG-FITC (1:100) (Dako) or anti-mouse Ig-FITC (1:100) secondary antibodies for 30 minutes at RT and washed three times with PBS. Negative controls were performed staining with only fluorescent-labelled secondary antibodies. All antibodies were diluted in 1X BD Perm/Wash buffer. Finally, nuclei were stained with 4’,6-diamidino-2-phenylindole (DAPI) (1μg/mL) (ThermoFisher) for 10 minutes in the dark, washed, mounted with 20 μL of montage medium Mowiol+DABCO and analysed by fluorescence microscopy. Fluorescence intensities from five randomly selected microscopic fields of cells were quantitatively analysed with ImageJ software and using CTCF formula (2.1):
(2.1) CTCF = Integrated density – (Area of selected cell x Mean fluorescence of background readings)
2.6. SDS-PAGE and Western blot
Cells were lysed in IP Lysis/Wash buffer (Thermo Scientific) complemented with 1% Protein Inhibitors (Roche) and incubated for 20 minutes. Every 5 minutes, the suspension was vortexed for 1 minute. Supernatants were cleared by centrifuged at 10000g for 10 minutes and protein concentration was quantified using Pierce BCA Protein Assay Kit (Thermo Scientific) following manufacture’s instructions. After that, samples were loaded in 4% stacking and 6% resolving gel (Appendix 1) for sLex/a and MUC1 analysis, or 12% resolving gel (Appendix 1) for CK analysis and the electrophoresis
was performed in Running buffer (Appendix 1) at 100 V. Sodium dodecyl sulfate – polyacrylamide gel electrophoreses (SDS-PAGE) resolved proteins were transfer into a polyvinylidene fluoride (PVDF) membrane at 400 mA for 1 hour at 4ºC and using Transfer buffer (Appendix 1). Then, membranes were blocked with 7,5% non-fat milk powder dissolved in TBST 0.1% (Appendix 1) for 1 hour at RT. Membranes were incubated with HECA-542 mAb (1:1500), CK – clone AE1/AE3 (1:200) or anti-MUC1 – clone VU4H5 (1:200) diluted in TBST 0.1% overnight at 4ºC. After three washes of 10 minutes in TBST 0.1%, membranes were incubated with appropriated Horseradish peroxidase (HRP)-conjugated secondary antibodies diluted in TBST 0.1% for 1 hour at RT. Membranes were washed again and Lumi-light Western Blotting Substrate (Roche) was used for detection. At the end, the revelation was performed exposing the membranes to Amersham Hyperfilm ECL (GE Healthcare Life Sciences) and using Corestream® Kodac® autoradiography GBX developer and Corestream® Kodac® autoradiography GBX fixer (sigma).
2.7. Gene expression analysis – RT-qPCR
First, total Ribonucleic acid (RNA) was extracted using GenEluteTM Mammalian Total RNA
Purification kit (Sigma-Aldrich), according to manufacturer’s instructions. Optional on-column DNaseI digestion (Qiagen) was also performed. Next, 10 μL of purified RNA was reverse transcribed using
11 High-Capacity cDNA Reverse Transcription Kit (Applied Biosystems). The conversion mix was prepared by adding, for each PCR tube (VWR), 2 μL of RT Buffer, 2 μL of RT Random Primers, 0.8 μL of deoxynucleotides (dNTPs), 0.25 μL of MultiScribe Reverse Transcriptase enzyme and 4.2 μL of RNase free water (NZYTech). Complementary Deoxyribonucleic acid (cDNA) conversion was performed in a thermocycler (Programmable Thermal Controller PTC-100TM – MJ Research) with the
following program: Step I -10 minutes at 25ºC, Step II - 120 minutes at 37ºC and Step III - 5 seconds at 85ºC. Real-time PCR was performed starting with preparing the RT-PCR mix, adding for each RT-PCR tube (Simport), 2 μL of cDNA, 2 μL of diluted probe 1:4, 1 μL of RNase free water and 5 μL of the Master Mix Fast (Applied Biosystems). The probes used were FUT II, FUT IV, FUT V, FUT X, FUT XI, TGF-β, FGF2, VEGF-A, IL-1β and IL6 (Applied Biosystems). All experiments were performed in duplicates and two endogenous controls were used, β-actin and Glyceraldehyde 3-phosphate dehydrogenase (GADPH). Samples were run in RotorGene 600 (Corbett) with the following program: Step I – 1 cycle, 20 seconds at 95ºC and Step II – 40-50 cycles, 3 seconds at 95ºC and 30 seconds at 60ºC. Finally, results were analysed by calculating the relative mRNA levels using the adapted formula (2.2), which infers the number of messenger RNA (mRNA) molecules of the interest gene per 1000 molecules of the endogenous controls97. GraphPad Prism 7 Software was also used.
(2.2) Relative mRNA level = 2-ΔCt x1000
2.8. Cell proliferation measurement
To study cells proliferative capacity CellTraceTM CFSE cell Proliferation Kit (InvitrogenTM, Life
Technologies) was used. Immediately before use, 5 μM CellTraceTM Carboxyfluorescein succinimidyl
ester (CFSE) stock solution was prepared by adding 18 μL of provided DMSO to one vial of CellTraceTM
CFSE dye and mixing. Cells were resuspended in prewarmed 0.1% BSA-PBS at a final concentration of 1x10⁶ cells/mL and incubated with 2 μL of 5 μM CellTraceTM CFSE stock solution per mL for 20
minutes at 37ºC. 5 volumes of ice-culture medium were added, and cells incubated for 5 minutes on ice. Cells were pelleted by centrifugation at 200g for 5 minutes and washed 3 times by resuspending in warmed media. After the last wash, cells were resuspended in the desired volume of fresh medium and divided by wells. Cells were cultured for 5 days. Samples were collected every 24 hours and cell fluorescence was measured using Attune® Acoustic Focusing Cytometer. Cell proliferation index was determined using FlowJo V.10 and ModFit LT3.2 software. The parental generation was set based on the analysis of data from the cells maintained at 24 hours in culture after CFSE staining.
2.9. Wound-healing migration assay
Cells were cultured in a 12-well plate until confluence and then a uniform scratch was made using a 200 μL pipette tip. The suspended cells were washed, and medium was changed. The wound was imaged every 24 hours with an inverted microscope equipped with a digital camera98. For analysis, a fixed area
of the wound was defined and measured using ImageJ software. Every 24 hours, the area occupied by migratory cells was measured and discounted to the initial area until all the wound was filled by cells.
12 3. Results
3.1. E-SL and sLex/a antigens are expressed in colon and breast cancer tissues
Aberrant expression of sLex/a by cancer cells is associated with a higher propensity for cancer
progression and metastasis70. Using E-Ig chimera in paraffin-embedded cancer tissue sections, namely,
colon adenocarcinoma and Triple Negative Breast Cancer (TNBC) tissues, we started by evaluating the expression of E-SL, whose sLex/a is the main prototype65. Figure 3.1 shows that cancer tissues express
E-SL on the apical membranes of cancer cells as well as on the goblet cells also in its apical pole (Figure 3.1 G and H). In the control assays, where the protocol was performed without E-Ig chimera or in the presence of EDTA, a calcium chelator, staining was not detected (Figure 3.1 B-C and E-F). We also observed that E-Ig chimera staining in TNBC tissues, was weaker (Score = 6) when compared to colon cancer tissues (Score = 9).
Figure 3.1 – Immunohistochemistry analysis of E-SL expression in cancer tissues. IHC staining of A. colon
adenocarcinoma and D. TNBC tissues with E-Ig chimera (100X). For control, staining was performed B. E. in the absence of E-Ig and C. F. in the presence of EDTA, a calcium chelant (100X). In G. and H. is represented the same as in A. and D. but with higher magnification (400X). Brown colour indicates E-Ig positive reactivity. From A. to F. scale bar represents 500 μm while in G. and H. represents 100 μm.
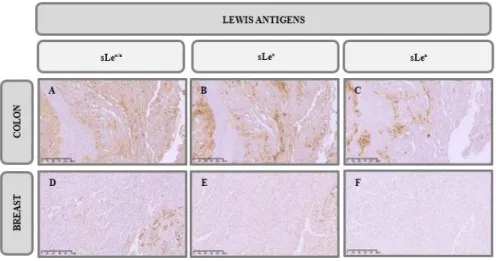
The expression of sLex/a was also detected in colon and breast cancer tissues using three different
antibodies, HECA-452 mAb (Figure 3.2 A and D), CD15s mAb (Figure 3.2 B and E) and anti-CA19.9 mAb (Figure 3.2 C and F), whose recognized epitopes are sLex/a, sLex and sLea respectively. In
this case, we observed that although the apical membranes were stained, some weaker staining was detected on the lamina propria, except in TNBC tissues where anti-CA19.9 mAb did not stained (Score = 0). The staining with CD15s and CA19.9 mAbs complement the staining of HECA-452 mAb, however, in colon cancer tissues the expression of sLex seems to be more significant (Score = 6) than
the expression of sLea (Score = 3). With both antibodies we can observe some staining associated to the
secretory pathways, even more, we also notice some mucus staining. Once again, we observed that sLex/a
staining in TNBC tissues, was weaker (Score = 2) when compared to colon cancer tissues (Score = 8). We can confirm that the expression of sLex/a is closely associated with the expression of E-SL.
13
Figure 3.2 – Immunohistochemistry analysis of sLex/a expression in cancer tissues. IHC staining of colon adenocarcinoma tissues with A. HECA-452 mAb, B. anti-CD15s mAb and C. anti-CA19.9 mAb, and TNBC tissues with D. HECA-452 mAb,
E. anti-CD15s mAb and F. anti-CA19.9 mAb (100X). Brown colour indicates antibodies positive reactivity. Scale bar
represents 500 μm.
3.2. Colorectal and breast cancer tissues analysis for relevant biomarkers
After identifying the expression of E-SL, and in particular sLex/a, we have attempted to characterize
some biomarkers. We assessed the expression of potential scaffold proteins relevant to adhesion and signalling, namely MUC1, as well as the expression of CK, an epithelial marker, and Ki-67, a nuclear protein expressed in all stages of the cell cycle (G1, S, G2 and Mitosis) and absent in quiescent cells (G0), i.e., a proliferation marker99.
We have found a significant staining of CK in the cytoplasm, with membrane reinforcement, in all cancer tissues (Score = 12) (Figure 3.3 A and G) confirming their epithelial origin. In fact, control tissues also showed a significant staining (Score = 8), maybe stronger, of this marker in the epithelial layers (Figure 3.3 D and J). On the other hand, the staining with MUC1 showed different profiles in different tissue types, staining weakly (Score = 2) the cytoplasm secretory pathways and the apical membrane of colon cancer tissues and was not detected in TNBC tissues (Score = 0) (Figure 3.3 B and H). In addition, we observed that normal colon tissue also express MUC1 in the epithelial barrier (Score = 3).
However, when we assessed MUC1 expression using the homemade 5E5 mAb, that recognize MUC1 GalNAc-glycosylated form, i.e., with O-linked patterns, we found that expression was much more significant in both, colon (Score = 9) and TNBC (Score = 6) tissues (Figure 3.3 C and I), whereas in the control no expression was detected (Score = 0) (Figure 3.3 F and L). Interestingly, the expression of MUC1 GalNAc-glycosylated form is diffuse in colon cancer tissues and more heterogeneous in TNBC tissues.
Finally, we evaluated the expression of Ki-67 proliferative marker, whose staining confirmed that they were proliferating tissues since a lot of nuclei stained were detected in both, colon (77%) and TNBC (59%) tissues (Figure 3.4).