ENVIRONMENTAL FRAGILITY BASED ON THE SPATIAL DISTRIBUTION OF SOIL RESISTANCE FOR THE ENVIRONMENTAL PROTECTION AREA (EPA) OF
BOTUCATU, SAO PAULO, BRAZIL
A FRAGILIDADE AMBIENTAL NA DISTRIBUIÇÃO ESPACIAL DA RESISTÊNCIA DO SOLO PARA A ÁREA DE PROTEÇÃO AMBIENTAL (APA) DE BOTUCATU
Fernando de Alvarenga Yoshida1; Rubismar Stolf1
Artigo recebido em: 24/10/2018 e aceito para publicação em: 17/06/2019. DOI: http://dx.doi.org/10.14295/holos.v19i3.12316
Abstract: Effective soil management requires an understanding of the physical, chemical and spatial distri-bution features of soil. Based on the spatial distridistri-bution of soil resistance to mechanical penetration, this study sought to construct an environmental fragility index of this resistance and apply it to an environmental fragility map of the Environmental Protection Area (EPA) of Botucatu, Sao Paulo, Brazil. Methodologies con-sisting of an empirical analysis of the environment, geostatistics, a multi-criteria decision analysis and alge-braic maps were used. Measurements of soil resistance to mechanical penetration, sloping, soil type and land use were integrated into an environmental fragility map. The results showed that 32.5% of the sample area fell into the low fragility categories and 67.57%, into the middling and very high fragility categories. Our conclusion was that soil resistance to mechanical penetration, which is a natural feature found in various types of soils, can therefore be included as one of the criteria in a fragility analysis. We found evidence sug-gesting that soil resistance to mechanical penetration has a direct relationship with sloping and land use, namely, in cases where different types of use and their management exert change on the soil’s natural re-sistance to the extent of rendering it fragile.
Keywords: Soil compaction. Geoestatistic. Multi-criteria decision analysis. Environmental assessment. Resumo: A gestão eficaz do solo requer uma compreensão dos seus aspectos físicos, químicos e sua dis-tribuição espacial. Esse estudo buscou, através da disdis-tribuição espacial da resistência do solo à penetração mecânica, elaborar um índice de fragilidade ambiental e utilizá-lo em uma carta de fragilidade ambiental para a Área de Proteção Ambiental (APA) de Botucatu. As metodologias de análise empírica da fragilidade ambiental, geoestatística, análise de decisão multicritérios e álgebra de mapas foram empregadas nesse estudo. Medidas de resistência do solo à penetração mecânica, a declividade, os tipos de solos e uso do solo foram usados para gerar a carta de fragilidade ambiental. Os resultados mostraram que 32,5% da área amostral se encontraram dentro de classes baixas de fragilidade e 67,57% se encontraram em classes de fragilidade de média a muito alta. A resistência do solo à penetração mecânica, que é uma característica natural de diferentes solos pode ser usada como um critério dentro de uma análise de fragilidade. Foi evi-denciado que existe uma relação da resistência do solo à penetração mecânica com a declividade e o uso do solo, onde diferentes tipos de uso e seus manejos modificam essa resistência natural ao ponto de se tornar uma fragilidade.
Palavras-chave: Compactação do solo. Geoestatística. Análise de decisão de multicritérios. Diagnóstico ambiental.
1 Universidade Federal de São Carlos (UFSCAR), São Carlos, SP. E-mail: ([email protected],
1 INTRODUCTION
The main concern of studies on the environment should not be simply to ex-amine the components of nature in isolation from each other, but rather with refer-ence to the connections and relationships that bind them together (Sotchava, 1976). The different associations and interactions between the components of nature define environments endowed with their own personal dynamics, the study of which leads to an understanding of spatial and environmental sustainability.
An integrated analysis of natural environments, based on the Tricart concepts (1977) can be applied to agri-environmental planning which highlights the importance of taking into account at the planning stage not only the potential for different applica-tions of natural resources but also (and above all else) the fragility characteristics of all manner of natural environments when confronting the various incursions of man-kind into nature.
Taking an integrated approach to the treatment of natural resources on an in-tegrated basis can render diagnosis of the different hierarchical categories of fragility of these natural resources a viable possibility (ROSS, 1994). This being the case, soil mapping can be of fundamental importance to the expansion of knowledge of the dynamics of multiple environments and, thus, a valuable benefit attaching to an eval-uation of the vulnerability of the various types of use of the environment (ROSS, 1994).
Effective soil management requires an understanding of the spatial distribution of soil types, their physical and chemical aspects and their patterns as found in the landscape (MCBRATNEY et al., 2000). Soil compaction is either a natural soil feature or the result of anthropogenic action on the soil. Soil resistance to mechanical pene-tration is the act or action of forcing the aggregation of soil particles resulting in a reduction in volume of the particles involved (SEIXAS et al., 1998). It can be de-scribed in terms of the tension applied to the soil and the consequent changes in its conditions (CAMARGO, 1983).
The objective of this study is to generate a fragile environment index, by ex-amining how resistance is spatially distributed throughout the soil, and the genera-tion of a fragile environment map for the Botucatu Environmental Protecgenera-tion Area (EPA) using methodologies such as geostatistics, multi-criteria decision making and an algebraic map.
2 MATERIAL AND METHODS
2.1 Area under study
The Corumbataí-Tejupá-Botucatu Environmental Protection Area (EPA), in the Botucatu perimeter, commonly known as the Botucatu EPA, is located in the central-western part of the state of São Paulo comprising nine municipalities, covering a total area of 218,306 ha. This conservation area was established by law with the purpose of protecting the environmental and landscape attributes of the Basalt Cuesta, resid-ual hills, surface water resources, the Guarani Aquifer recharge areas and the transi-tion zone between the Cerrado and Atlantic Forest biomes (CPLEA, 2004). For the purpose of analysis, only the EPA area of Botucatu, which is located within the terri-torial boundary of the municipality of Botucatu, was demarcated for inclusion in the study, making approximately 38500 ha in total, as featured in Figure 1. A quadrant was prepared for data collection, and the study area was divided into ten equal parts (each 837.40 ha in area) in both the north-south and east-west directions, making a total of 78 sampling points, as depicted in Figure 2.
Figure 1- Map of the Environmental Protection Area (EPA) of Botucatu and location of the study area
Figure 2- Distribution of sampling points in the study area
Map Legend: Collected Points; Hydrography; EPA boundary; Municipal Limit
The types or classes of soil found in the study area were as follows: dystrofer-ric Red Latosols (dfRL); dystrophic Red Latosols (dphRL); dystrophic Red-Yellow Argisols (dphPVAd); dystrophic Red-Yellow Latosols (dphRYLVAd1); eutrophic Litolic Neosols (RLe); typical Quartarenic Neosols (typQN) and Haploid Gleysols (GXbd), as shown in Figure 3.
Figure 3 - Types or classes of soils of the Botucatu Environmental Protection Area (EPA)
Map Legend: PVAD; RYLv; RL; dfRL; RLE; RQ; GBxd - Collected Points; Hydrography; EPA boundary; Municipal Limit
For the purpose of methodology, it was decided to separate the sloping of the study area into classes, namely: ≤ 6%, 6 to 12%, 12 to 20%, 20 to 40% and ≥ 40%, according to Figure 4.
Figure 4- Sloping in the Botucatu Environmental Protection Area (EPA)
Map Legend: Up to 6%; From 6 to 12%; From 12 to 20%; From 20 to 40%; Above 40% - Collected Point ;Hydrography; EPA boundary; Municipal Limit
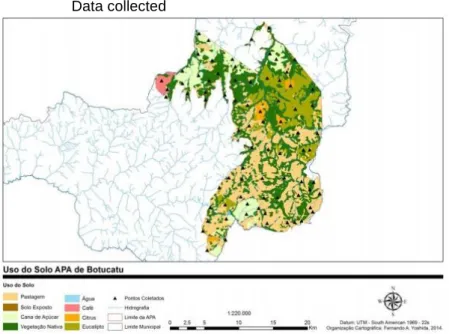
Finally, in Figure 5, the types of land use and vegetation coverage of the area studied are as follows: Coffee (541.45 ha), Sugarcane (4468.82 ha), Citrus (744.38 ha), Eucalyptus (5216.87 ha), Grassland (Pasture) (13076.40 ha) and Native Vegeta-tion (14269.35 ha).
Soil resistance to mechanical penetration is measured in terms of impact of a known weight on the soil, followed by measuring the depth reached by each impact, according to the methodology described by Stolf (1983).
The measurements were taken in July, August and September 2013, during the period of drought in the year, as can be observed in Figure 6. This period was chosen to coincide with the point at which soil resistance was at the height of its frui-tion and expressiveness, since, in general, the greater the resistance of a soil to penetration, the drier and / or the denser it appears.
Figure 5 - Soil use in the Botucatu Environmental Protection Area (EPA) Data collected
Map Legend: Pasture; Exposed Soil; Sugarcane; Native Vegetation; Water; Coffee; Citrus; Eucalyptus - Collected Point; Hydrography; EPA boundary; Municipal Limit)
Figure 6 - Annual distribution of accumulated monthly rainfall in the Botucatu Environmental Protection Area (EPA) in 2013
Source: Cunha (2014)
Each sampling point of soil resistance to mechanical penetration was subject-ed to measuring, an exercise which was twice repeatsubject-ed. The respective slope, soil type and soil use, and vegetation coverage were also generated using previous mappings (PDP, 2006), which, according to the statistical analysis, are the basis of the different treatments implemented by the study. In this experiment there are no treatments in the classical sense, since no treatment was actually applied to the ar-ea. However, for the purpose of analysis, the slopes, soil types, soil use and vegeta-tion cover were considered in the same vein as treatments for measuring data of soil resistance to mechanical penetration. Consequently, the study presents a wide
varie-ty of treatments and observations as follows: five degrees of incline, six varie-types of soil, six different uses of the soil, and soil resistance to mechanical penetration in the 0 to 20 cm and 20 to 40 cm layers based on 78 sampling points.
There is extensive variation in the number of observations for each treatment, due to the idiosyncrasies of the area under study, since, for example, there is a greater abundance of sugarcane growing areas than coffee or citrus growing areas. Consequently, there were more observations recorded for treatments in the sugar-cane growing areas, as can be seen in Figure 5.
Figure 4 presents another example in which more observations are made in areas of typical Quartarenic Neosols (typQN) than in dystrophic Red-Yellow Argisols (PVAD), since these soils have a higher incidence in the area under study. Next, a comparative analysis of averages was carried out between soil resistance and the following specific treatments: different slopes, soil types and land use and vegetation cover. It was thus decided to make multiple comparisons between the averages fol-lowing the Scott-Knott model, notable for its characteristic of separating means into groups without overlap between groups (Scott and Knott, 1974).
3 ANALYSIS OF RESULTS
As for the methods and the mapping technique to depict the spatial distribution of soil resistance to mechanical penetration, ordinary kriging was used, which is strongly associated with the semivariogram model utilized herein, that allows for veri-fying the accuracy of the model adopted (VIEIRA et al., 1983) through cross-validation. Using the cross-validation approach, this study evaluated the exponential, spherical and Gaussian semivariogram models and found evidence that the expo-nential semivariogram model enhanced performance through the spatial distribution of soil resistance to mechanical penetration.
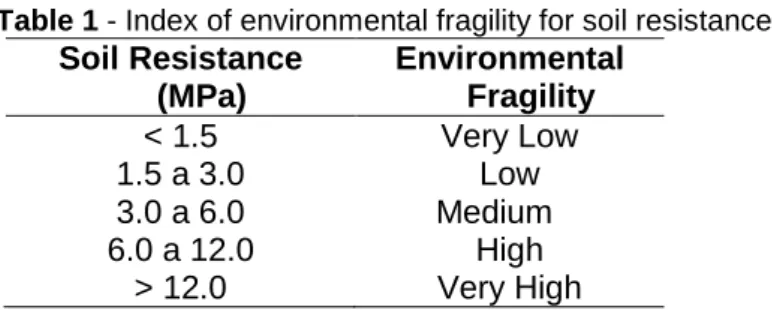
From the measured data of soil resistance to penetration and its spatial distri-bution, an environmental fragility index of soil resistance to mechanical penetration was constructed. Using the minimum and maximum values found in the field, in each of the mean, tertile and quintile frequency distributions and based on the values of the Canarache index (1990), five degrees of environmental fragility were established for soil resistance, displayed in Table 1 below:
Table 1 - Index of environmental fragility for soil resistance Soil Resistance (MPa) Environmental Fragility < 1.5 Very Low 1.5 a 3.0 Low 3.0 a 6.0 Medium 6.0 a 12.0 High > 12.0 Very High
After converting soil resistance, sloping, soil types and soil use and vegetation coverage into environmental fragility maps, a multi-criteria decision analysis matrix was prepared, allowing for the combination of variables to generate a synthesis map as the final product.Table 2 below shows the multi-criteria matrix used in this study:
Table 2 - Multi-criteria Matrix
Criteria Elements Assessed Environmental Fragility Note Weighting
Soil Resistance (MPa)
≤ 1.5 MPa Very Low 1
0.25
1.5 a 3,0 MPa Low 2
3.0 a 6.0 MPa Medium 3
6.0 a 12.0 MPa High 4
≥ 12.0 MPa Very High 5
Soil Class* GXbd, dphRL Very Low 1 0.25 RYLv Low 2 dfRL Medium 3 PVAD High 4
RLE, typQN Very High 5
Degree of slope (%)* ≤ 6 % Very Low 1 0.25 6 a 12 % Low 2 12 a 20 % Medium 3 20 a 40 % High 4 ≥ de 40 % Very High 5
Soil use and vegetation coverage*
Native Very Low 1
0.25
Eucalyptus Low 2
Coffee, Citrus Medium 3
Pasture High 4
Sugarcane Very High 5
*Adapted from Ross (1994) *. dystroferric Red Latosols (dfRL); dystrophic Red Latosols (dphRL); dys-trophic Red-Yellow Argisols (PVAd); dysdys-trophic Red-Yellow Latosols (RYLv); eudys-trophic Litolic Neos sols (RLE); typical Quartarenic Neossols (typQN) and Haploid Gleysols (GXbd)
Using this multi-criteria matrix, based on the fragility classes proposed by Ross (1994) for slopes, soil types and land uses, together with the fragility classes identified in this soil resistance study, weightings were assigned to each element and attribute involved and, through algebraic mapping (consisting of the application of arithmetic operations to soil association in several layers - soil resistance, sloping,
soil types and land use and vegetation cover). The result was the construction of an environmental fragility map for the EPA in Botucatu.
It was possible to apply an algebraic formula to the addition of elements of equal environmental fragility values (notes 1, 2, 3, 4 and 5), multiplied by their weighting (0.25), according to the following formula:
Botucatu EPA Environmental Fragility Chart (Slope x 0.25) + (Soil Class x 0.25) + (Soil Use x 0.25) + (Soil Resistance x 0.25)
The multi-criteria decision analysis, using the algebraic mapping method, al-lowed for the grouping and classifying of areas that presented degrees of similar en-vironmental fragility to generate the enen-vironmental fragility chart for the Botucatu EPA.
4 RESULTS AND DISCUSSION
4.1 Soil resistance and slopes
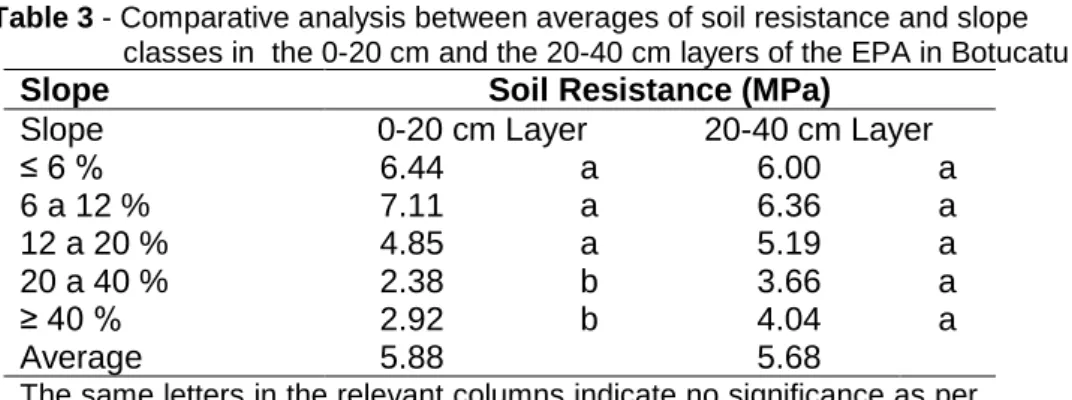
Table 3 shows that the values for resistance to mechanical penetration for slopes ≥ 20% presented significant differences when compared to the classes of lesser slopes evaluated in the study (≤ 6%, 6 to 12% and 12 to 20%), in the 0 to 20 cm. layer. For slopes ≤ 20% the average soil strength was more than double the val-ues obtained for slopes ≥ 20% evaluated in the study. In areas with slopes ≤ 20%, agricultural use of the soil is frequent, with possible intensive management and use of mechanization, which may result in soil compaction. In areas with slopes with greater inclines, agricultural use of the soil is less frequent or even non-existent (de-pending on the degree of the slope), since physical and mainly legal constraints (en-vironmental legislation – the Brazilian forest code) exert an influence over these are-as, as evidenced by marrying the data of the slope and land use maps together (Fig-ures 4 and 5). No significant differences in soil strength were found between different slope classes in the 20-40 cm layer.
Table 3 - Comparative analysis between averages of soil resistance and slope classes in the 0-20 cm and the 20-40 cm layers of the EPA in Botucatu
Slope Soil Resistance (MPa)
Slope 0-20 cm Layer 20-40 cm Layer
≤ 6 % 6.44 a 6.00 a 6 a 12 % 7.11 a 6.36 a 12 a 20 % 4.85 a 5.19 a 20 a 40 % 2.38 b 3.66 a ≥ 40 % 2.92 b 4.04 a Average 5.88 5.68
The same letters in the relevant columns indicate no significance as per the Scott-Knott test at 5%
4.2 Soil resistance and soil types
Table 4 shows that there were no significant differences in soil resistance val-ues observed in the different types of soils and layers at the depths evaluated. Re-sistance to mechanical penetration may vary according to the different soil types due to the physical and chemical characteristics of each soil.
Luciano et al. (2012) pointed out that different soil types had distinct behavior patterns when subjected to compaction, due to variations in texture, mineralogy, or-ganic matter content, moisture, above the historic norm of pressures expected in pe-dogenetic training processes and soil management. However, these variations in soil resistance were not significant for the different soil types in either the surface layers (0-20 cm) or the deeper-lying layers (20-40 cm) found in the area under study, which is probably due to low soil moisture (during the period of drought) on the dates when the measurements in the area under study were taken.
Soil moisture is an important parameter in the quantification of resistance to penetration, since there is a high level of dependence on the results of the soil water content. Beltrame et al. (1981) verified that, for variation in soil moisture to occur, it must move in the direction opposite to the resistance of the soil to the penetration, because the water content intervenes and modifies cohesion between the soil parti-cles. Where there is little availability of moisture in the soil, variation will also be low, as shown by the non-significant differences in Table 4, regardless of soil type.
Table 4 - Comparative analysis between the averages of soil resistance and soil types in the 0-20 cm and 20-40 cm layers of the Botucatu EPA
SOIL CLASSES Soil Resistance (MPa)
Soils 0-20 cm Layer 20-40 cm Layer
GXbd 8.49 a 6.27 a dphRL 6.68 a 5.37 a dfRL 4.99 a 5.07 a PVAd 4.72 a 6.90 a RLE 4.40 a 4.09 a typQN 7.85 a 7.97 a Average 6.18 5,94
The same letters in columns indicate no significance as per the Scott-Knott test at 5%.
Note: dystroferric Red Latosols (dfRL); dystrophic Red Latosols (dphRL); dystrophic Red-Yellow Argisols (PVAd); dystrophic Red-Red-Yellow Latosols (RYLv); eutrophic Litolic Neossols (RLE); typical Quartarenic Neossols (typQN) and Haploid Gleysols (GXbd).
4.3 Soil resistance, soil use and vegetation cover
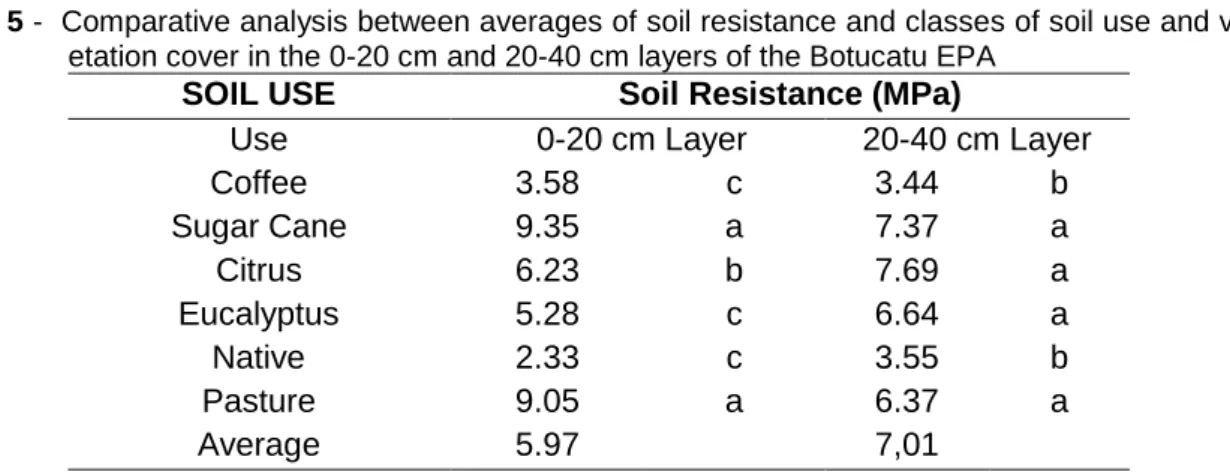
Resistance to mechanical penetration of the soil varied according to soil use and its vegetation cover revealing significant differences as shown in Table 5. For native forests, the cultivation of eucalyptus and permanent crops such as coffee, yielded resistance to mechanical penetration values from low to medium as com-pared with values presented for other land uses such as pasture and sugarcane crops. Citrus, despite being a permanent crop, requires more intense management compared to the management of many other permanent crops, as do perennial crops, which directly reflected the soil resistance value presented. Pasture and sug-arcane crops had the highest soil resistance values in the surface and upper soil lay-ers (0-20 cm). The native forest (not under management) and the coffee crop (low intensity management) presented lower values for resistance to mechanical penetra-tion than the other crops in the 20-40 cm layer, which indicates that the impact on the physical quality of the soil due to management in the other areas goes beyond the topsoil. The cultivation of eucalyptus, citrus, pasture and sugarcane did not present significant differences when compared to their values of resistance to soil penetration values. In the pasture area, where there is no soil rotation, the compaction was ex-pected to be restricted to the soil surface which was not subject to observation over the course of this study. The results obtained by Lima et al (2013) reinforce the re-sults obtained in this study, in which the soils under different usage systems
present-ed different behavior patterns in relation to resistance to mechanical penetration. Li-ma et al., (2013) thus concluded that pasture affects soil compaction down to the 30cm layer, as this study also showed.
Table 5 - Comparative analysis between averages of soil resistance and classes of soil use and veg-etation cover in the 0-20 cm and 20-40 cm layers of the Botucatu EPA
SOIL USE Soil Resistance (MPa)
Use 0-20 cm Layer 20-40 cm Layer
Coffee 3.58 c 3.44 b Sugar Cane 9.35 a 7.37 a Citrus 6.23 b 7.69 a Eucalyptus 5.28 c 6.64 a Native 2.33 c 3.55 b Pasture 9.05 a 6.37 a Average 5.97 7,01
The same letters in columns indicate no significance as per the Scott-Knott test at 5%.
4.4 Multi-criteria Decision Analysis and Environmental Fragility
Multi-criteria decision analysis played the role of interpolator of the parameters and criteria, as can be seen in Table 2. Each criterion (soil resistance, slope, soil types, soil use) had its mark and weight assigned from the perspective of environ-mental fragility.
A mapping of the environmental fragility can present several variables differ-ent from those contemplated by this study. However, the mapping presdiffer-ented in this study has a certain significance based on the fact that using a series of data (criteria and parameters) in an analysis capable of integrating factors focused on the physical environment, biotic and anthropic action allows for an interpretation of the landscape in its broadest sense, since it points to a well-defined spatio-temporal diagnosis, as has also been observed by Santos (2010), Gimenes (2013) and Donha el al. (2013).
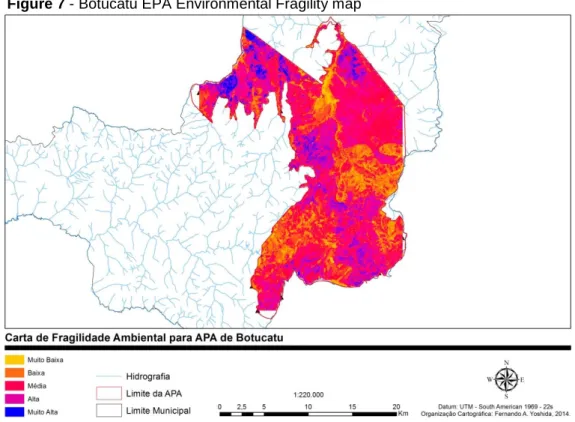
The Environmental Fragility map for the Environmental Protection Area (EPA) in Botucatu is presented in Figure 7 below.
Figure 7 - Botucatu EPA Environmental Fragility map
Map Legend: Very Low; Low; Medium; High; Very High - Collected Point; Hydrography; EPA boundary; Municipal Limit
Table 6 shows the number of areas for each category of environmental fragili-ty. Only 32.43% of the total sample area fell into the very low and low environmental fragility classes whilst 67.57% of the total sample area into the medium to very high fragility categories. The positive factor of this result indicates that only 2.38% of the sample area was in the very high environmental fragility category.
Table 6 - Number of areas for the environmental fragility categories of Botucatu APA.
Environmental Fragility Area (ha) (%)
1 (Very Low) 2270.15 5.90 2 (Low) 10214.39 26.53 3 (Medium) 17045.54 44.27 4 (High) 8055.00 20.92 5 (Very Low) 914.91 2.38 Total 38500.00 100.00
5 CONCLUSIONS
This study showed that soil resistance to mechanical penetration, which is a natural characteristic of a variety of different soils, environments, landscapes, slopes and land uses and vegetation cover, can be used as a criterion in an environmental fragility analysis. Evidence was found confirming a direct relationship between soil resistance to mechanical penetration with sloping, soil use and vegetation cover, whereby different types of use and their different management regimes modify the natural resistance to the point of it becoming fragile.
The environmental fragility index of soil resistance developed in this study was consistent in its classification of the relative importance of soil resistance from the perspectives of environmental fragility, the interaction and integration with the other criteria used in the multi-criteria decision analysis in the environmental fragility map. The environmental fragility of the EPA at Botucatu showed that a sizeable part of the area studied was in various classes of fragility from medium to very high, providing evidence of the need for planning and adequate management if the unit was to be preserved.
REFERENCES
BELTRAME, L.F.S. et al. Estrutura e compactação na permeabilidade de solos do Rio Grande do Sul, (Structure and compaction in soil permeability in Rio Grande do Sol). Rev. Bras. Cienc. Solo, Campinas, v. 5, p.145-149, 1981.
CANARECHE, A. PENETR - A generalized semi-empirical model estimating soil resistance to penetration. Soil Till. Res., Amsterdam, 16:51-70, 1990.
CAMARGO, O. A. Compactação do solo e desenvolvimento de plantas. (Soil compaction and plant development). Campinas, Fundação Cargill, p.44, 1983.
CPLEA - Coordenadoria de Planejamento Ambiental Estratégico e Educação Am-biental. Áreas de proteção ambiental no Estado de São Paulo. São Paulo: Se-cretaria Estadual do Meio Ambiente. Coordenação: Lúcia Bastos Ribeiro de Sena. 2004.
CUNHA, A. R. Dados pluviométricos da estação meteorológica do departa-mento de solos e recursos ambientais. Botucatu: Faculdade de Ciências Agro-nômicas/UNESP, 2014.
DONHA, A. G.; SOUZA, L. C de P.; SUGAMOSTO, M. L. LIMA, R. P.; LÉON, M. J.; SILVA, A. R. Resistência mecânica à penetração sob diferentes sistemas de uso do solo Scientia Plena, v. 9, n. 6, 2013.
LUCIANAO, R. V.; ALBUQUERQUE, J. A.; COSTA, A.; BATISTELA, B.;
WARMILING, M. T. Atributos físicos relacionados à compactação de solos sob vegetação nativa em região de altitude no Sul do Brasil. Rev. Bras. Ciênc. Solo, Viçosa, v.36, n. 6, nov./dec, 2012.
GIMENES, F. B. Q.; AUGUSTO FILHO, O. Mapas de fragilidade ambiental no processo de análise hierárquica (AHP) e sistema de informação geográfica (SIG). In: SIMPÓSIO BRASILEIRO DE SENSORIAMENTO REMOTO, 16., 2013..
Anais... SBSR. Foz do Iguaçu, 2013.
MCBRANTENEY, A. B.; ODEH, I. O. A.; BISHOP, T. F. A.; DUNBAR, SHATAR, T. M. An overview of pedometric techniques for use in soil surveys. Geoderma, n. 97, p. 293–327, 2000.
MARTINS, V.B. Metodologia baseada em sistemas de informação geográfica e análise de multicritérios para seleção de áreas para construção de um re-positório para o combustível nuclear usado. Tese (Doutorado) –
URFJ/COPPE, 2009.
PREFEITURA MUNICIPAL DE BOTUCATU. PDP - plano diretor participativo. Bo-tucatu, SP: Prefeitura Municipal, 2006.
ROSS, J.L.S. Análise empírica da fragilidade dos ambientes naturais e antropiza-dos. Revista do Depto. de Geografia, São Paulo, n. 6, 1994.
SANTOS, A. A. Geoprocessamento aplicado à identificação de áreas de fragi-lidade ambiental no parque estadual da Serra do Rola Moça. Monografia (Graduação) -UFMG, 2010.
SCOTT, A. J.; KNOTT, M. A cluster analysis method for grouping means in the analysis of variance. Biometrics, v.30, n.3, p.507-12, 1974.
SEIXAS, F.; OLIVEIRA JUNIOR, E.D. ; SOUZA, C.R. Efeito da camada de resí-duos florestais na compactação do solo causada pelo transporte primário da ma-deira. Sci. Flores talis, v. 54, p.9-16, 1998.
SOTCHAVA, V.B. O estudo dos geossistemas: métodos em questão, n. 16. IGEOG/USP. São Paulo, 1976.
STOLF, R. Operação do penetrômetro de impacto modelo. Piracicaba: IAA/PLANALSUCAR, Boletim n.2, 8p, 1983.
TRICART, J. Ecodinâmica. Rio de Janeiro: FIBGE, 1977.
VIEIRA, S. R.; HATFIELD, J.L.; NIELSON, D.R.; BIGGAR, J.W. Geoestatistical theory and application to variability of some agronomical properties. Hilgardia, Berkeley, v.15, n. 3, p.1-75, 1983.