Artigo
*e-mail: [email protected]
A HIGHLY SELECTIVE FLUORESCENT SENSOR FOR DETECTION OF TRIVALENT METAL IONS BASED ON A SIMPLE SCHIFF-BASE
Yongjie Dinga,b and Chunxiang Zhaoa,*
aCollege of Chemistry and Chemical Engineering, Zhoukou Normal University, Zhoukou 466001, P. R. China bInstitute of Medicinal Chemistry, Zhoukou Normal University, Zhoukou 466001, P. R. China
Recebido em 20/12/2017; aceito em 19/03/2018; publicado na web em 10/04/2018
A simple and easily synthesized fluorescent sensor L, based on condensation reaction of 1-Naphthylamine and terephthalaldehyde, was synthesized and characterized systemically. Both UV-vis and fluorescence spectroscopic studies indicated that the sensor L showed good selectivity toward trivalent metal ions (such as Al3+, Fe3+, Cr3+, La3+ and Ce3+) over other monovalent or divalent metal
ions. The sensing mechanism was suggested that the trivalent ion promoted the hydrolysis of Schiff base. Meanwhile, took the common trivalent ions Al3+, Fe3+ and Cr3+ as examples, limit of detection (LOD) values of sensor L were calculated to be 1.23, 0.94
and 1.14 nM for Al3+, Cr3+ and Fe3+, respectively, suggesting very high sensitivity towards the cations which could make it attractive
in trivalent metal ions detection.
Keywords:Schiff-base; crystal structure; fluorescence sensor; trivalent metal ion; hydrolysis.
INTRODUCTION
In recent years, a great deal of interest has been focused on the design and synthesis of fluorescent sensors, because they display intriguing features such as high sensitivity, selectivity, rapidity and easy operational procedure.1-3 Their potential applications include their use as sensors to identify metal ions in biological, environmental testing and sewage treatment.4,5 Due to the fluorescence quenching effects of biologically important ions, the development of fluorescence turn-on sensors still remains an important endeavor. Thus, many fluorescence sensors for metal ions have been developed. However, most of them are useful to detect momovalent metal ions or divalent metal ions.6-9 Development of fluorescence sensors for trivalent metal ions like Al3+, Fe3+ and Cr3+, is still a need because they play very important roles in a wide range of environmental and biological processes. For example, Fe3+ is connected with enzyme catalysis and cellular metabolism.10 The disorder of Fe3+ can induce serious disorders such as Huntington, anemia and hemochromatosis.11-13 Aluminum is found abundantly in nature which is about 8 percent of the earth’s surface. It occurs in nearly all rocks and soils, in vegetation, in water and the human body. Nowadays, a large amount of medical research reveals that excessive absorption of aluminum can cause many health hazards such as Alzheimer’s diseases, Parkinson’s diseases and even breast cancer.14-17 Trivalent chromium is an essential component of a balanced human and animal diet. Insufficient intake of Cr3+ increases the risk for diabetes and cardiovascular diseases, whereas excessive intake causes genotoxic effects.18,19
Recently, much effort has been devoted to develop fluorescent probes for the detection trivalent metals ions like Al3+ or Fe3+ or Cr3+.20-22 However, the development of turn-on sensors for multiple trivalent ions simultaneously has been found to be comparatively more difficult than for other metal ions owing to the paramagnetic quenching nature of Fe3+ and Cr3+ as well as the weak coordinating ability of Al3+ ions.23 Therefore, only few probes are known for detection of simultaneously multiple trivalent ions. Previously, there are some “turn-on” fluorescent probes containing C=N bond for detecting some trivalent metal ions (for example, Al3+) based
on chelating trivalent metal ions to prevent the C=N isomerization or/and PET (photoinduced electron transfer) process.24-26 However, there is no probe simultaneously detecting multiple trivalent ions on account of the hydrolysis of the imine group. Herein, we designed and synthesized a new Schiff base L
benzene-1,4-diylbis[N-(naphthalen-1-yl)methanimine] derived from naphthylamine and terephthalaldehyde in a simple approach as fluorescent sensor for trivalent metal ions. The sensor exhibited remarkably enhanced intensity in its fluorescence emission in presence of trivalent ion (such as Al3+, Fe3+, Cr3+, La3+ and Ce3+) over other monovalent or divalent metal ions examined. The sensing mechanism was suggested that the trivalent ion promoted the hydrolysis of Schiff base.
EXPERIMENTAL
Materials and instruments
All solvents and reagents were purchased as analytical grade from Sigma-Aldrich and used without further purification. Stock solution (1.0 × 10⁻³ mol L-1) of metal ions (nitrate and chloride salt) were prepared using in two-distilled water. The stock solution of sensor
L (1.0 × 10⁻³ mol L-1) was prepared in acetonitrile.
1H-NMR spectra was recorded on a Bruker AV-400 spectrometer. The MS spectra was performed on Bruker Esquire 3000 Plus Ion Trap Mass Spectrometer. The IR spectra were collected on a Thermo Electron Nicolet 6700 FT-IR spectrometer with KBr pellets in the range 4000-400 cm-1. Elemental analysis was determined on an Elementar Vario EL III spectrometer. UV-vis spectra were examined on a Pgeneral TU-1901 spectrophotometer. Fluorescent spectra were recorded in Agilent Cary Eclipse spectrometer at room temperature. Melting point was determined on a Beijing XT4-100x microscopic melting point apparatus.
Synthesis of sensor L
and the precipitate formed was filtered and washed with ethanol and dried in vacuum. Block-shaped golden single crystals suitable for single crystal X-ray diffraction were grown from ethyl acetate by slow evaporation of the solvent over a period of several days. The compound L was characterized by elemental analysis, IR, 1H-NMR (Figures 1S-2S in Supplementary Material). Yield: 81% (2.32 g); C28H20N2: Anal. Found: C, 86.38; H, 5.67; N, 7.24%. Calc.: C, 87.47; H, 5.24; N, 7.29%; IR (KBr, cm-1): ν
H-C=, 3046, νC=N, 1615, νC-N, 1265. 1H NMR (400 MHz, δ, ppm in DMSO-d6): 8.86 (s, -CH=N, 2H), 8.36 (t, 2H), 8.28 (s, 4H), 7.98 (t, 2H), 7.85 (d, 2H), 7.59 (m, 6H), 7.33 (d, 2H). M.p.:184.7-185.4 oC.
Crystal structure determination
Crystallographic measurements were made on a Bruker Smart CCD single-crystal diffractometer with MoKα radiation
(λ = 0.71073 Å) by using φ and ω scan techniques at room temperature. Accurate unit cell parameters and the orientation matrix were obtained from least-squares refinement using the programs SMART and SAINT, and the data were integrated using SAINT. The
structure was solved by Direct Methods (SHELXS-97) and refined by
full-matrix least-squares techniques on F2 using SHELXS-97.27
RESULTS AND DISCUSSION
Structure description of sensor L
The crystallographic data for sensor L was summarized in
Supplementary Information (Tables 1S-4S) and the structure was shown in Figure 1. In the structure of compound L, all bond lengths
were within normal ranges. The bond length of C(12)-N(1)(1.272(2) Å) conformed to the value for a carbon-nitrogen double bond, while the bond length of C(4)-N(1)(1.4149(19) Å) conformed to the value for a carbon-nitrogen single bond. Besides, the compound L was
non-planar. The dihedral angle between the two rings (naphthalene and phenyl ring) was 62.17o.
Selectivity studies
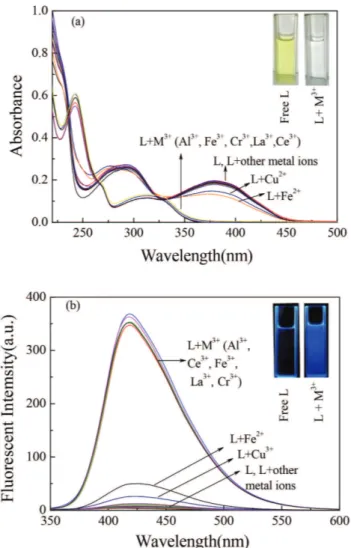
The selectivity abilities of the sensor L were determined by monitoring changes of the UV-vis absorption spectra and fluorescence spectra in the presence of various metal ions (Na+, K+, Ag+, Mg2+, Ca2+, Co2+, Ni2+, Cu2+, Zn2+, Cd2+, Hg2+, Fe2+, Pb2+, Al3+, Cr3+, Fe3+, La3+, Ce3+) in the 10 µmol L-1 concentration of each component in ethanol solution (Figure 2). It could be seen from Figure 2a that the absorption spectrum of sensor L exhibited two bands at 295 nm and 382 nm,
corresponding to the π-π* transition of the aromatic rings and n-π* transition of the C=N group respectively which also were supported by the formation of the sensor L.28,29 Upon addition of Al3+, Fe3+, Cr3+, La3+and Ce3+ ions, two significant absorption bands centered at about 250 nm and 327 nm were clearly observed, while the bands at 295 nm and 382 nm disappeared. Meanwhile, these changes were also accompanied with a nakyed-eye color variation from pale yellow to colorless after addition of Al3+, Fe3+, Cr3+, La3+and Ce3+ ions (Figure 2a inset). For the other test monovalent and divalent cations, the UV-vis absorption spectra of sensor L exhibited no obvious changes.
The fluorescence response of sensor L (10 µmol L-1) upon addition of various metal ions (10 µmol L-1) were recorded at an excitation wavelength of 327 nm. As shown in Figure 2b, the free sensor L
displayed a weak single fluorescence emission band at 418 nm. Upon addition of various metals ions (Na+, K+, Ag+, Mg2+, Ca2+, Co2+, Ni2+, Cu2+, Zn2+, Cd2+, Hg2+, Fe2+, Pb2+) no significant changes were observed. But on addition of Al3+, Fe3+, Cr3+, La3+and Ce3+ ions, sensor
L exhibited a prominent fluorescence enhancement, indicating that the
sensor L exhibited “off-on” mode with high sensitivity towards Al3+, Fe3+, Cr3+, La3+and Ce3+ ions over other metal ions which were used. The fluorescence quantum yield of sensor L increased from 0.006 to 0.63, 0.62 and 0.59 in the presence of 1.0 equivalent of common trivalent ion Al3+, Fe3+ and Cr3+, respectively. Based on the use a UV lamp, the solution of sensor L showed a dramatic color change from
Figure 1. The structure of the sensor L (Displacement ellipsoids were drawn at the 30 % probability level)
Figure 2. (a) UV-vis absorbance spectra and (b) Fluorescence spectra
colorless to bright blue in the presence of M3+, which could easily be detected by the naked-eye (Figure 2b inset). At the same time, the addition of other metal ions did not show any significant color change. The results revealed that sensor L had a high selectivity
for the trivalent metal ions (Al3+, Fe3+, Cr3+, La3+and Ce3+) over the common metal ions.
Titration experiments
To observe the UV-vis and fluorescent properties of sensor L
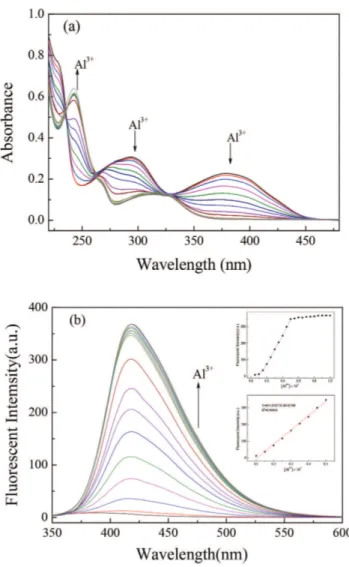
towards trivalent ions, spectrometric titration experiments with increasing concentrations of M3+ were performed. With the increase of the concentration of Al3+ aqueous solution, the original absorption bands at 295 nm and 382 nm decreased along with progressive appearance of two new absorption bands centered at 250 nm and 327 nm (Figure 3a). Meanwhile, two clear isosbestic points at 263 nm and 327 nm were observed during the titration process. In addition, the absorption spectra showed no significant changes when addition of Al3+ exceeded 0.5 equiv. Similar results were also found for Cr3+ and Fe3+. (Figure 3Sa and Figure 4Sa, Supporting Material).
By gradually adding Al3+, the fluorescence intensity at 418 nm increased step by step and reached saturation when 0.5 equiv of Al3+ was added to solution of L (Figure 3b), which was well consistent with the UV-vis absorption spectra (Figure 3a). Similar results were also
found for Cr3+ and Fe3+, and the saturation concentrations were also 0.5 equiv of Cr3+ and Fe3+ (Figure 3Sb and 4Sb, Supporting Material). Based on the fluorescence titration data, the limit of detection (LOD) was determined according to the definition of IUPAC by following the 3σ method.30 LOD values of sensor L were calculated to be 1.23, 0.94 and 1.14 nmol L-1 for Al3+, Cr3+ and Fe3+, respectively. These results indicated that sensor L was sufficiently sensitive to detect trace level Al3+, Cr3+ and Fe3+ ions.
Interference experiments
In order to validate the high selectivity of sensor L toward trivalent
ions, the fluorescence interference experiments of other various metal ions were also investigated. As shown in Figure 4, when the
L-Al3+ solution was mixed with other metal ions (Na+, K+, Ag+, Mg2+, Ca2+, Co2+, Ni2+, Cu2+, Zn2+, Cd2+, Hg2+, Fe2+, Pb2+), the fluorescence emission intensities did not show significant variation by comparison with the fluorescence intensity of L-Al3+ solution. The interference experiments were also performed using Cr3+and Fe3+, and the results were similar as Al3+ (Figure 5S and 6S, Supporting Material). All the results indicated that the sensor L could be used as a highly selective fluorescent sensor for trivalent ions.
The pH effect
The fluorescence responses of sensor L in the absence and presence of M3+ (such as Al3+, Cr3+ and Fe3+) (1 equiv) at different pH values were investigated (Figure 5). In the absence of trivalent metal ions, the fluorescence intensity of sensor L increased dramatically
when the pH value gone up from 2 to 4. In the presence of trivalent metal ions at the same pH range of 2-4, the fluorescence responses were silimilar to that of the absence of M3+. However, it could be clearly seen that the fluorescene emission was greatly enhanced upon addition of M3+ (Al3+, Cr3+ and Fe3+) from pH 5 to 10, indicating the M3+ exerted a remarkable influence on the fluorescence response feature of sensor L over a broad range of pH. Upon the pH value was higher than 10, the fluorescent intensity decreased dramatically, which might be caused by the formation of metal hydroxide.31 The best pH under experimental conditions was 7.0, which was within the biologically relevant pH range (5.7-7.5),32 indicating that L could be applied as Al3+, Cr3+ and Fe3+ sensor under neutral environmental.33
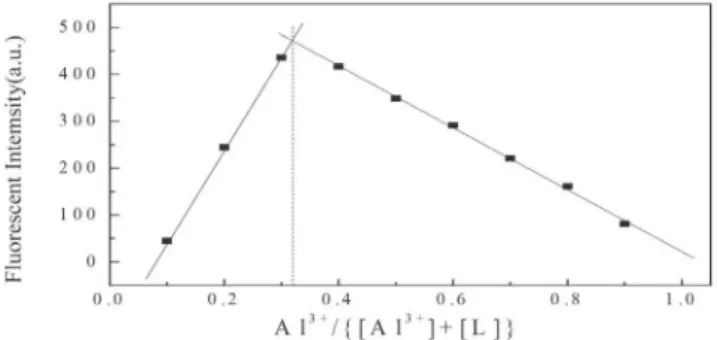
Job’s plot
For further determination of stoichiometry between L and M3+, Job’s plot analyses were used. The total concentration of L and M3+
Figure 3. (a) UV-vis absorbance spectra and (b) Fluorescence spectra
(λex=327 nm) of sensor L (10 µmol L-1) with gradual addition of Al3+ in ethanol solution (0.05, 0.1, 0.15, 0.2, 0.25, 0.3, 0.35, 0.4, 0.45, 0.5, 0.55, 0.6, 0.65, 0.7, 0.75, 0.8, 0.85, 0.9, 0.95, 1.0 equiv)
in each sample was 20 µmol L-1, in the experimental process, the concentration of L and M3+ changed correspondingly. In Figure 6, the plot of fluorescence intensity versus [Al3+]/[Al3++L] showed the maximum fluorescence value was 0.33, which indicated that the 2:1 stoichiometry between L and M3+ in ethanol solution. Similar results were also found for Cr3+ and Fe3+ (Figure 7S and 8S, Supporting Material).
The sensing mechanism
Took the common trivalent ion Al3+ as examples, we illuminated the sensor L recogniting M3+ mechanism using the combination of 1H NMR, IR and ESI-MS spectra. As shown in Figure 7a, free sensor L had a singlet at 8.86 ppm assinged to imine protons (-CH=N). Interestingly, a new but low intersity proton peaks emerged at 10.12 ppm upon the addition of Al3+ to L in DMSO-d6. The new proton peak at 10.12 ppm suggested the formation of an aldehyde group which was also confirmed by its IR spectrum via the appearance of a C=O stretching band at 1700 cm-1 (Figure 7b). Additionally, the mass spectral analysis showed peaks cooresponding to 1-naphthylamine 2 (at m/z 262.0009 for [2 + Al + C2H5OH + C2H5OH], m/z 335.9937 for [2 + 2 + Al + Na] and m/z 644.2734 for [2 + 2 + 2 + 2+ Al + C2H5OH -H]) (Figure 7c). These studies implied that the imine group of sensor L might be converted back to the carbonyl group in the presence of Al3+.
As illustrated in Figure 1, the C=N functional group of the sensor
L was expected to change the fluorescence response. According to
the literature, the imine group in the Schiff base could be destroyed by hydrolysis reactions in the acidic solvent.34 The trivalent metal ion solutions were acidic which could generate acids in protic solvents.35 Figure 5 clearly demonstrated that the intensity of the fluorescence signal of L in the acidic pH range was almost similar
to that achieved in presence of the trivalent metal ions in ethanol. Figure 7 suggested that the sensor L was hydrolyzed in the presence of the trivalent metal ion Al3+. Additionally, the UV-vis absorption and fluorescence spectra of sensor L in the presence of 0.5 equiv M3+ exhibited a similar pattern as that of 1-naphthylamine (Figure 9S and 10S, Supporting Material). Based on the above mentioned results, the possible hydrolysis mechanism of sensor L in the presence of M3+ was proposed and shown in Scheme 1. The free sensor L was almost non-fluorescence probably due to the C=N isomerization.36 In the presence of trivalent metal ions, the fluorescence intensity of L was increased dramatically. The distinct color change and the obvious fluorescence enhancement of L was due to M3+-promoted hydrolysis of Schiff base, which leaded to the the cleavage of the imine bond to generate fluorescent amine and aldehyde.
Figure 5. The pH effect on fluorescence responses (418 nm) of L and presence of M3+ (Al3+, Cr3+ and Fe3+) (1 equiv) (λex=327 nm)
Figure 6. Job’s plot according to the method for continuous variations,
indication the 2:1 stoichiometry between L and M3+ (the total concentration of L and Al3+ was 20 µmol L-1) (λex=327 nm)
CONCLUSIONS
In summary, a very simple fluorescence sensor L benzene-1,4-diylbis[N-(naphthalen-1-yl)methanimine] was synthesized and used as a fluorescence “turn-on” sensor for trivalent ion recognition. Studies showed that sensor L exhibited good selectivity and sensitivity
toward trivalent ions (Al3+, Cr3+, Fe3+, La3+ and Ce3+) over other monovalent or divalent metal ions. The sensing mechanism was suggested that the trivalent ion promoted the hydrolysis of Schiff base, which leaded to the the cleavage of the imine bond to generate fluorescent amine and aldehyde. Furthermore, the sensor L exhibited a low limet of detection which could make it have opotential application in real water samples for trivalent ion detection.
SUPPLEMENTARY MATERIAL
Additional information on characterization of sensor L using IR spectrum (Figure 1S), 1H-NMR spectrum (Figure 2S), UV-vis absorbance spectra and Fluorescence spectra of sensor L with gradual addition of Cr3+ and Fe3+ (Figure 3S, 4S), The selectivity of sensor
L for Cr3+ and Fe3+ (Figure 5S, 6S), Job’s plot of L-Cr3+ and L-Fe3+ (Figure 7S, 8S), crystallographic data (Tables 1S-4S) and CCDC 1529007 containing the crystallographic data for the sensor L can be found at http://quimicanova.sbq.org.br in PDF format, with free access.
ACKNOWLEDGEMENTS
This work is supported by the Key Scientific Research Project of Colleges and Universities of Henan Province (No. 17A150057), the Program for Science and Technology of Henan Province of China (No. 172102310626) and the Natural Science Foundation of Education Department of Henan Province of China (No. 16B416001).
REFERENCES
1. Kumar, J.; Bhattacharyya, P. K.; Das, D. K.; Spectrochim. Acta, Part A 2015, 138, 99.
2. Gupta, V. K.; Singh, A. K.; Mergu, N.; Electrochim. Acta 2014, 117, 405.
3. Qin, J. C.; Cheng, X. Y.; Fang, R.; Wang, M. F.; Yang, Z. Y.; Li, T. R.; Li, Y.; Spectrochim. Acta, Part A 2016, 152, 352.
4. Yang, L. L.; Zhu, W. J.; Fang, M.; Zhang, Q.; Li, C.; Spectrochim. Acta, Part A 2013, 109, 186.
5. Zhang, S. J.; Li, H.; Gong, C. L.; Wang, J. Z.; Wu, Z. Y.; Wang, F.; Synth. Met. 2016, 217, 37.
6. Li, Y.; Yu, H. J.; Shao, G.; Gan, F.; J. Photochem. Photobiol. A 2015, 301, 14.
7. Santhoshkumar, S.; Velmurugan, K.; Prabhu, J.; Radhakrishnan, G.; Nandhakumar, R.; Inorg. Chim. Acta. 2015, 439, 1.
8. Tang, L. J.; Wu, D.; Huang, Z. L.; Bian, Y. J.; J. Chem. Sci. 2016, 128, 1337.
9. Feng, L.; Shi, W.; Ma, J. C.; Chen, Y. B.; Kui, F.; Hui, Y. H.; Xie, Z. F.; Sens. Actuators 2016, 237, 563.
10. Meneghini, R.; Free Radical Biol. Med. 1997, 23, 783.
11. Berggren, K. L.; Chen, J. F.; Fox, J.; Miller, J.; Dodds, L.; Dugas, B.; Vargas, L.; Lothian, A.; McAllum, E.; Volitakis, I.; Roberts, B.; Bush, A. I.; Fox, J. H.; Redox Biol. 2015, 4, 363.
12. Panwar, B.; Gutiérrez, O. M.; Semin. Nephrol. 2016, 36, 252. 13. Yun, S.; Vincelette, N. D.; Critical Reviews in Oncology/Hematology
2015, 95, 12.
14. Nayak, P.; Environ. Res. 2002, 89, 101.
15. Fasman, G. D.; Coord. Chem. Rev. 1996, 149, 125. 16. Campdelacreu, J.; Neurología 2014, 29, 541. 17. Darbre, P. D.; J. Inorg. Biochem. 2005, 9, 1912. 18. Peng, M.; Yang, X. P.; J. Inorg. Biochem. 2015, 146, 97.
19. Bigorgne, E.; Cossu-Leguille, C.; Bonnard, M.; Nahmani, J.; Chemosphere 2010, 80, 1109.
20. Zhu, J. L.; Zhang, Y. H.; Wang, L.; Sun, T. M.; Wang, M.; Wang, Y. P.; Ma, D. Y.; Yang, Q. Q.; Tang, Y. F.; Tetrahedron Lett. 2016, 57, 3535. 21. Wang, J. H.; Zhang, D.; Liu, Y. Q.; Ding, P. G.; Wang, C. C.; Sens.
Actuators, B 2014, 191, 344.
22. Li, D.; Li, C. Y.; Qi, H. R.; Tan, K. Y.; Li, Y. F.; Sens. Actuators, B 2016, 223, 705.
23. Erdemir, S.; Kocyigit, O.; Talanta 2016, 158, 63.
24. Zhang, Y. G.; Shi, Z. H.; Yang, L. Z.; Tang, X. L.; An, Y. Q.; Ju, Z. H.; Liu, W. S.; Inorg. Chem. Commun. 2014, 39, 86.
25. Sen, B.; Sheet, S. K.; Thounaojam, R.; Jamatia, R.; Pal, A. K.; Aguan, K.; Khatua, S.: Spectrochim. Acta, A 2017, 173, 537.
26. Sheet, S. K.; Sen, B.; Thounaojam, R.; Aguan, K.; Khatua, S.; J. Photochem. Photobiol., A 2017, 332, 101.
27. Sheldrick, G. M.; SHELXS/L-97, Programs for Crystal Structure Determination, University of Göttingen: Göttingen, 1997.
28. Arunagiri, C.; Subashini, A.; Saranya, M.; Muthiah, P. T.; Thanigaimani, K.; Razak, I. A.; Spectrochim. Acta, A 2015, 135, 307.
29. Sek, D.; Siwy, M.; Bijak, K.; Filapek, M.; Malecki, G.; Nowak, E. M.; Sanetra, J.; Jarczyk-Jedryka, A.; Laba, K.; Lapkowski, M.; Schab-Balcerzak, E.; J. Electroanal. Chem. 2015, 751, 128.
30. Liu, L. H.; Wang, A. X.; Wang, G.; Li, J. X.; Zhou, Y. H.; Sens. Actuators, B 2015, 215, 388.
31. Saleh, S. M.; Ali, R.; Ali, I. A.; Spectrochim. Acta, Part A 2017, 183, 225.
32. Shi, Z. H.; Tang, X. L.; Zhou, X. Y.; Cheng, J.; Han, Q. X.; Zhou, J. A.; Wang, B.; Yang, Y. F.; Liu, W. S.; Bai, D. C.; Inorg. Chem. 2013, 52, 12668.
33. Xu, Y. L.; Mao, S. S.; Peng, H. P.; Wang, F.; Zhang, H.; Aderinto, S. O.; Wu, H. L.; J. Lumin. 2017, 192, 56.
34. Wang, J. M.; Li, Y. Y.; Li, K.; Meng, X. R.; Hou, H. W.; Chem. Eur. J. 2017, 23, 5081.
35. Rajamathi, M.; Kamath, P. V.; Bull. Mater. Sci. 2000, 23, 355. 36. Wu, J. S.; Liu, W. M.; Zhuang, X. Q.; Wang, F.; Wang, P. F.; Tao, S. L.;
Zhang, X. H.; Wu, S. K.; Lee, S. T.; Org. Lett. 2007, 9, 33.
Scheme 1. The proposed sensing mechanism of sensor L for trivalent ions