Genetic Risk Analysis of Coronary Artery Disease in a
Population-based Study in Portugal, Using a Genetic Risk Score of 31 Variants
Andreia Pereira,
1Maria Isabel Mendonça,
1Sofia Borges,
1Sónia Freitas,
1Eva Henriques,
1Mariana Rodrigues,
1Ana Isabel Freitas,
2Ana Célia Sousa,
1António Brehm,
2Roberto Palma dos Reis
3Unidade de Investigação, Hospital Dr. Nélio Mendonça,1 Funchal – Portugal Laboratório de Genética Humana, Universidade da Madeira,2 Funchal – Portugal Faculdade de Ciências Médicas, Universidade Nova de Lisboa,3 Lisboa – Portugal
Mailing Address: Andreia Pereira •
Avenida Luís de Camões, nº 57. Postal Code 9004-514, Funchal – Portugal E-mail: andreiapereira21@gmail.com
Manuscript received June 14, 2017, revised manuscript October 12, 2017, accepted February 22, 2018
DOI: 10.5935/abc.20180107
Abstract
Background: Genetic risk score can quantify individual’s predisposition to coronary artery disease; however, its usefulness as an independent risk predictor remains inconclusive.
Objective: To evaluate the incremental predictive value of a genetic risk score to traditional risk factors associated with coronary disease.
Methods: Thirty-three genetic variants previously associated with coronary disease were analyzed in a case-control population with 2,888 individuals. A multiplicative genetic risk score was calculated and then divided into quartiles, with the 1st quartile as the reference class. Coronary risk was determined by logistic regression analysis. Then, a second logistic regression was performed with traditional risk factors and the last quartile of the genetic risk score. Based on this model, two ROC curves were constructed with and without the genetic score and compared by the Delong test. Statistical significance was considered when p values were less than 0.05.
Results: The last quartile of the multiplicative genetic risk score revealed a significant increase in coronary artery disease risk (OR = 2.588; 95% CI: 2.090-3.204; p < 0.0001). The ROC curve based on traditional risk factors estimated an AUC of 0.72, which increased to 0.74 when the genetic risk score was added, revealing a better fit of the model (p < 0.0001). Conclusions: In conclusion, a multilocus genetic risk score was associated with an increased risk for coronary disease in our population. The usual model of traditional risk factors can be improved by incorporating genetic data. (Arq Bras Cardiol. 2018; [online].ahead print, PP.0-0)
Keywords: Coronary Artery Disease / history; Coronary Artery Disease / morbidity; Mortality; Polymorphism, Genetic; Epidemiology; Risk Factors.
Introduction
Coronary artery disease (CAD) has become a major health problem worldwide, with increasing prevalence and high morbidity and mortality. Traditional risk factors (TRFs) are insufficient to identify asymptomatic high-risk individuals. Epidemiology and family studies have long documented that approximately 50% of the susceptibility for heart disease is genetic.1 Knowledge of genetic predisposition to cardiac disease
is crucial for its comprehensive prevention and treatment. Although much of the genetic basis of coronary disease remains to be discovered, some progress has been made using both candidate gene and genome-wide association studies (GWAS).2
In fact, a number of genetic variants have been previously identified at several genomic regions associated with CAD.2
Until now, the risk attributable to any individual variant has been modest. However, discovering and combining multiple loci with modest effects into a global genetic risk score (GRS) could improve the identification of high-risk populations and improve individual risk assessment.
Therefore, the purpose of this work was to generate a multilocus GRS based on common variants previously shown to be associated with CAD, and evaluate whether it is independent of TRFs and improves the predictive ability of a model based only on TRFs.
Methods
Study Population
Study population was enrolled from GENEMACOR (GENEs in Madeira Island Population with CORonary artery disease), a population-based ongoing case-control registry of CAD with 2,888 participants, 1,566 cases (mean age 53.3 ± 8.0 years, 79.1% male) and 1322 controls (mean age 52.7 ± 7.8 years, 76.4% male). Cases were selected from patients discharged after being admitted for myocardial infarction/unstable angina diagnosed according to the previously described
criteria,3 or with CAD confirmed by coronary angiography
with ≥ 1 coronary lesions of ≥ 70% stenosis in ≥ 1 major coronary artery or its primary branches. Absent or non-flow limiting atheroma was excluded from the analysis. The control group consisted of healthy volunteers, without symptoms or history of CAD, selected from the same population. All controls underwent clinical assessment of conventional cardiovascular risk factors, an electrocardiogram (ECG), and, in doubtful cases, an exercise stress test, a stress echocardiography or computerized tomography for calcium scoring. Cases and controls were matched for gender and age.
Inclusion criteria comprised an age limit of 65 years and being a permanent resident to avoid genetic admixture. Principal Component Analysis (PCA)4 was used for analysis
of population stratification for possible genetic admixture and detection of significant genetic outliers (< 5%).4
The study was approved by the Hospital ethics committee according to the Declaration of Helsinki and all patients provided written informed consent.
Data collection
Data was collected from all subjects in a standardized file comprising demographic, clinical characteristics and TRFs traditional risk factors (gender, age, level of exercise, smoking status, arterial hypertension, dyslipidemia, diabetes, family history of CAD, body mass index (BMI), heart rate and pulse wave velocity (PWV).
“Smokers” referred to current smokers or subjects with less than 5 years of smoking cessation.5
Essential hypertension was considered when patients, at the entry into this study, were already diagnosed and/or had been on antihypertensive medication for more than 3 months or newly diagnosed hypertensives with systolic blood pressure (SBP)/diastolic blood pressure (DBP) ≥ 140/90 mmHg measured on at least 3 occasions.6
Dyslipidemia was defined for control population as low-density lipoprotein (LDL) > 140 mg/dL, high-density lipoprotein (HDL) < 45 mg/dL for women and < 40 mg/dL for men, Triglycerides > 150 mg/dL and apolipoprotein (Apo) B > 100 mg/dL. For patients (at high risk) dyslipidemia was considered when LDL > 100, HDL < 45 mg/dL for women and < 40 mg/dL for men, triglycerides > 150 mg/dL, Apo B > 100 mg/dL and non-HDL (total cholesterol-HDL) > 130 mg/dL.7
Subjects were classified as having diabetes if they were taking oral anti-diabetic medication or insulin or if their fasting plasma glucose was higher than 7.0 mmol/L or 126 mg/dL.8
Subjects were considered to have a family history of premature cardiovascular disease (CVD) if the father or brother had been diagnosed with CVD under the age of 55 or mother or sister under the age of 65.
The definition of other TRFs was based on the standard criteria, as previously reported.9,10
Biochemical analysis
Blood samples were extracted after 12 hours’ fasting. Biochemical analyses were performed at the Central
Laboratory of the Hospital, according to standard techniques. In order to determine total cholesterol, HDL, LDL, triglycerides and glucose, blood samples were placed in dry tubes, centrifuged half an hour later at 3,500 g and subsequently quantified by an enzymatic technique using an “AU 5400” (Beckman Coulter) autoanalyzer. Biochemical markers such as lipoprotein-a – Lp(a), (Apo B), and high-sensitivity C-reactive protein (hs-CRP) were quantified by immunoturbidimetry also using an “AU 5400” (Beckman Coulter) automatic system.
Single Nucleotide Polymorphisms (SNP) selection
Two parallel approaches were employed to identify SNPs for the GRS. In the first approach, we searched the National Human Genome Research Institute database, which included SNPs identified by means of GWAS and catalogued based on phenotype and/or trait. We searched for the keywords: “coronary artery disease”, “coronary disease”, “myocardial infarction” and “early myocardial infarction.” The second approach included SNPs that were identified through candidate gene approaches, included in a published GRS for CAD.
Including criteria included genes described in previous studies with an Odds Ratio (OR) for CAD ≥ 1.1 and a minor allele frequency (MAF) > 5%. Genes with low Hardy-Weinberg equilibrium (p < 0.002) (after Bonferroni correction) were excluded.
In total, 33 SNPs were selected according to their possible CAD-related function: association with cell cycle, cellular migration and inflammation (rs1333049 (9p21.3), rs4977574 (CDKN2B), rs618675 (GJA4), rs17228212 (SMAD3), rs17465637 (MIA3), rs12190287 (TCF21), rs3825807 (ADAMTS7), rs11556924 (ZC3HC1), rs12526453 (PHACTR1)); genes involved in pro-oxidative status (rs1801133 (MTHFR 677), rs1801131 (MTHFR 1298), rs705379 (PON 1), rs662 (PON 192), rs854560 (PON 55), rs6922269 (MTHFD1L); genes associated with modifiable risk factors such as lipids metabolism, hypertension and diabetes/obesity (rs3798220 (LPA), rs2114580 (PCSK9), rs20455 (KIF6), rs7412/rs429358 (APOE), rs964184 (ZNF259), rs599839 (PSRC1), rs5186 (AT1R), rs699 (AGT), rs4340 (ACE), rs4402960 (IGF2BP2), rs1326634 (SLC30A8), rs266729 (ADIPOQ), rs7903146 (TCF7L2), rs17782313 (MC4R), rs1801282 (PPARG), rs1884613 (HNF4A), rs8050136 (FTO) and rs1376251 (TAS2R 50)) (Supplementary Table 1).
Genetic analyses
Genetic analyses were performed at the Human Genetics Lab of the University of Madeira. Genomic DNA was extracted from 80 µl of peripheral blood using a standard phenol-chloroform method. A TaqMan allelic discrimination assay for genotyping was performed using labelled probes and primers pre-established by the supplier (TaqMan SNP Genotyping Assays, Applied Biosystems).
All reactions were done on an Applied Biosystems 7300 Real Time PCR System and genotypes were determined using the 7300 System SDS Software (Applied Biosystems, Foster City, USA) without any prior knowledge of individual’s clinical data. Quality of genotyping techniques was controlled by the
inclusion of one non-template control (NTC) in each plate of 96 wells. All SNPs TaqMan assays had blind duplicates accounting for 20% of all samples. Some SNP genotypes were randomly confirmed by conventional direct DNA sequencing, as 10-15% of all samples were re-amplified for sequencing. Call rates for SNPs in the GRS were 98%-100% and a minimum 95% call rate was set for quality control.
Computation of the GENETIC RISK SCORE
We have tested several models to construct the GRS using both non-weighted and weighted scores, taking into consideration each pattern of inheritance for each gene locus. An additive score (AGRS) was generated, i.e., for each one of the 31 variants a score of 0, 1, and 2 was defined as there were 0, 1 or 2 risk alleles, by calculating the accumulated sum of the risk alleles in these variants. Each individual could be assigned a GRS of 0-62. Additionally, a multiplicative GRS (MGRS) was calculated by multiplying the relative risk for each genotype.
Validation of the risk score calculation was performed in a random sample of 597 patients (20%).
Statistical analysis
Categorical variables were expressed by frequencies and percentages and compared by the Chi-squared test or Fisher’s exact test. Continuous variables were expressed as mean ± standard deviation (SD) or median (1st quartile – 3rd quartile) and compared by Student's t-test (unpaired) or Mann-Whitney, as appropriate. The Kolmogorov-Smirnov test and the Levene´s test were used to test the assumption of normality and the homogeneity of the variables. All analyses were considered significant when p values were less than 0.05.
Binary logistic regression was used to determine the combined and separate effects of the variables on the risk for angiographic CAD. GRS was modeled using as a continuous variable and as quartiles, using the first quartile as the reference category. Multivariate analyses were used to adjust for 7 covariates also reported to be associated with CAD. We plotted receiver operating characteristic (ROC) curves and calculated the area under the curve (AUC) for logistic regression models including TRFs without and with GRS (quartiles). Pairwise comparison of ROC curves was performed using the Delong test.11 The model calibration
was tested with Hosmer-Lemeshow goodness-of-fit test. A P-value less than 0.05 was considered statistically significant. Collinearity between the variables was measured by assessment of tolerance and variance inflation factor (VIF).
Associations of SNPs with CAD were considered significant at p < 0.05 and in aggregate with GRS models at p < 0.0015 applying Bonferroni correction.
For MAF of 30%, the study had 70% power to detect an OR for CAD of 1.3 and > 90% for OR ≥ 1.35, for 2-sided alpha of < 0.05 for 2,000 cases and 1,000 controls. Power calculations used G power Statistical Power Analyses.
The potential of GRS to improve individual risk stratification then was measured using the net reclassification improvement (NRI) method,12 defined as the percentage of subjects in
each subgroup changing categories when the new model of GRS (in quartiles) was added. The integrated discrimination improvement (IDI), defined as the incremental improvement prognostic value of GRS, was compared between cases and controls. NRI was computed by categorical and non-categorical (continuous) variables using the PredictABEL package available in R software (version 3.2.0).
Statistical analyses were performed using SPSS version 19.0 (IBM), MedCalc version 13.3.3.0 and R software version 3.1.2.
Results
Baseline characteristics of the population
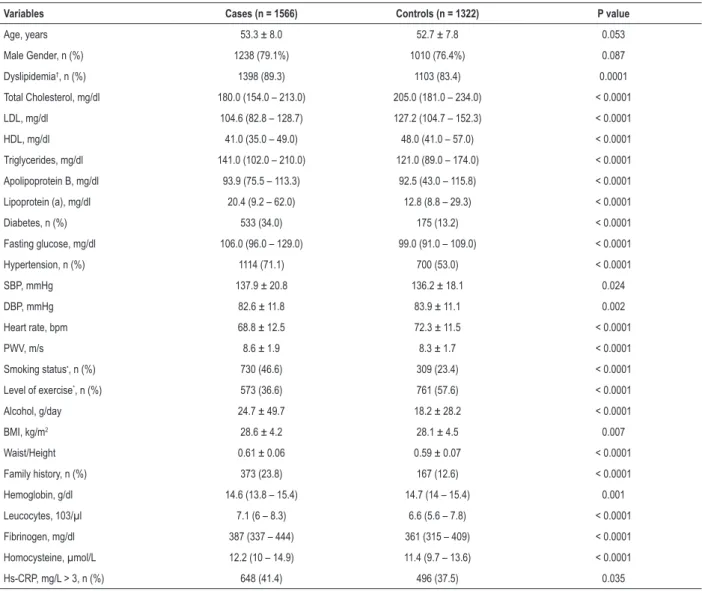
Table 1 shows the baseline characteristics of our population. As expected, cases and controls showed no significant differences concerning gender and age, since this was a selection criterion. Higher frequency of dyslipidemia, diabetes, hypertension, physical inactivity, smoking habit, alcohol consumption, and family history of premature cardiovascular disease was found in CAD patients when compared to the controls (p < 0.0001). Also, PWV, BMI and waist-to-height ratio were higher in cases than in controls, with statistical significance (p < 0.05) (Table 1). The other biochemical variables analyzed such as hemoglobin, leucocytes, fibrinogen, homocysteine and hs-CRP > 3 showed significantly higher levels in the coronary patients group when compared to the controls (p < 0.05) (Table 1).
Computation and analysis of Genetic Risk Score
Deviation from Hardy-Weinberg equilibrium for the 33 genotypes at individual loci were assessed using the Chi-squared test and p < 0.002 with Bonferroni correction for all SNPs included. LPA gene variant was excluded for further analyses due to its low Hardy-Weinberg p-value (p < 0.002). Linkage disequilibrium for the mutually adjusted SNPs within the genes was studied. CDKN2B gene was excluded because of the strong linkage disequilibrium with another selected SNP, rs1333049, which resides in the 9p21 region. The remaining 31 SNPs were included for further analysis (Supplementary Table 1).
In this study, the MGRS had the highest AUC value for assessing the risk for CAD disease with a specificity of 62.3% and sensitivity of 54% (data not shown) and therefore this model was computed in the subsequent analyzes (Supplementary Table 2).
The MGRS of 31 SNPs was significantly higher in CAD cases than in controls (0.67 ± 0.73 vs 0.48 ± 0.53; p < 0.0001), even by quartile and gender discrimination (Table 2).
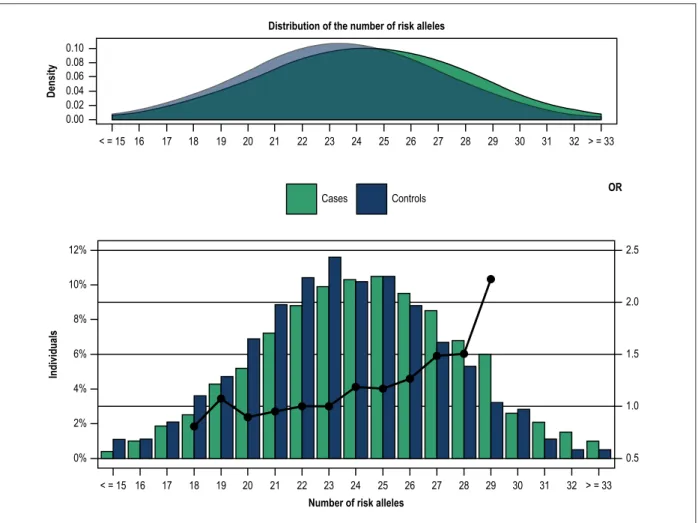
A normal distribution of risk alleles in the total sample set including cases and controls is shown in Figure 1. While CAD patients exhibited lower GRS values, risk alleles were more prevalent in this group than in controls. In CAD patients, a mean of 27 risk alleles was seen in 52% of the individuals, and a mean of 26 risk alleles was found in 53% of controls (Figure 1).
When analyzed in deciles, GRS showed that the increase in the number of risk alleles was significantly associated with CAD
as shown by inter-deciles p values (1st decile: OR = 0.612 (0.439 – 0.853), p = 0.004; 9th decile: OR =0.957 (01.400 – 2.734), p < 0.0001 and last decile: OR = 2.472 (1.755 – 3.482), p < 0.0001) (Figure 2).
A logistic regression analysis was performed with GRS quartiles, using the first as the reference category. Results showed an increase in CAD risk with statistical significance across the 2nd, 3rd and 4th quartiles with respective
ORs and CIs of 1.372 (1.114 – 1.689), 1.878 (1.522 – 2.317) and 2.588 (2.090 – 3.204), respectively (data not shown).
A multivariable predictive model for CAD incorporating GRS quartiles and TRFs is presented in Table 3. The 4th GRS
quartile has intermediate contribution to CAD phenotype
– OR = 2.727 (2.162 – 3.439), greater than dyslipidemia – OR = 1.298 (1.023 – 1.646) and hypertension – OR = 2.067 (1.744 – 2.450). The reduced contribution of dyslipidemia on CAD risk may be due to standard use of statins in CAD patients. Extended adjustment for cofounding variables (gender, age, heart rate, PWV, low exercise level, BMI and family history of CAD) revealed modest increases in the OR for TRFs and the 2nd and 3rd quartiles of GRS.
We used VIF to test for multi-collinearity among the variables included in our GRS adjusted logistic regression model. Tolerance and VIF were respectively > 0.1 and < 10 attesting for no significant collinearity between variables included in the adjustment model.
Table 1 – Baseline characteristics of our study population
Variables Cases (n = 1566) Controls (n = 1322) P value
Age, years 53.3 ± 8.0 52.7 ± 7.8 0.053 Male Gender, n (%) 1238 (79.1%) 1010 (76.4%) 0.087 Dyslipidemia†, n (%) 1398 (89.3) 1103 (83.4) 0.0001 Total Cholesterol, mg/dl 180.0 (154.0 – 213.0) 205.0 (181.0 – 234.0) < 0.0001 LDL, mg/dl 104.6 (82.8 – 128.7) 127.2 (104.7 – 152.3) < 0.0001 HDL, mg/dl 41.0 (35.0 – 49.0) 48.0 (41.0 – 57.0) < 0.0001 Triglycerides, mg/dl 141.0 (102.0 – 210.0) 121.0 (89.0 – 174.0) < 0.0001 Apolipoprotein B, mg/dl 93.9 (75.5 – 113.3) 92.5 (43.0 – 115.8) < 0.0001 Lipoprotein (a), mg/dl 20.4 (9.2 – 62.0) 12.8 (8.8 – 29.3) < 0.0001 Diabetes, n (%) 533 (34.0) 175 (13.2) < 0.0001 Fasting glucose, mg/dl 106.0 (96.0 – 129.0) 99.0 (91.0 – 109.0) < 0.0001 Hypertension, n (%) 1114 (71.1) 700 (53.0) < 0.0001 SBP, mmHg 137.9 ± 20.8 136.2 ± 18.1 0.024 DBP, mmHg 82.6 ± 11.8 83.9 ± 11.1 0.002 Heart rate, bpm 68.8 ± 12.5 72.3 ± 11.5 < 0.0001 PWV, m/s 8.6 ± 1.9 8.3 ± 1.7 < 0.0001 Smoking status•, n (%) 730 (46.6) 309 (23.4) < 0.0001 Level of exercise*, n (%) 573 (36.6) 761 (57.6) < 0.0001 Alcohol, g/day 24.7 ± 49.7 18.2 ± 28.2 < 0.0001 BMI, kg/m2 28.6 ± 4.2 28.1 ± 4.5 0.007 Waist/Height 0.61 ± 0.06 0.59 ± 0.07 < 0.0001 Family history, n (%) 373 (23.8) 167 (12.6) < 0.0001 Hemoglobin, g/dl 14.6 (13.8 – 15.4) 14.7 (14 – 15.4) 0.001 Leucocytes, 103/µl 7.1 (6 – 8.3) 6.6 (5.6 – 7.8) < 0.0001 Fibrinogen, mg/dl 387 (337 – 444) 361 (315 – 409) < 0.0001 Homocysteine, µmol/L 12.2 (10 – 14.9) 11.4 (9.7 – 13.6) < 0.0001 Hs-CRP, mg/L > 3, n (%) 648 (41.4) 496 (37.5) 0.035
† Controls: LDL > 140 mg/dL, HDL < 40 mg/dL for men and < 45 mg/dLfor women; triglycerides > 150mg/dL, APO B > 100 mg/dL. Cases: LDL > 100 mg/dL;
triglycerides > 150 mg/dL, HDL < 40 mg/dL for men and < 45 mg/dL for women; APO B > 100 mg/dL, non HDL > 130 mg/dL; *More than 40 min/week; •Current smokers
or < 5 years of cessation; HDL: high density lipoprotein; LDL: low density lipoprotein; SBP: systolic blood pressure; DBP: diastolic blood pressure; PWV: pulse wave velocity; BMI: body mass index; Hs-CRP: high sensitivity C-reactive protein. Categorical variables compared by the Chi-square test. Continuous variables expressed as mean ± standard deviation (using Student’s t-test) and biochemical variables as median (1st quartile – 3rd quartile) (using Mann-Whitney’s test). Statistical significance: p < 0.05.
Figure 1 – Distribution of the number of risk alleles by cases and controls. A logistic regression model was used to determine the coronary artery disease risk by the number of risk alleles compared to the number of reference alleles (23 alleles, in relation to the median value of the controls). Dots: regression analysis odds ratio for coronary artery disease.
0.10 0.08 0.06 0.04 0.02 0.00 Density
Distribution of the number of risk alleles
< = 15 16 17 18 19 20 21 22 23 24 25 26 27 28 29 30 31 32 > = 33 < = 15 16 17 18 19 20 21 22 23 24 25 26 27 28 29 30 31 32 > = 33 OR Cases Controls 12% 10% 8% 6% 4% 2% 0% 2.5 1.5 0.5 2.0 1.0 Individuals
Number of risk alleles
Table 2 – Distribution of multiplicative genetic risk score (MGRS) for cases and controls by quartiles and gender
Variables Cases (n = 1566) Controls (n = 1322) p value
MGRS 0.67 ± 0.73 0.48 ± 0.53 < 0.0001 1st Quartile 0.18 ± 0.05 0.17 ± 0.05 < 0.0001 2nd Quartile 0.33 ± 0.05 0.33 ± 0.05 3th Quartile 0.52 ± 0.07 0.52 ± 0.07 4 th Quartile 1.35 ± 1.02 1.18 ± 0.88 MGRS male 0.67 ± 0.77 0.48 ± 0.44 < 0.0001 MGRS female 0.65 ± 0.58 0.51 ± 0.74 0.006
MGRS was expressed as mean ± standard deviation (SD) (using Student’s t-test). Statistical significance: p < 0.05.
Two ROC curves were plotted based on the TRFs without and with the GRS (Figure 3). The first ROC curve estimated an AUC of 0.72, which increased to 0.74 when the GRS was added, revealing a better fit of the model (p < 0.0001) (Figure 3).
The NRI and its p value were used to make conclusions about improvements in prediction performance gained by
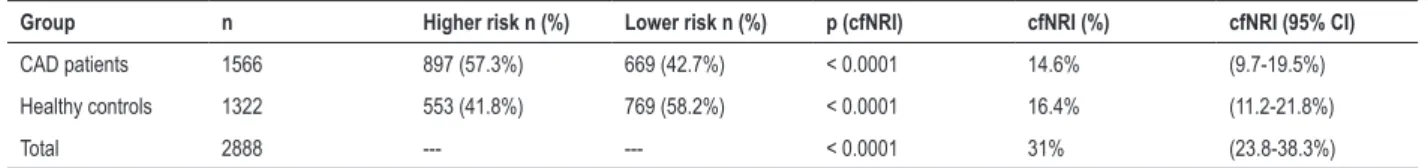
adding a set of biomarkers to an existing risk prediction model. The addition of GRS quartiles to TRF improved the risk classification of the models (Table 4). This new marker provided a continuous NRI of 31% (95% CI: 23.8-38.3%; p < 0.0001) with 14.6% reclassification of CAD patients and 16.4% of healthy control population (Table 4).
Figure 2 – Distribution of genetic risk score in deciles by cases and controls. A logistic regression model was used with the 5th decile of the controls as the reference class. GRS distributions in Deciles 16.0 14.0 12.0 10.0 8.0 6.0 4.0 2.0 0.0 Individuals (%) 3.0 2.5 2.0 1.5 1.0 0.5 0.0 OR Cases Controls OR 1º 2° 3° 4° 5° 6° 7° 8° 9° 10° 6.8 13.7 0.61 8.4 11.9 0.87 9.0 11.3 0.97 9.5 10.5 1.10 9.1 11.1 1 10.7 9.2 1.42 10.7 9.2 1.43 10.9 9.1 1.47 12.1 7.6 1.96 13.0 6.4 2.47
Table 3 – Multivariate analysis performed with the multiplicative genetic risk score (MGRS) (quartiles) and traditional risk factors
Variables OR* (95% CI) p value OR+ (95% CI) p value
MGRS (Quartiles) --- --- --- < 0.0001 2nd 1.355 (1.082 – 1.698) 0.008 1.406 (1.107 – 1.786) 0.005 3rd 1.934 (1.539 – 2.429) < 0.0001 2.006 (1.575 – 2.554) < 0.0001 4th 2.727 (2.162 – 3.439) < 0.0001 2.657 (2.083 – 3.389) < 0.0001 Smoking 3.440 (2.887 – 4.100) < 0.0001 3.651 (3.030 – 4.401) < 0.0001 Diabetes 3.138 (2.559 – 3.847) < 0.0001 3.436 (2.763 – 4.273) < 0.0001 Hypertension 2.067 (1.744 – 2.450) < 0.0001 2.187 (1.816 – 2.633) <0.0001 Dyslipidemia 1.298 (1.023 – 1.646) 0.032 1.344 (1.044 – 1.731) 0.022 Constant 0.186 < 0.0001
Using forward Wald method (SPSS vs. 19.0); Dyslipidemia. Controls: LDL > 140 mg/dL, HDL < 40 mg/dL for men and < 45 mg/dLfor women; triglycerides> 150 mg/dL, APO B > 100 mg/dL. Cases: LDL > 100 mg/dL; triglycerides > 150 mg/dL, HDL < 40 mg/dL for men and < 45 mg/dL for women; APO B > 100 mg/dL, non HDL > 130 mg/dL;
OR*: odds ratio adjusted for age and gender; OR+: odds ratio adjusted for gender, age, heart rate, pulse wave velocity, sedentary life style, alcohol, body mass index and family
history; CI: confidence interval; Statistically significant for p < 0.05.
NRI was also computed using categorical variables and applied to this case-control study and was defined as the percentage of subjects changing categories in each subgroup when adding the new marker (CAD quartile score). Movement towards a better category (higher in patients than in controls) was calculated to address a potential impact for clinical use. NRI showed higher improvement capacity in reclassifying 19.5% of patients from the 50-75% category to the highest risk (75-100%) category. Likewise, 14.1% of healthy controls were moved down into a lower risk category, from 25-50% risk category to < 25% one (Table 5).
Furthermore, the inclusion of GRS quartiles to TRF also provided an IDI of 2.5% (95%CI: 1.9-3.1%; p < 0.0001) (data not shown).
Discussion
Several years ago, polymorphisms involved in specific biological pathways, relevant to coronary atherosclerosis, were genotyped to determine their association with CAD. This candidate gene approach revealed about 30 high-confidence SNPs loci with significant effects on atherosclerosis.13 However, following traditional candidate
gene approach has generated many conflicting results or with weak associations; replication studies are necessary for consistent validation of these results.
In 2004, Mendonça et al. first genotyped angiotensin-converting enzyme (ACE) I/D polymorphisms in a Portuguese population yielding similar reports as described in literature.14
Figure 3 – ROC curves based on the baseline model (traditional risk factors, TRFs) and after adding the genetic risk score (GRS) (quartiles) in predicting the risk for coronary artery disease. The two curves are based on logistic regression models incorporating conventional risk factors (diabetes, dyslipidemia, smoking and hypertension) with and without the GRS. AUC indicates area under curve. The Delong test compares the difference between the two AUCs (p < 0.0001).
100 100 80 80 60 60 40 40 20 20 0 0 Sensitivity Delong test, p < 0.0001 AUC = 0.716 AUC = 0.738 TRF TRF+GRS (Quartiles) 100 – Specificity
Table 4 – The category-free net reclassification index (cfNRI) after addition of the GRS quartiles
Group n Higher risk n (%) Lower risk n (%) p (cfNRI) cfNRI (%) cfNRI (95% CI)
CAD patients 1566 897 (57.3%) 669 (42.7%) < 0.0001 14.6% (9.7-19.5%)
Healthy controls 1322 553 (41.8%) 769 (58.2%) < 0.0001 16.4% (11.2-21.8%)
Total 2888 --- --- < 0.0001 31% (23.8-38.3%)
GRS: genetic Risk Score; CAD: coronary Artery Disease; CI: confidence Interval; cfNRI: category-free net reclassification index. This analysis uses the function “improveProb” from R software package “Hmisc”.
After the development of high capacity arrays in 2008,15
GWAS examined millions of polymorphisms simultaneously in several ethnical subpopulations with a case-control design. The standardized minimum significance level set at 1x10⁻⁵ added reliability to cardiovascular genetics and
put it into perspective.16
In 2007, Samani et al.17 first identified chromosomal loci
that were strongly associated with CAD in the Wellcome Trust Case Control Consortium (WTCCC) study (which involved 1,926 case subjects with CAD and 2938 controls) and looked for replication in the German MI (Myocardial Infarction) Family Study.17
In the following years, a surprisingly large number of gene variants were consistently reported to be associated with CAD. The 9p21 variant was the most frequently gene variant reported across populations. The huge consortium of Wellcome Trust and three other European research groups joined for the CARDIOGRAM projectthat confirmed, in a
very large sample (> 22,000 cases) of individuals of European ancestry, a 29% increase in risk for MI per copy of the rs1333049 9p21 variant (p = 2×10-²0).18
Our research group replicated this 9p21 variant analysis in the Portuguese population and found a CC genotype prevalence of 35.7% in CAD patients, with an adjusted OR of 1.34, p = 0.010. The adjusted OR for TRF of CC genotype was 1.7 (p = 0.018) and CG genotype of OR = 1.5, p = 0.048. The authors concluded that although the mechanism underlying the risk is still unknown, the robustness of this risk allele in risk stratification for CAD has been consistent, even in very different populations. The presence of the CC or CG genotype may thus prove to be useful for predicting the risk of developing CAD in the Portuguese population.19
The most recent meta-analysis of GWAS for (CAD) identified 46 genome-wide loci with significant association and 104 genome-wide loci potentially associated with increased risk.20,21
Table 5 – Reclassification table comparing predicted coronary artery disease (CAD) risk with and without genetic risk score (GRS) quartiles Predicted risk (without GRS) Reclassified predicted risk (with GRS) % Increase %/ Decrease
CAD patients (n = 1,566) < 25% 25-50% 50-75% 75-100%
< 25% 6 11 0 0 0,7% 0%
25-50% 44 335 123 0 7,9% 2.8%
50-75% 0 59 471 305 19,5% 3.8%
75-100% 0 0 9 203 0% 0.6%
NRI CAD patients 20.9%
Healthy controls (n = 1,322) < 25% 65 36 0 0 2,7% 0% 25-50% 186 504 88 0 6,7% 14.1% 50-75% 0 60 268 79 6% 4.5% 75-100% 0 0 1 35 0% 0.1% NRI controls 3.3% NRI total 24.2%
NRI: net reclassification improvement (categorical NRI); CAD: coronary artery disease.
In our study, we found a gradual and continual increase in CAD risk with increasing number of CAD risk alleles carried. Individuals in the bottom decile are naturally protected and subjects in top decile of the GRS had a CAD risk of 2.472 (1.755 – 3.482). Even though the score distribution overlaps between cases and controls, the GRS is significantly associated with CAD risk and can be used to identify subjects at highest risk in terms of lifestyle or therapeutic interventions.
Our results are similar to others reports in Caucasians populations where GRS with 13, 29 or 109 SNPs22-24 were
independent and marginally increased the predictive power of TRF conferred either by AUC increases, C-index changes or more modern discriminative statistical methods like reclassification measures or improved discrimination.
We report a higher OR for the 4th quartile of GRS (2.59)
compared to 1.66 reported by Ripatti et al. in the highest quintile.22 When comparing the relative weight of the GRS in
the multivariate logistic analysis we found slightly lower OR than smoking, hypertension, and dyslipidemia. In Ripatti´s22
cohort, a weighted GRS was also an independent predictor even after adjusting for age, sex and TRFs in a Northern European population-based trial. The relative risk of the GRS based on 13-SNP was also lower than that of dyslipidemia and comparable to the effects of hypertension.22
An increased power to TRFs definition has been given in this study. For instance, we have used a broad dyslipidemia term including Apo B levels as indicated by 2016 lipid guidelines.7
Moreover, we have not considered ex-smokers until 5 years of cessation to account for the risk for CV disease events decrease be comparable to a nonsmoker.5
Thanassoulis et al.24 demonstrated that adding to a 13
SNP-based GRS, 89 SNPs associated with modifiable risk factors did not increase the power of the GRS reporting a HR of 1.01 (95% CI 0.99 –1.03; p = 0.48). This revealed that the weak association of polymorphisms with CAD risk
factors in GRS analysis could be masked by the relative stronger effect of other polymorphisms. Considering the lack of a significant association of lipid profiles with CAD risk, Jansen et al. reported in 2015 that several SNPs associated with type 2 diabetes mellitus were related with CAD risk.25
Recently, Webb et al. identified 6 new loci associated with CAD at genome-wide significance. The study confirmed a pleiotropy between lipid traits, blood pressure phenotypes, body mass index, diabetes, and smoking behavior.26 Our GRS
is an assembly of risk factors and non-risk factors-related SNP, reinforcing the genotype-phenotype interactions.
Limitations of this study
The main clinical utility of the GRS in our population is a modest improvement in risk stratification. GRS seems to be a better indicator of patients at a higher than average risk for DAC as compared with TRF stratification. The number and type of SNPs included is limited in our study and a larger number of GWAS hit SNPs should be included in further studies. Nevertheless, the increasing capability of analyzing multiple SNPs in GRS so far have not been translated into increasing ability of risk prediction.
Finally, this study did not include a gene-gene (G-G) and gene-environment (G-E) analysis. It is expected that, as better statistical significance arises from those interplays, the G-G and G-E incorporation in GRS plus TRF will increase our ability to accurately and individually predict risk.
Conclusions
We conclude that a multilocus GRS based on multiple variants of genetic risk was associated to an increased cardiovascular risk in a Portuguese population. We found that a GRS calculated with the 31 studied SNPs was significantly associated to CAD and that 25% of individuals who carry the greatest risk alleles have, approximately,
1. Lawrence C, Boerwinkle E. Gene-environment interactions and gene therapy in atherosclerosis. Cardiol Rev. 1994;2:130-7.
2. Wellcome Trust Case Control Consortium. Genome-wide association study of 14,000 cases of seven common diseases and 3,000 shared controls.
Nature. 2007;447(7145):661-78.
3. Myocardial infarction redefined. A consensus document of the Joint European Society of Cardiology/American College of Cardiology Committee for the redefinition of myocardial infarction. Eur Heart J. 2000;21(18):1502-13. 4. Abdi H, Williams LJ. Principal component analysis. WIREs Computacional
Statistics. 2010;2:433-59.
5. Mons U, Müezzinler A, Gellert C, Schöttker B, Abnet CC, Bobak M, et al; CHANCES Consortium. Impact of smoking and smoking cessation on cardiovascular events and mortality among older adults: meta-analysis of individual participant data from prospective cohort studies of the CHANCES consortium. BMJ. 2015;350:h1551.
6. Chobanian AV, Bakris GL, Black HR, Cushman WC, Green LA, Izzo JL Jr, et al; National Heart, Lung, and Blood Institute Joint National Committee on Prevention, Detection, Evaluation, and Treatment of High Blood Pressure; National High Blood Pressure Education Program Coordinating Committee. The Seventh Report of the Joint National Committee on Prevention, Detection, Evaluation and Treatment of High Blood Pressure: the JNC 7 report. JAMA. 2003;289(19):2560-72. Erratum in: JAMA. 2003;290(2):197. 7. Expert Panel on Detection Evaluation and Treatment of High Blood
Cholesterol in Adults. Executive Summary of the Third Report of the National Cholesterol Education Program (NCEPT) Expert Panel on Detection Evaluation and Treatment of High Blood Cholesterol in Adults (Adult Treatment Panel III). JAMA. 2001;285(19):2486-97.
8. Genuth S, Alberti KG, Bennett P, Buse J, Defronzo R, Kahn R, et al; Expert Committee on the Diagnosis and Classification of Diabetes Mellitus. Follow-up report on the diagnosis of diabetes mellitus. Diabetes Care. 2003;26(11):3160-7. 9. National Institute of Health, National Heart, Lung, and Blood Institute North
American Association for the Study of Obesity. The Practical Guide: Identification, Evaluation, and Treatment of Overweight and Obesity in Adults. NHLBI Obesity Education Initiative. Bethesda (MD); 2000. NIH Publication Number: 00-4084.
10. Asmar R, Benetos A, Topouchian J, Laurent P, Pannier B, Brisac AM, et al. Assessment of arterial distensibility by automatic pulse wave velocity measurement: validation and clinical application studies. Hypertension. 1995;26(3):485-90.
11. DeLong ER, DeLong DM, Clarke-Pearson DL. Comparing the areas under two or more correlated receiver operating characteristic curves: a nonparametric approach. Biometrics. 1988;44(3):837-45.
12. Pencina MJ, D’Agostino RB Sr, Steyerberg EW. Extensions of net reclassification improvement calculations to measure usefulness of new biomarkers. Stat Med. 2011;30(1):11-21.
13. Humphries SE, Morgan L. Genetic risk factors for stroke and carotid atherosclerosis: insights into pathophysiology from candidate gene approaches. Lancet Neurol. 2004;3(4):227-35.
14. Mendonça I, Freitas AI, Sousa AC, Gomes S, Faria P, Drumond A, et al. Polymorphism of the ACE gene is associated with extent and severity of coronary disease. Rev Port Cardiol 2004;23(12):1605-11.
15. Keating BJ, Tischfield S, Murray SS, Bhangale T, Price TS, Glessner JT, et al. Concept, design and implementation of a cardiovascular gene-centric 50 k SNP array for large-scale genomic association studies. PLoS One. 2008;3(10):e3583. 16. McCarthy MI, Abecasis GR, Cardon LR, Goldstein DB, Little J, Ioannidis JP, et al. Genome-wide association studies for complex traits: consensus, uncertainty and challenges. Nat Rev Genet. 2008;9(5):356-69. 17. Samani NJ, Erdmann J, Hall AS, Hengstenberg C, Mangino M, Mayer B, et
al; WTCCC and the Cardiogenics Consortium. Genomewide association analysis of coronary artery disease. N Engl J Med 2007;357(5):443-53. 18. Preuss M, König IR, Thompson JR, Erdman J, Absher D, Assimes TL, et
al; CARDIoGRAM Consortium. Design of the Coronary ARtery DIsease Genome-Wide Replication And Meta-Analysis (CARDIoGRAM) Study: A Genome-wide association meta-analysis involving more than 22 000 cases and 60 000 controls. Circ Cardiovasc Genet. 2010;3(5):475-83. 19. Mendonça I, dos Reis RP, Pereira A, Café H, Serrão M, Sousa AC, et al. Associação
independente da variante rs1333049, no locus 9p21, com a doença coronária, numa população portuguesa. Rev Port Cardiol. 2011;30(6):575-91.
References
2.5 times increased CAD risk when compared to those in the lowest quartile. This GRS has provided a slight improvement of the predictive ability compared to the initial model and can enhance individual risk stratification. These results highlight the potential value of including genetic information in the usual models.
Acknowledgments
We are very grateful to Elsa Sousa who made all the administrative procedures and to Rita Freitas (CIDEHUS, Évora University, Portugal) who reviewed the paper for statistical analysis.
Author contributions
Conception and design of the research and Writing of the manuscript: Pereira A; Acquisition of data: Pereira A, Freitas AI, Sousa AC, Brehm A; Analysis and interpretation of the data and Statistical analysis: Pereira A, Freitas S, Henriques E, Rodrigues M; Critical revision of the manuscript for intellectual content: Pereira A, Mendonça MI, Borges S, Brehm A, Reis RP.
Potential Conflict of Interest
No potential conflict of interest relevant to this article was reported.
Sources of Funding
There were no external funding sources for this study. Study Association
This article is part of the thesis of Doctoral submitted byAndreia Pereira, from Universidade Nova de Lisboa.
Ethics approval and consent to participate
This study was approved by the Ethics Committee of the SESARAM, EPE under the protocol number 50/2012. All the procedures in this study were in accordance with the 1975 Helsinki Declaration, updated in 2013. Informed consent was obtained from all participants included in the study.
This is an open-access article distributed under the terms of the Creative Commons Attribution License
20. Deloukas P, Kanoni S, Willenborg C, Farrall M, Assimes TL, Thompson JR, et al; CARDIoGRAMplusC4D Consortium. Large-scale association analysis identifies new risk loci for coronary artery disease. Nat Genet. 2013;45(1):25-33. 21. Roberts R. Genetics of coronary artery disease. Circ Res. 2014;114(12):1890-903. 22. Ripatti S, Tikkanen E, Orho-Melander M, Havulinna AS, Silander K, Sharma
A, et al. A multilocus genetic risk score for coronary heart disease: case-control and prospective cohort analyses. Lancet. 2010;376(9750):1393-400. 23. Vaarhorst AA, Lu Y, Heijmans BT, Dollé ME, Böhringer S, Putter H, et
al. Literature-based genetic risk scores for coronary heart disease: the Cardiovascular Registry Maastricht (CAREMA) prospective cohort study. Circ Cardiovasc Genet. 2012;5(2):202-9.
24. Thanassoulis G, Peloso GM, Pencina MJ, Hoffman U, Fox CS, Cupples LA. A genetic risk score is associated with incident cardiovascular disease and coronary artery calcium: the Framingham Heart Study. Circ Cardiovasc Genet. 2012;5(1):113-21.
25. Jansen H, Loley C, Lieb W, Pencina MJ, Nelson CP, Kathiresan S, et al; CARDIoGRAM consortium. Genetic variants primarily associated with type 2 diabetes are related to coronary artery disease risk. Atherosclerosis. 2015;241(2):419-26.
26. Webb TR, Erdmann J, Stirrups KE, Stitziel NO, Masca NG, Jansen H, et al. Systematic evaluation of pleiotropy identifies 6 further loci associated with coronary artery disease. J Am Coll Cardiol. 2017;69(7):823-36.
Supplementary Table 1 – List of the 33 genetic variants previously associated with coronary artery disease risk, used for the development of the genetic risk score in the study population
SNP ID Nearest gene Chr Position Genotypic OR (95%CI) p value Allelic OR (95%CI) p value MAF (%) Potential Mechanismof Action
rs1333049 9p21.3 9 22125504 1.147 (1.036-1.270)+ 0.008 1.155 (1.041-1.282) 0.007 45.8 Cellular rs4977574 CDKN2B 9 22098575 1.161 (1.049-1.286)+ 0.004 1.172 (1.056-1.302) 0.003 42.0 Cellular rs618675 GJA4 1 34922761 1.143 (0.792-1.649)* 0.475 1.046 (0.918-1.191) 0.502 19.6 Cellular rs17228212 SMAD3 15 65245693 1.202 (0.888-1.629)* 0.234 1.025 (0.910-1.155) 0.684 25.3 Cellular rs17465637 MIA3 1 222650187 1.088 (0.971-1.220)+ 0.148 1.088 (0.971-1.220) 0.147 28.6 Cellular rs12190287 TCF21 6 134256218 1.230 (1.100-1.375)+ < 0.0001 1.226 (1.098-1.368) 0.0003 32.7 Cellular rs3825807 ADAMTS7 15 76876166 1.073- (0.967-1.191)+ 0.185 1.074 (0.967-1.194) 0.181 41.2 Cellular rs11556924 ZC3HC1 7 130023656 1.227 (1.058-1.423)* 0.007 1.157 (1.037-1.290) 0.009 34.3 Cellular rs1332844 PHACTR1 6 12927312 1.113 (1.003-1.235)+ 0.044 1.113 (1.003-1.236) 0.043 44.3 Cellular rs2114580 PCSK9 1 55167236 1.079 (0.821-1.417)* 0.587 0.974 (0.866-1.096) 0.665 26.3 Lipids rs3798220 LPA 6 160540105 1.484 (1.212-1.816)+ < 0.0001 2.167 (1.452-3.235) < 0.0001 2.1 Lipids rs20455 KIF6 6 39357302 1.129 (0.896-1.424)* 0.306 1.060 (0.949-1.184) 0.302 32.8 Lipids rs7412/ rs4293581 APOE1 19 44908822/44908684 1.261 (1.062-1.497)# 0.008 1.231 (1.056-1.435) 0.008 13.4 Lipids rs964184 ZNF259 11 116778201 1.131 (0.986-1.298)+ 0.078 1.130 (0.986-1.295) 0.079 17.7 Lipids rs599839 PSRC1 1 109279544 1.059 (0.933-1.203)+ 0.375 1.058 (0.933-1.201) 0.379 21.4 Lipids rs1801133 MTHFR 677 1 11796321 1.178 (1.017-1.365)# 0.029 1.114 (0.998-1.243) 0.055 33.5 Oxidation rs1801131 MTHFR 1298 1 11794419 0.944 (0.816-1.093)# 0.443 0.958 (0.854-1.075) 0.465 28.0 Oxidation rs705379 PON -108 7 96324583 1.135 (0.950-1.355)# 0.163 1.068 (0.962-1.184) 0.217 46.4 Oxidation rs662 PON 192 7 95308134 0.836 (0.652-1.072)* 0.157 0.927 (0.828-1.037) 0.186 30.1 Oxidation rs854560 PON 55 7 95316772 1.161 (1.044-1.290)+ 0.006 1.161 (1.044-1.290) 0.006 40.4 Oxidation rs6922269 MTHFD1L 6 150931849 1.067 (0.804-1.416)* 0.653 0.996 (0.887-1.118) 0.943 27.3 Oxidation rs5186 AT1R 3 148742201 1.245 (0.906-1.710)* 0.177 1.062 (0.942-1.198) 0.323 24.7 RAS rs699 AGT 1 230710048 0.932 (0.798-1.090)# 0.380 0.969 (0.873-1.076) 0.552 42.9 RAS rs4340 ACE 17 61565892 1.165 (1.001-1.355)* 0.048 1.083 (0.973-1.205) 0.143 38.1 RAS rs4402960 IGF2BP2 3 185793899 1.124 (0.876-1.443)* 0.358 1.020 (0.911-1.141) 0.736 30.8 Diab/Obes rs1326634 SLC30A8 8 117172544 1.213 (0.914-1.609)# 0.181 1.081 (0.961-1.217) 0.195 25.8 Diab/Obes rs266729 ADIPOQ 3 186841685 1.209 (1.041-1.403)# 0.013 1.165 (1.030-1.318) 0.015 23.3 Diab/Obes rs7903146 TCF7L2 10 112998590 0.961 (0.862-1.072)+ 0.480 0.962 (0.863-1.072) 0.482 35.3 Diab/Obes rs17782313 MC4R 18 60183864 1.314 (0.931-1.855)* 0.120 1.016 (0.896-1.152) 0.806 21.6 Diab/Obes rs1801282 PPARG 3 12351626 1.427 (0.717-2.843)# 0.309 1.164 (0.970-1.396) 0.102 8.8 Diab/Obes rs1884613 HNF4A 20 44351775 1.159 (0.987-1.360)# 0.072 1.106 (0.960-1.273) 0.163 16.2 Diab/Obes rs8050136 FTO 16 53782363 1.194 (1.026-1.390)# 0.022 1.129 (1.016-1.255) 0.025 39.7 Diab/Obes rs1376251 TAS2R 50 12 11030119 1.556 (0.767-3.155)* 0.217 1.080 (0.920-1.267) 0.349 11.9 Diab/Obes
SNP: Single Nucleotide Polymorphism; Chr: Chromosome; OR: Odds Ratio; CI: Confidence Interval; MAF: Minor Allele Frequency; RAS: Renin-Angiotensin System;
Diab/Obes: Diabetes/Obesity; +Additive model;*Recessive model; #Dominant model; 1Resulting from a Haplotype; Table shows susceptibility loci for coronary artery
disease, genotypic and allelic ORs and p values for the lead SNP within each locus reported in genome-wide association studies and candidate gene studies. Genotypic ORs are given for additive, recessive and dominant models. Potential mechanism of action is on the basis of what is already known about the function of the nearby genes. It includes “Cellular” (genes associated to cell cycle, cellular migration and inflammation); “Oxidation” (genes involved in pro-oxidative status) and associated with modifiable risk factors such as “Lipids” metabolism, hypertension (“RAS”) and Diabetes/Obesity.
Supplementary Table 2 – Logistic regression with respective ORs and ROC curves with respective AUCs of the GRS models
GRS models OR (95% CI) P value1 AUC (95% CI) Sensitivity (%) Specificity (%) P value2
Multiplicative 1.78 (1.52 – 2.10) < 0.0001 0.61 (0.59 – 0.62) 54.0 62.3 < 0.0001
Additive 1.06 (1.04 – 1.09) < 0.0001 0.56 (0.54 – 0.58) 58.7 50.5 < 0.0001
Weighted (Best model OR) 1.02 (0.94 – 1.10) 0.660 0.57 (0.55 – 0.59) 41.0 70.3 < 0.0001
Weighted (Beta) 2.23 (1.88 – 2.65) < 0.0001 0.60 (0.58 – 0.61) 43.0 71.5 < 0.0001
Weighted (Literature OR) 1.35 (1.12 – 1.62) 0.001 0.54 (0.52 – 0.55) 53.4 54.1 0.008
Classic weighted 3.01 (2.32 – 3.89) < 0.0001 0.59 (0.57 – 0.61) 59.4 54.4 < 0.0001
OR: Odds ratio; ROC: Receiver Operating Characteristic; AUC: Area under curve; GRS: Genetic Risk Score; CI: Confidence interval; P value1: Obtained by logistic
regression to evaluate the significance of the odds ratio; P value2: Obtained by the ROC Curve to verify the significance of the area under the curve; Statistically