UNIVERSIDADE DE LISBOA
FACULDADE DE CIÊNCIAS
DEPARTAMENTO DE ENGENHARIA GEOGRÁFICA, GEOFÍSICA E ENERGIA
Building Performance Evaluation: A Dutch Perspective in
Thermal Comfort and Energy Consumption
Mestrado Integrado em Engenharia da Energia e do Ambiente
André Fonseca Jorge Cardoso Leitão
Dissertação orientada por:
Prof. Dr. Guilherme Carrilho da Graça
Abstract
Published works have shown that buildings often consume more energy, than is necessary for occupant comfort. The building sector is accountable for 40% of EU’s final energy use and responsible for 36% of EU’s CO2 emissions, directly related to energy consumption. Researchers
say that there is a huge potential for energy savings in this sector, because the available technology is currently highly cost-effective, which could help to mitigate global energy use by the building sector. This study focuses on building performance aspects of an office building at TU/e, such as energy consumption and thermal comfort. EnergyPlus is used as a simulation tool to investigate energy-efficient opportunities, during the later phases of design process, and to research innovative applications for design support. However, buildings do not always perform as well as predicted. This performance gap may result from a number of reasons, but the most representative causes are introduced by uncertainties within the model design. For this reason, in recent years, the calibration of building simulation models has been of growing interest, mostly due to the lack of a recognizable approach to take during the entire calibration process.
This paper presents a methodology to apply during model development and calibration optimization, for tuning a set of parameters, while highlighting the effects of uncertainty in the calibration process. The goal is to minimize the difference between predicted (simulated) energy performance and actual measured energy use. To assess the accuracy of the model, two statistical indices are calculated: the Mean Bias Error (MBE) and the Coefficient of Variation of the Root Mean Square Error (CV(RMSE)), which were found to be consistent with ASHRAE guideline 14 limits.
After the model has been successfully calibrated and validated, other analyses may proceed. In this research, besides the building’s energy consumption assessment, the thermal comfort of the occupants is also evaluated in relation to Dutch guidelines, which are based on the ATG-method. The analysis conducted confirmed a “good” level of thermal comfort in the test case building, with less than 10% of its users experiencing discomfort.
Keywords: Building performance, simulation model, EnergyPlus, Performance gap, Calibration, Uncertainty, Thermal comfort.
Resumo
Trabalhos publicados mostraram que os edifícios normalmente consomem mais energia do que o necessário para o conforto dos ocupantes. O setor dos edifícios é responsável por 40% do consumo de energia final na EU e responsável por 36% das emissões de CO2, diretamente
relacionadas com o consumo de energia. Investigadores dizem que existe um enorme potencial de poupança de energia neste setor, pois a tecnologia atualmente disponível é altamente económica, o que poderá ajudar a mitigar o uso global de energia pelo setor de edifícios. Este estudo centra-se em aspectos relacionados com o desempenho energético de um edifício de escritórios na TU/e, tais como o consumo de energia e o conforto térmico. O EnergyPlus é usado como ferramenta de simulação para investigar oportunidades energeticamente eficientes, após a período de ocupação de um edifício. No entanto, os edifícios nem sempre se comportam energeticamente tão bem quanto o previsto. Esta discrepância no desempenho pode ter uma série de razões, mas as causas mais representativas são introduzidas por incertezas referentes ao design do modelo de simulação. Por esse motivo, durante os últimos anos, a calibração dos modelos de simulação tem sido de crescente interesse, principalmente devido à falta de uma abordagem reconhecida a ser tomada durante o processo de calibração.
Este trabalho apresenta uma metodologia a aplicar durante as técnicas de desenvolvimento e calibração do modelo de simulação, ajustando um conjunto de parâmetros, enquanto destaca os efeitos das incertezas no processo de calibração. O objetivo é minimizar a diferença entre o consumo de energia previsto (simulado) e consumo de energia medido. Para avaliar a precisão do modelo, dois indicadores estatísticos são calculados: o erro quadrático médio (MBE) e o coeficiente da raiz de variação do erro quadrático médio(CV(RMSE)), que foram considerados consistentes com os limites impostos pela norma 14 do ASHRAE.
Após o modelo ser calibrado e validado com sucesso, outras análises poderão ser conduzidas. Neste estudo é também avaliado, além dos consumos energéticos, o conforto térmico dos ocupantes do edifício em relação à legislação holandesa, que se baseia no método ATG. A análise realizada confirmou um "bom" nível de conforto térmico no edifício em estudo, com menos de 10% de seus ocupantes a sentirem desconforto.
Palavras-chave: Desempenho energético, Modelo de simulação, EnergyPlus, Discrepância no desempenho, Calibração, Incertezas, Conforto térmico.
Building Performance Evaluation: A Dutch Perspective in Thermal Comfort and Energy Consumption
Index
Chapter 1 - Introduction ... 1
1.1. Problem Definition ... 3
1.2. Thesis outline ... 4
Chapter 2 - Building Performance Evaluation (BPE) ... 5
2.1. Role of BPE ... 5
2.2. Building Benchmarking ... 7
Chapter 3 - Building Performance Simulation (BPS) ... 9
3.1. Energy Balance in Buildings ... 9
3.2. Dynamic Simulation in Buildings ... 11
3.2.1. EnergyPlus Simulation Tool ... 12
Chapter 4 - Verification and Validation of Simulation Model ... 15
4.1. Validation ... 15
4.2. Model Calibration ... 16
4.3. Uncertainty and Sensitivity Analysis ... 20
Chapter 5 - Dutch Building Decree ... 23
5.1. Building Thermal Code ... 23
5.2. Thermal Comfort Guideline for the Netherlands ... 26
Chapter 6 - Case Study ... 31
6.1. Data collection ... 31
6.2. Building description ... 31
6.3. Building Systems ... 33
Chapter 7 - Methodology ... 35
7.1. Simulation Modelling Approach ... 37
7.1.1. Thermal Zones... 38
7.1.2. Building Site ... 39
7.1.3. Building Envelope ... 41
7.1.4. Building Internal Gains ... 43
7.1.5. HVAC System and Infiltration ... 45
7.2. Calibration Approach ... 46
7.2.1. Pre-processing – Metered data ... 47
7.2.2. Pre-processing – Weather file ... 49
Chapter 8 - Results and Discussion ... 51
8.1. Uncalibrated BPS model ... 51
8.2. Calibrated BPS model ... 54
8.3. Thermal Comfort ... 58
Chapter 9 - Conclusions and Future Work ... 61
Chapter 10 - References ... 63
Chapter 11 - Annexes ... 69
11.1. Annex A – Building Legislation for Ventilation ... 69
11.2. Annex B – Vertigo Blueprints ... 71
11.3. Annex C – Heat Pump Supply Water Temperature ... 73
Building Performance Evaluation: A Dutch Perspective in Thermal Comfort and Energy Consumption
Figures Index
Figure 1.1: EU final energy consumption by sector and buildings energy mix in 2015. Adapted from:
[1]. ... 1
Figure 2.1: Diagram representing the four different stages during a BPE. Adapted from [14]. ... 6
Figure 3.1: Flows of energy in a thermal zone. Source: [20] ... 10
Figure 3.2: Interface example of Google SketchUp with Openstudio plug-in. ... 12
Figure 4.1: Methodology to calibrate a simulation model. Source: [30] ... 19
Figure 5.1: Adaptive Temperature Limits (ATG) chart. Source: [49]. ... 29
Figure 5.2: Example of simulation results for a type α building. Source: [49]. ... 29
Figure 6.1: a) ATES system in Tu/e campus; b) ATES warm and cold clusters in Tu/e. Source: [52] ... 32
Figure 6.2: Picture of the Vertigo building at TU/e. ... 32
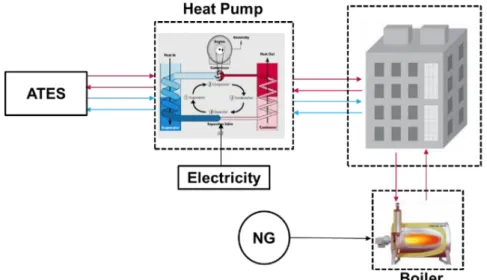
Figure 6.3: Vertigo’s mechanical system overview ... 33
Figure 6.4: Diagram describing the heating and cooling mode of a reversible heat pump. ... 34
Figure 7.1: Overview of methodology process ... 36
Figure 7.2: Vertigo Floorplan. ... 37
Figure 7.3: Vertigo blueprints from 6th to 9th floor with thermal zoning illustration. ... 38
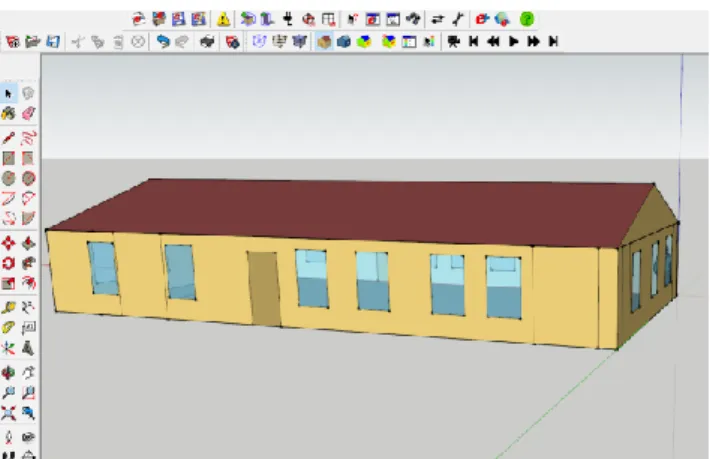
Figure 7.4: Left) North and West side display of the 3D model in Google SketchUp; Right) East and South side display of the 3D model in Google SketchUp. ... 39
Figure 7.5: Building demonstration on Google Sketch up of slab and basement constructions. ... 40
Figure 7.6: a) Slab in-grade configuration; b) Basement configuration. Source: [71] ... 41
Figure 8.1: Vertigo uncalibrated BPS model hourly heating consumption comparison. ... 51
Figure 8.2: Vertigo uncalibrated BPS model monthly heating consumption comparison. ... 52
Figure 8.3: Vertigo uncalibrated BPS model hourly cooling consumption comparison. ... 52
Figure 8.4: Vertigo uncalibrated BPS model monthly cooling consumption comparison. ... 52
Figure 8.5: Uncalibrated model heating calibration signature. ... 53
Figure 8.6: Uncalibrated model cooling calibration signature. ... 53
Figure 8.7: Vertigo calibrated BPS model hourly heating consumption comparison. ... 55
Figure 8.8: Vertigo calibrated BPS model monthly heating consumption comparison. ... 55
Figure 8.9: Vertigo calibrated BPS model hourly cooling consumption comparison. ... 56
Figure 8.10: Vertigo calibrated BPS model monthly cooling consumption comparison. ... 56
Figure 8.11: Final calibrated BPS model heating calibration signature. ... 57
Figure 8.12: Final calibrated BPS model cooling calibration signature. ... 57
Figure 8.13: Vertigo 5th floor open space occupants thermal comfort perception using the ATG method. ... 59
Figure 8.14: Vertigo occupants thermal comfort perception using the ATG method. ... 60
Figure 11.1: Floorplan of -1st floor of the Vertigo. ... 71
Figure 11.2: Floorplan of -2nd floor of the Vertigo. ... 71
Figure 11.3: Floorplan of 0th floor North side of the Vertigo. ... 71
Figure 11.4: Floorplan of 0th floor South side of the Vertigo. ... 71
Figure 11.5: Floorplan of 1st floor North side of the Vertigo. ... 71
Figure 11.6: Floorplan of 1st floor South side of the Vertigo. ... 71
Figure 11.7: Floorplan of 2nd floor North side of the Vertigo. ... 72
Figure 11.10: Floorplan of 5th floor side of the Vertigo. ... 72
Figure 11.11: Floorplan of 6th – 9th floor of the Vertigo. ... 72
Figure 11.12: Vertigo glass façade. ... 73
Figure 11.13: Vertigo layout. ... 73
Figure 11.14: Changes in hot water supply temperature depending on the outdoor temperature .... 73
Building Performance Evaluation: A Dutch Perspective in Thermal Comfort and Energy Consumption
Table Index
Table 1.1: Building performance main influential factors. Source: [9] ... 2
Table 4.1: Acceptance criteria for calibrating BPS models. ... 18
Table 5.1: Energy performance coefficients (EPC) requirements by type of building. Source: [36] ... 24
Table 5.2: Installed power for lighting systems. Source: [37] ... 25
Table 5.3: Values for standard clothing. Source [40] ... 25
Table 5.4: Adopted activities and respective MET Values. Source: [37], [38] ... 25
Table 5.5: Recommended values for power equipment in office and homes. Source: [37] ... 25
Table 5.6: Description of the four classification levels. Adapted from: [47] ... 28
Table 7.1: Main characteristics of the building envelope ... 41
Table 7.2: Constructive characteristics of the Vertigo building ... 42
Table 7.3: Fenestration description ... 42
Table 7.4: Internal gains assumed in BPS model ... 44
Table 7.5: Parameters used in calculation of heating and cooling thermal energy load. ... 48
Table 7.6: Source of uncertainty in building energy models. Source: [90] ... 50
Table 7.7: Input parameters changed during simulation optimization. ... 50
Table 8.1: Statistics of the BPS model before the calibration approach. ... 54
Table 8.2: Optimized values during calibration of the BPS model. ... 55
Table 8.3: Statistics of the BPS model obtained from the final calibrated simulation. ... 57
Table 11.1: Minimum people for each building function and respective ventilation rate according to Building Decree 2012. Source: [36] ... 70
Introduction
Chapter 1 - Introduction
Buildings are one of the major consumers of energy among the entire sectors of the economy. In 2015, the building sector accounted for almost 40% of final energy consumption and 36% of CO2
emissions in Europe [1], figure 1.1. Moreover, this energy was provided mostly from electrical and fossil fuel sources. To address this issue, many countries have implemented building energy regulations to establish a method of assessing, rating and certifying the sustainability of buildings. Despite significant policy efforts to improve energy efficiency, buildings energy use has risen by 20% compared to 2000 values [2]. In addition, about 35% of the EU’s buildings are over 50 years old [3]. Consequently, there is an elevated potential for cost-effective energy savings of up to 50-90% [4], hence the building sector has become a priority for the European Union trying to meet its ambitious climate and energy targets for 2020 and 2050.
The 2012 EPBD’s (Energy Performance Building Directive) furthered the importance of ensuring that building construction continually improves its energy performance. It established goals to cut energy use by 20% [5], by introducing new minimum energy performance requirements for buildings, building elements or systems. Also gave recommendations and strategies to promote the transition towards nearly Zero-Energy Buildings (nZEBs).
Figure 1.1: EU final energy consumption by sector and buildings energy mix in 2015. Adapted from: [1].
EU’s targets confront the building industry with new challenges, leading to the need for the engineers and academics to consider in more detail the main driving factors for energy demand, while searching for solutions and new building concepts that contribute to achieve these objectives. For instance, the increasing awareness on thermal indoor climate and air quality has proven that a well-designed indoor thermal environment helps to maximize the building occupants’ productivity [6].
Focusing on the EU’s services sector, approximately 60% of the annual energy demand in commercial buildings has heating and cooling as the main final energy end-use [7], [8]. Moreover, occupant expectation for new levels of comfort associated with the building sector leads, ultimately, to an increase in energy use. In the end, it is relevant the study of measures that promote the reduction of consumption, by raising the levels of energy efficiency. Building
Services Renewables Commercial Heat Electricity Natural Gas Oil Coal Residential 25% Services 14% Industry 25% Transport 33% Other Sectors 3% Residential 0,72% 10,38% 30,33% 48,85% 6,17% 3,55% 3,36% 12,63% 35,41% 24,86% 7,72% 16,02%
Performance Evaluation (BPE) is an innovative approach to systematically assess quantitively and qualitatively the sustainability of a building, considering its impact on the environment and users during all phases of the life-cycle. By using such a process, decision-makers can make better and more informed user-oriented design decisions.
BPE is a mechanism generally applied in later stages of design, often to address two topics. First, an analysis is carried as a method to fully recognize a building energy flows based on real operating conditions and compared against expected design criteria. In other words, through a detailed evaluation of energy, water and indoor air quality an assessment can be made relative to the building’s performance. Secondly, a number of energy conservation measures are selected using the knowledge obtained from the building behaviour and the interactions between weather conditions, user occupancy and operating systems. Then, the savings potential of the most cost-effective improvements are estimated according to occupant concerns and needs.
In this context, computer-based simulation models appeared as a tool to effortlessly predict a building behaviour, given system properties and conditions. Buildings energy models use heat and mass detailed calculations to determine the response of a complex interdependent system under specific external conditions. Building Performance Simulation (BPS) emerged has a design support tool for its proven capabilities to accurately estimate annual energy consumption and thermal comfort in buildings, as well as an instrument that can be used to predict cost-saving renovations.
Table 1.1 lists the main influencing factors on the total building energy use. A detailed comparative analysis on building energy data, concerning those parameters provides an essential guidance to identify opportunities to save energy and reduce greenhouse gases.
Table 1.1: Building performance main influential factors. Source: [9]
Building Performance
User behaviour
- Indoor quality provided; - Occupant activities; - Behaviour patterns.
Physical properties
- Envelope & Services; - Operation & Maintenance; - Energy systems.
External conditions - Climate.
However, an analysis and evaluation method suffers from two sources of modelling inefficiencies: lack of information on the exact properties of the building and simplifications/assumptions introduced in the development of the model. Thus, one cannot completely predict actual energy consumption, since there is a risk in the assessment of model parameters, which cause uncertainties pertaining to building demand. Despite, nearly 40 years of research and development, methods for the design assessment are yet costly to implement, time-consuming or not applicable [10]. It is therefore necessary to constantly face this complexity and improve the ability to predict the impact of changes in the building model to make better decisions and provide optimal solutions with the help of BPS.
The scope of this work will be to support any building simulation based environment into applying a clear strategy, for design support during the later phases of the design process, for the study of an office building’s energy use and thermal comfort. Furthermore, it has the goal to present an optimized-based approach to facilitate the improvement of the model accuracy, through easy and simple techniques, taking into account the influence of uncertainties within a model.
Introduction
1.1.Problem Definition
Building simulation offers a unique perspective to gauge and evaluate how energy is currently consumed. For this analysis, it is fundamental the collection of data pertaining to the building under study (energy consumption, usage profile, building systems, envelope characteristics, etc). Through the exercise of a variety of simulation techniques and procedures it is possible to predict real physical conditions in a building and perceive how energy performance can be promoted. BPS tools are based on dynamic models that use numerical methods to calculate an approximate solution of a realistic building. In order to have accurate results and make simulation predictions match closely with real demand, there are major challenges to overcome on dealing with difficulties related to large diversity of parameters and complexity of factors. The information needed to guide the decisions, while constructing the simulation model will require the exact specification of systems and the selection of all parameters relevant for the design. In spite of recent boom and mainstream application of BPS tools in post-construction stages, a significant discrepancy has been often found between the designed and real total energy use in buildings. This is often addressed as “the performance gap” [11].
Several studies [12]–[14] have highlighted and addressed the issue about the significant differences between predicted BPS models and the actual metered building energy use. Even, the most recognized BPS tools used currently, show some level of discrepancies. To illustrate this P. de Wilde [11] reports that the “ measured energy can be as much as 2.5 times the predicted energy use”. So, it is necessary that the simulation model closely represents the actual behaviour of the building, to the extent of not undermining the confidence in the simulation results. To properly reduce these disparities and increase reliability in BPS, the model must go through a process of calibration focused on the physical uncertainties of the model. This mechanism comprises essentially, technical and operational adjustments of the computer model to have a more realistic representation of the building performance. One reason for this discrepancy could be limited information on the building’s thermal envelope and installations. Hence, this problem of imprecision requires an evaluation of the effects of different input variables values in terms of the system response, towards finding the optimal estimate.
In the end, a simulation model is only valid if the model has gone through an accurate calibration, thus becoming an essential part of every building simulation to integrate the issues related to risk and uncertainty in design. However, a BPS calibration involves thousands of input parameters resulting in a wide range of multiple solutions that depend on the building under investigation. Therefore, resulting into the nonexistence of an uniformized methodology to properly calibrate a BPS model.
This thesis focuses on a simplified methodology for conducting a building performance evaluation of a building at TU/e (Vertigo). It uses the EnergyPlus simulation tool, emphasising on the current practices used in the Netherlands. The main goal is to present a simulation-based optimization approach for calibrating any dynamic energy model based on monitored data. It is proposed an easy and effective method to handle the different sources of model uncertainty, intrinsic to some degree to every simulation, by manual tuning the building input data to obtain the optimal solution with minimum computation time.
The case study presented is based on an office building with respect to various performance indicators. Even though, the aim is not to quantify the uncertainty in the model calculations, the
consumption predictions (annual heating and cooling). After a successful calibration and consequently validation, further analysis can pursue.
Finally, this thesis also has the objective to analyse the building occupants’ thermal comfort level based on the Dutch guidelines. Legislation requires the maintenance of conditions of thermal comfort in the workplace appropriate to the human body, taking into account the methods of work and the imposed physical constraints. The determination of the state of thermal environment and the measures to be taken may only be made by assessing the factors determining it, since thermal comfort may affect largely the occupant’s behaviour, which ultimately relates to energy consumption. Netherlands formulated a standard for the indoor climate conditions in office spaces (ISSO 74:2014) based upon the adaptive approach (ATG method), which can provide a method to support a clear and straightforward communication with customers and other stakeholders.
1.2.Thesis outline
This thesis is structured in nine chapters and four complementary annexes, where is included the introduction, which makes an initial approach to the topic being debated, pointing out the goals that are to be met throughout this work.
The second chapter gives an overview of the concepts related to an energy performance evaluation. Discusses the importance of assessing the energy demand in dwellings and commercial buildings. In addition, gives an insight to the current design guidelines and rating systems.
Chapter three describes the computer simulation tool used during the research study, EnergyPlus, for the evaluation of building energy consumption and occupants’ thermal behaviour. Brings out the relevance of employing a simulation tool in the energy assessment strategy.
Chapter four defines the necessary steps towards verifying and validating a simulation model. It is fundamental an understanding in design simulation tools and optimization techniques before developing the ideas of how to improve the current use of BPS.
In chapter five is accomplished a general framework of the present Dutch legislation, regarding the energy performance of building and occupants’ thermal comfort.
The chapter six presents the test case building and all its pertaining information gathered, relevant for the design of the simulation model. Explains in detail the building under analysis, as wells as, the data collected concerning the systems operation.
Chapter seven proposes a methodology to implement during a building performance evaluation. Additionally, a simulation-based optimization approach for calibrating building energy model, using monitored data is recommended. The applicability of the validation technique in current building performance simulation is shown.
Chapter eight presents the results of the simulation model compared with the metered data, before and after the calibration process, recognizing the benefits it brings to the accuracy of the designed model and enabling a precise assessment of the occupants’ thermal comfort.
Chapter nine summarizes and concludes this research; furthermore, it identifies directions for future research opportunities.
Building Performance Evaluation (BPE)
Chapter 2 - Building Performance Evaluation (BPE)
Building Performance Evaluation (BPE) is a tested and defined method that can be adopted to continuously measure and monitor building performance before, during and after building being commissioned. It is used to assess the building’s performance in terms of design goals or other specific performance criteria. This includes not only occupant satisfaction, but also resource consumption, both water and energy use. A building design process using feedback from ongoing evaluation will tend to lead to better informed design assumptions, and ultimately, to better solutions. By employing a rigorous and systematic procedure, decision-makers can make more competent user-oriented design decisions, in terms of cost-effectiveness, productivity and sustainability.
2.1. Role of BPE
Presently, there is a significant and growing evidence that buildings do not perform as anticipated at their project design stage, this is referred as “performance gap”. BPE provides the means of quantifying any performance gap and gives the key insights into its root causes. It provides guidance on how and why buildings perform, identifying opportunities for improvements in the design, systems or in control strategies [15]. This contributes for an overall energy efficiency and occupant satisfaction in the building. The techniques and approaches will depend on the project environment within which it is being applied, focusing on a range of technical performance requirements, and whether the evaluation is being conducted on a domestic or non-domestic building.
Ideally, when commissioning a building there are four different stages to ensure that the transition from construction to occupation, occurs with the least possible problems, while operational performance is optimized [16]. This transition needs to be considered throughout the development of a project, not just at the point of handover. The four key periods are defined as, figure 2.1:
Concept and design: in this initial phase, there is the need of ensuring that the client’s needs and requirements are clearly clarified. At this point, occurs the planning, programming and design of the building;
Construction development and review: reviewing comparable projects and assessing proposals in relation to facilities management and building users;
Pre-occupancy: at a pre-handover stage, operators must properly understand systems before occupation, so that the initial aftercare may start with the least mistakes possible for the stationing project team on site to receive feedback, fine tune systems and prepare operation;
Extended aftercare and post occupancy evaluation: it is suggested that this period last for three years. In year 1, problems are identified, training provided and systems adjusted, with regular previews. In year 2 and 3, performance is reviewed, and post occupancy surveys carried out, but with reviews becoming less frequent.
Figure 2.1: Diagram representing the four different stages during a BPE. Adapted from [15]. Nonetheless, most BPE are conducted only after the building is occupied. Hence, disregarding potential energy savings measures during other periods of the building life-cycle. In order to a BPE work effectively, data-gathering and analysis activities are necessary at every stage. Future post-occupancy evaluations (POE) will thus benefit from methodical accumulated information, regarding the building performance.
Quantitative and qualitative building performance criteria that represent the expected outcome, are at the centre of the model. The challenge is then to translate these performance indicators into useable benchmarks and to establish a methodology, with which is possible to measure easily and regularly the performance of the building in relation to those indicators. The actual performance of the building can be evaluated systematically over its lifetime, and compared to the more general benchmarks available, to determine the extent to which the building’s energy efficiency goals have been met.
A performance indicator is described as a performance metric, which simplifies complex information and points to a general state of the building. Performance indicators are accessible numeric metrics of energy usage or observed building characteristics, that indicate a certain aspect of the performance. They are intended to yield the best information for the least cost and time, using the available metered data and observable characteristics. Normally, the most common performance indicators for office buildings, take into consideration the energy consumption of the building, both for heating and cooling, building size, operating hours, wind exposure, internal temperature and humidity.
The use of a set of performance indicators will hence provide an assessment of whether or not the building is efficiently running. Benchmarking drives facilities to continually review the energy performance, by measuring and comparing it against standard benchmarks and other peer buildings. This will serve as a starting point for pre- and post-evaluation on capital improvements aimed at increasing operational efficiency and reducing costs. The European Union has perhaps the most advanced benchmarking policies for building sustainability in the world, manifested in wide-ranging legislation that is beginning to affect a number of sectors. This includes the European Building Directive which, from 2007 onwards, requires every house to have a performance certificate issued at point of sale, and every public building in Europe to have an annually renewed Performance Certificate.
Building Performance Evaluation (BPE)
2.2. Building Benchmarking
Benchmarking models based on energy-efficient indicators are valuable assessment tools for both governmental and private sectors in managing energy consumption. Various rating systems have been developed by organizations around the world, that strive to indicate how well a building meets prescribed requirements and to determine, whether a building design is efficient and to what level. Benchmarking is a mechanism whose main objective is to promote higher energy performance standards than the regulated ones [17], through the practice of comparing the measured performance over time of a single facility to itself, its peers, or established norms. The goal is to inform and motivate performance improvements, by providing a clear and detailed information about the building’s energy performance (energy labelling), allowing for the straight comparison between buildings. A well-implemented benchmarking certification must promote a clear quantification of design concepts, by assessing the most effective opportunities for energy efficient renovations, as well as a mean to quantify/verify energy savings [18].
To have a wider understanding about the benefits and performance of high-efficient buildings, detailed data and information is needed regarding building characteristics and operation. Therefore, qualitative information, as well as quantitative measures off environmental impacts and resources use, such as energy use, water consumption and waste generation must be collected. Used in these ways, benchmarks can promote efficiency in buildings and help accelerate market transformation.
A consistent and systematic evaluation of a building performance, enables future building design and may also help to “close the loop” in building delivery and management process. Besides, performance data can be used to set and report against targets as well as benchmark performances, and over time, against industry benchmarks or comparable buildings. The rating and certification systems and tools are intended to promote more sustainability during building design, construction, operation, maintenance, and disassembly or deconstruction by encouraging and enabling a better integration of environmental, social, functional, and financial concerns with other traditional decision criteria [19].
There are two major voluntary building rating and certification systems that provide the basis for the other approaches used throughout the world: the Building Research Environmental Assessment Method (BREEAM), which was developed in the U.K. and the Leadership In Energy and Environmental Design (LEED), created by the U.S. Green Building Council. These systems and tools can both be used to support the sustainable design, since they transform the sustainable goal into specific performance objectives to evaluate the overall performance.
Schwartz et al., [20] made a comparative overview between BREEAM and LEED, in which illustrates the differences and benefits of each benchmarking scheme. There are different perspectives in different sustainable building rating and certification approaches, but they have certain points in common. In general, these systems and tools deal, in one way or another, with the same categories of building design and life cycle performance: site, water, energy, materials, and indoor environment. Benchmarking is a crucial element of a commercial building’s energy management strategy as a method to control the energy performance, through ongoing measures, ensuring a cost-efficient operation. Across many commercial building markets, the practice has become standard operating procedure, as energy costs and associated environmental and sustainability issues have raised awareness around the importance of energy management.
Building Performance Simulation (BPS)
Chapter 3 - Building Performance Simulation (BPS)
Building performance simulation (BPS) is a method that uses a dynamic thermal model meant to predict the performance of a building, regarding energy consumption and thermal comfort. In other words, it aims to provide an approximate solution of a realistic building. It is important to compare these predicted results with the experimental ones, in order to validate the accuracy of the modelling.
The primary purpose of an office building is to provide a comfortable environment to its inhabitants, which will ensure their productivity. As a way to fully take advantage ofBuilding Performance Simulation (BPS) tools, it is essential at first to understand the heat transfer mechanisms within a building. Hence, a building’s thermal load is the amount of energy that must be removed or added to the system, to maintain a constant air temperature inside a room. The combination of these aspects has originated some models. Firstly, the heat-mass balance model (maybe the most accurate) ensures that all energy flows, in each zone, are balanced and involve the solution of a set of energy balance equations for the zone air, as well as, to the interior and exterior surfaces. The second class are thermal network approaches, which are a form of heat balance models with the discretization of the building in a network of nodes. The third class corresponds to the transfer function methods that use transfer functions or response factors to relate current value of heating and cooling load, to past values of either demand or heat gains. To have an accurate simulation, it is also required apart from the control of the above-mentioned aspects, to take into account the weather data, time of the day, building geometry, construction type and occupancy. Besides, the decision related to the right time steps is crucial for the simulation because decreasing the time step not always improves the accuracy.
3.1. Energy Balance in Buildings
As a starting point, for any building evaluation it is fundamental to review concepts about heat transfer in buildings. The recent interest in this field, due to increasing demand and thermal comfort needs, requires an in-depth study of the energy balance of a building, in terms of the thermal losses and gains that occur through its surroundings. Therefore, enabling building performance evaluations to make the methods of forecasting more reliable.
The law of conservation of energy in stationary conditions states that, for a certain instant dt, the energy balance in any frontier controlled volume is always null. The energy conservation in a zone is an analysis, which allows to quantitatively compare the main flows and sources of energy that characterize a thermal zone. There is a number of possibilities to use the energy conservation equation, but in stationary regime it is only possible to solve one variable at a time. For example, one can predict the inside temperature for a determined scenario without air conditioning or one can impose a fixed inside temperature, in order to estimate the air conditioning load. When performing a building’s heat balance, it is important to first understand which are the key factors that contribute for the building’s gain or loss of heat, as are some described in figure 3.1. In any energy balance, one needs to keep in mind that the rate of gains in a building equals the rate of losses, as equation 3.1 translates.
Figure 3.1: Flows of energy in a thermal zone. Source: [21]
A building’s envelope is a critical component, since it both protects the building occupants while plays a role in regulating the indoor environment, controlling the flow of energy between the interior and exterior. With respect to gains, the main aspects which will have effect on a building’s heat balance can be divided in either internal and external. Internal gains are due to the presence of people and/or electric equipment, the usage profile and equipment’s power may cause a significant increase of heat inside the building, consequently affecting the thermal load. External gains like solar radiation that pass through glazed construction are also a key factor for the increase of thermal energy.
Regarding the losses of heat in a building, they may occur by four different processes. One is by filtration losses, which are related to the air tightness of the building. Other is by ventilation losses, due to mechanical or natural ventilation. The third pertains to the influence of building’s thermal mass, which will greatly affect the amount of stored heat depending on the temperature gradient. The last concerns the transmission losses. They can have a major impact, since they are the most common losses of heat in a building. Transmission losses must be divided in several components considering that they can occur by three different forms: through building elements such as walls, doors, internal floors and ceilings, windows and others; along thermal bridges and over ground-coupled elements such as floors and basements.
With all this information, one can establish a relationship between all these factors previously discussed, and easily establish an expression of heat balance in stationary regime for a typical room, with inside constant temperature, as presented in equation 3.2:
𝑮𝒊𝒈+ 𝑮𝒔+ 𝑮𝒗+ 𝑮𝒂𝒄= 𝝆. 𝑪𝒑. 𝑽𝒔.(𝑻𝒔𝒖𝒑− 𝑻𝒊)
𝝏𝒕 + ∑ 𝑨𝒏. 𝑼𝒏
𝒌 𝒏=𝟏
× (𝑻𝒊− 𝑻𝒔𝒏) (3.2)
where, 𝐺𝑖𝑔 is the internal gains due to occupants’ activity, electric equipment and lighting [W]; 𝐺𝑠 is the solar gains which pass through transparent surfaces [W]; 𝐺𝑣 is the gains due to ventilation, resulting from outside air intake, mainly through infiltration [W]; 𝐺𝑎𝑐 is the air-conditioning load needed to maintain a constant inside temperature [W]; 𝜌. 𝐶𝑝. 𝑉𝑠.(𝑻𝒔𝒖𝒑 𝜕𝑡−𝑻𝒊) are the
Building Performance Simulation (BPS)
through the surroundings [W], Tsn is the temperature of the surface “n”, ρ is the density of air
[kg/m3], C
p is the specific heat of air [J/Kg.K], Vs is the volume of the room, An is the area of the
surface [m2], U
n is transmission heat coefficient of the surface “n” [W/(m2.K)];
To properly calculate equation 5, one needs to first understand how to determine the other variables. Thus, to calculate the solar gains from transparent surfaces there is a correlation that can approximately estimate, as expressed in equation 3.3:
𝑮𝒔 = 𝑨𝒈. 𝑭𝒔× (𝑹𝒅𝒊𝒓. 𝑪𝒐𝒔(𝒉𝒆𝒊𝒈𝒉𝒕). 𝑪𝒐𝒔(𝒂𝒛𝒊𝒎𝒖𝒕𝒉)+. 𝑹𝒅𝒊𝒇) (3.3)
where, Ag is the area of the transparent surface [m2], Fs is the solar factor, Rdir is the direct radiation
[W/m2], R
dif is the diffuse radiation [W/m2], solar height [º] and azimuth in [º].
Finally, there are gains from ventilation and air-conditioning, which are very similar to calculate, equation 3.4 and 3.5 can respectively translate these gains:
𝑮𝒗= 𝝆. 𝑪𝒑.𝐕̇. (𝑻𝒆𝒙𝒕− 𝑻𝒊) (3.4)
𝑮𝒂𝒄= 𝝆. 𝑪𝒑. 𝐕̇. (𝑻𝒔𝒖𝒑− 𝑻𝒊) (3.5)
where, V̇ is the volumetric flow of the air-conditioning system [m3/s], T
ext is the outside
temperature [ºC], Tsup is the supply air temperature used to heat the space [ºC], Tint is the inside
temperature [ºC].
3.2. Dynamic Simulation in Buildings
Nowadays, computational modelling and simulation is one of the most powerful and commonly used analysis technique by the scientific community, because of the simplicity for the user to fully comprehend the heat transfer mechanisms within a building. Throughout the recent years, it has been widely recognized inside the building industry, that predicting and analysing future building behaviour in advance is far more efficient and economical, than fixing problems when the building is in the use phase.
BPS tools use numerical approximation of partial differential equations to solve spatial and temporal discretization. The accuracy of a building simulation is based on the number of network nodes and the associated thermal capacities. If the number of nodes used is big enough to assure some level of accuracy, on the other hand it also demands a large computational effort. However, the accuracy of the model does not only depend on the number of nodes, but also on the discretisation scheme. A reduced time step usually means a more accurate solution [22].
Whole building energy simulation tools, allow the detailed calculation of the energy required to maintain specified building performance criteria under the influence of external inputs, usually during the course of a full year. The energy performance of a building is mostly driven by six key factors: climate, building envelope, building equipment, operation and maintenance, occupant behaviour and indoor environmental conditions.
In building design while using simulation approaches, analysis often must deal with uncertainty during various steps of the optimization, resulting in uncertain optimal solutions. These uncertainties generally may arise, as described by de Wit [23], from modelling uncertainties, numerical uncertainties and input uncertainties. So, the choice of the program should always depend on the question that needs to be answered.
A good building performance simulation tool depends on the tool’s capabilities for building design optimization and on the availability of advanced building control strategies. Over the past 50 years a wide range of building performance simulation tools have been developed to assist engineers in accessing a building’s performance. An overview of the most used BPS tools, like for example: EnergyPlus, ECOTECT, Esp-r, HAP, TRNSYS, IES<VE>, is provided by Crawley et al., [24], as well as, a comparison of the capabilities of each simulation program.
3.2.1. EnergyPlus Simulation Tool
During this thesis, the BPS tool selected to make an evaluation of a building’s energy consumption and assessment of its occupants’ thermal comfort is EnergyPlus 8.5. This software program was chosen for the reason of being one of the most used energy analysis and thermal load simulation programs. But, mostly, for its free availability and capabilities as an open source BPS tool.
EnergyPlus is the combination of two software programs developed in 70s and 80s, BLAST and DOE-2. It is based on a user’s description of a building from its physical aspects, mechanical systems and behaviour patterns [25]. EnergyPlus has the ability to calculate the heating and cooling loads of a building necessary to maintain certain set-points, the energy consumption of the building’s system and equipment, and other simulation details that user may seem necessary to estimate. EnergyPlus was first released in 2001 and has been constantly updated, seeking to improve itself while adapting to the demands of present and future projects.
EnergyPlus is not a user interface. It is intended to be the simulation engine around which a third-party interface can be wrapped. In this research, the cross-platform employed is Openstudio plug-in for Google SketchUp, figure 3.2, which is plug-intended to support whole buildplug-ing energy modellplug-ing using EnergyPlus. Openstudio plug-in for SketchUp is an open source software with the goal to facilitate the creation of the building’s geometry in EnergyPlus. It is a fully graphical application, unlike EnergyPlus, making it more user-friendly.
Building Performance Simulation (BPS)
The simulation building process can be separated into four phases, as a general guide to create an EnergyPlus model. The first step consists of observing the real system and the interactions among its various components and of collecting data on the building behaviour. Therefore, is necessary to obtain meteorological information from the building site and, most important, it should be selected a weather file that best represents the climate region. EnergyPlus website has a database for more than 2100 location, where one can find weather data for virtually every region in the world. After obtaining sufficient building information the next step can be started.
In step two, one must begin by constructing the geometric representation of the building, dividing it in thermal zones that properly illustrates the shape and the partitions of the building. This stage is developed with SketchUp software and with Openstudio plug-in, because of its simplicity for the user, during the conception of the model. After completing the 3D modelling, the building model has to be converted into an IDF file, where all the geometric parameters are specified. Then, it is time import the file into the EnergyPlus-Launch engine and begin modelling the building characteristics. In IDF Editor one will be able to define the materials that compose the several construction elements like the floors, roof, walls and windows.
The third step involves the configuration of the behaviour patterns, internal gains and all the other parameters that may have an influence on the inside environment (ground temperature, shadowing, occupation schedules, lighting, electric equipment, infiltration, temperature set-points, etc.). In some cases, it is not possible to collect all the data pertaining to building (for example, usage profile) and in the end, it will be necessary to apply a probability distribution to estimate the input parameter.
The last step regards building’s mechanical system description. At this point, the heating, cooling and ventilation systems of the building are modelled according to the data collected. Finally, with all the building’s parameters and characteristics defined in EnergyPlus engine, the simulation is ready to be started. The verification and validation of the building model is followed to assess the validity of results.
The simulation in EnergyPlus occurs simultaneously in two major stages, building simulation heat balance module and systems simulation module [26]. Firstly, the simulation starts by doing surfaces heat balance considering the conduction, convection and radiation heat flows. These heat balances, will have an impact on the internal air heat balance in each zone, which handles with heat exchange air derived from ventilation, exhaust air and infiltrations. Thus, in this primary stage, the results obtain from each zone heat balance will work as input for the systems simulation module, that is responsible for determining the heating and cooling loads for the defined timestep. Next, this information will be forwarded again as an input for the building simulation module, leading to update the conditions of each zone for the following timestep, and so on like this until the end of the simulation.
Equation 3.6 translates how EnergyPlus calculates the heat balance on the zone air for timestep z: 𝐶𝑧 𝑑𝑇𝑧 𝑑𝑡 = ∑ 𝑄̇𝑖+ ∑ ℎ𝑖𝐴𝑖(𝑇𝑠𝑖− 𝑇𝑧) + ∑ 𝑚̇𝑖𝐶𝑝 𝑁𝑧𝑜𝑛𝑒𝑠 𝑖=1 (𝑇𝑧𝑖− 𝑇𝑧) 𝑁𝑠𝑢𝑟𝑓𝑎𝑐𝑒𝑠 𝑖=1 + 𝑁𝑠𝑙 𝑖=1 𝑚̇𝑖𝑛𝑓𝐶𝑝(𝑇∞− 𝑇𝑧) + 𝑄̇𝑠𝑦𝑠 (3.6)
where: 𝐶𝑧𝑑𝑇𝑧
𝑑𝑡 – energy stored in the zone air;
∑𝑁𝑠𝑙𝑖=1𝑄̇𝑖− sum of the convective internal loads;
∑𝑁𝑠𝑢𝑟𝑓𝑎𝑐𝑒𝑠𝑖=1 ℎ𝑖𝐴𝑖(𝑇𝑠𝑖− 𝑇𝑧) – convective heat transfer from the zone surface; ∑𝑁𝑧𝑜𝑛𝑒𝑠𝑖=1 𝑚̇𝑖𝐶𝑝(𝑇𝑧𝑖− 𝑇𝑧) – heat transfer due to interzone air mixing;
𝑚̇𝑖𝑛𝑓𝐶𝑝(𝑇∞− 𝑇𝑧) – heat transfer due to infiltration of outside air;
Verification and Validation of Simulation Model
Chapter 4 - Verification and Validation of Simulation Model
Simulation models are used to evaluate the performance of a real system, concerning its operating characteristics. Since a BPS has the goal of producing an accurate and credible model, the output data from a simulation should directly correspond to the outputs recorded from the actual building. However, during the building modelling a collection of simplifications about the components and the structure of the system, plus assumptions made while estimating input parameters, decrease the level of confidence in the results obtained from the simulation.
In this context, verification and validation are essential iterative processes to conduct throughout the development of the model, until the model accuracy is considered accepted. Verification pertains to computer simulation software used to model the building. It is a procedure of confirming that the computer simulation is correctly implemented, with respect to the conceptual model. The objective of model verification is to ensure that the implementation of the model is correct. If the input parameters and logical structure of the model are correctly represented in the model, verification has been completed. For the most part, common sense is used in completing this step.
Verification and validation, although theoretically different, typically are simultaneously performed. Validation is the overall procedure of comparing the model and its behaviour to the actual building [27]. Once developed and validated, a model can be used to investigate a wide variety of aspects regarding the building (thermal comfort, cost-efficient opportunities, etc).
4.1. Validation
Validation of a model consists on making sure that the model simulations are providing accurate and reliable results about the building’s performance. It is a process of assessing, by independent means, the quality of the data products derived from the system outputs, which is related to the simulation algorithms accuracy and correctness. Typically, exists three types for validation of a building performance simulation software. The first is called comparative testing, in which a program is compared to itself or to other programs. The other two techniques are: analytical validation and empirical validation [28].
In the analytical verification, the outputs from a program or algorithm are compared to the results from a known analytical solution for isolated heat transfer mechanisms, under very simple boundary conditions. In other words, it tests the numerical solutions of a software, but does not test the simulation model. It is based on very simple physical processes which are already pre-established and well-known, making it only applicable to a limited number of situations, and if the results obtained with the software are correct they can be extrapolated to more complex cases, given its simplicity it provides an exact standard for comparison. This method enables an easy and inexpensive way to understand correctly the basic physics of a situation, but for the more complex models, where multiple building parameters and aspects need to be modelled, this technique is not useful.
In the Empirical validation, the calculated results from a program or software are compared to monitored data from a real structure or building. This technique requires high quality detailed
and very expensive. The characterization of some of the more complex physical processes (heat transfer with the ground, infiltration, indoor air motion and convection) treated by simulation operating systems are often excluded, due to measurement difficulties and uncertainties. Because of these disadvantages only a limited number of cases are economically practical. But at the same time, it also provides a rigorous and accurate test of the model and the solution process, making it applicable to any level of complexity.
The research presented intends to check the accuracy of a building simulation model through an empirical validation. Consequently, optimization techniques must be integrated into simulation analysis. The whole process of validation consists of comparing the results with what is expected based on utility data. Therefore, a base model should be created and calibrated so that it matches the expected performance. The calibrated model should then be verified to ensure that the model is operating as anticipated based on the input transformations. In the end, validation can only be achieved through model calibration.
Hence, model calibration is the iterative process of comparing the model to the real system, adjusting the input of each variable to see the effect on the design objectives while other variables are kept unchanged. This method is often time-consuming and is repeated until model accuracy is deemed acceptable. To validate the results produced from the BPS, statistical techniques are employed as a method to assess the accuracy of outputs and the consistency of the same.
Although sometimes ignored in BPS, it is very important to perform an uncertainty and sensitivity analysis to confirm that the accuracy of the results is properly understood, by quantifying and characterizing the uncertainties of the model for design information and quality assurance. Both these methods can provide information about reliability towards design parameters, with respect to the overall design. UA (uncertainty analysis) and SA (sensitivity analysis) are applied in several approaches for parameter screening with the aim of assessing the robustness of the model and as a powerful technique for model validation.
The verification and validation phases often detect bugs that require further debugging, or incorrect assumptions that need significant model modifications and then further model re-verification and re-validation. It should also be noted that no model is ever 100% verified or validated. Validation is not an absolute method. Any simulation model is a representation of a system, and the model’s behaviour is at best an approximation to the system’s behaviour.
4.2. Model Calibration
Calibration is a crucial technique during building simulation to ensure the maximum accuracy of results. It consists on a process of quantitatively defining the system responses to known, controlled signal inputs. It is meant to evaluate the accuracy of the predicted building performance simulation outputs, according to a set of parameter modifications (new insulation materials, variation in the shading devices, optimization of HVAC systems), by comparing to the actual measured data from the building. This procedure has the goal to diminish the gap between the known results from the building’s data and the values obtained from the model simulation. Kaplan et al., [29], [30] defined calibration as the process of adjusting the parameters of a model through several iterations, until it agrees with recorded data within some predefined criteria. The definition of these criteria is a complex issue and, to date, it is impossible to determine how close a tolerance needs to be to fulfil the calibration process. The calibration of a BPS model comprises
Verification and Validation of Simulation Model
two ideas towards quantitatively define the systems response to known, controlled parameters: Calibration Signature and Characteristic Signature.
Characteristic Signature, equation 4.1, consists on the comparison between baseline uncalibrated performance simulation results and a modified baseline simulation, usually by a normalized plot that easily demonstrates the difference between them. The baseline uncalibrated model is based on information known about the building design construction, occupancy profiles and systems control and management, which may introduce some inaccurate results. These inputs are tested and changed (increased or decreased) one at a time, and two characteristic signature plots are generated for cooling and heating energy demand as a function of the ambient air temperature. The main limitation of this method is that some parameters are independent of ambient temperature and may not change accordingly, but still may have an important role in the building energy needs.
𝐶ℎ𝑎𝑟𝑎𝑐𝑡𝑒𝑟𝑖𝑠𝑡𝑖𝑐 𝑠𝑖𝑔𝑛𝑎𝑡𝑢𝑟𝑒 = 𝐶ℎ𝑎𝑛𝑔𝑒 𝑖𝑛 𝑒𝑛𝑒𝑟𝑔𝑦 𝑐𝑜𝑛𝑠𝑢𝑝𝑡𝑖𝑜𝑛
𝑀𝑎𝑥𝑖𝑚𝑢𝑚 𝑒𝑛𝑒𝑟𝑔𝑦 𝑐𝑜𝑛𝑠𝑢𝑚𝑝𝑡𝑖𝑜𝑛× 100 (4.1)
where the change in energy consumption represents the difference between the modified simulation value and the baseline uncalibrated simulation value.
Similarly, Calibration signature, equation 4.2, shows the difference between measured data results and the modified baseline model simulation, by a normalized plot with the simulated energy consumptions as a function of the outside temperature. The objective is to verify the difference in input parameters with several model simulations, in order to understand where the discrepancies in the building’s performance lay. This process has the advantage to perform faster calibrations because the users have a better idea about which parameter needs to be altered, instead of a trial and error technique that may take much longer [31]. Calibration signature output results are a clear demonstration of how much error is inserted into the building model simulation, enabling a rapid assessment pertaining to the accuracy of the predictions.
𝐶𝑎𝑙𝑖𝑏𝑟𝑎𝑡𝑖𝑜𝑛 𝑠𝑖𝑔𝑛𝑎𝑡𝑢𝑟𝑒 = −𝑅𝑒𝑠𝑖𝑑𝑢𝑎𝑙
𝑀𝑎𝑥𝑖𝑚𝑢𝑚 𝑚𝑒𝑎𝑠𝑢𝑟𝑒𝑑 𝑒𝑛𝑒𝑟𝑔𝑦 × 100 (4.2)
where,
𝑅𝑒𝑠𝑖𝑑𝑢𝑎𝑙 = 𝑆𝑖𝑚𝑢𝑙𝑎𝑡𝑒𝑑 𝐶𝑜𝑛𝑠𝑢𝑚𝑝𝑡𝑖𝑜𝑛 − 𝑀𝑒𝑎𝑠𝑢𝑟𝑒𝑑 𝐶𝑜𝑛𝑠𝑢𝑚𝑝𝑡𝑖𝑜𝑛 (4.3) To have a broader understanding of the accuracy of the model and to minimize the compensation effect, whereby over-estimations cancel out under-estimations, researchers proposed the adoption of a standardized statistical indices as mean of comparing the errors between simulated and measured data, which better illustrate the performance of a BPS model. These two indices are the Root Mean Square Error (RMSE) and Mean Bias Error (MBE). When analysing a building’s parameter, the RMSE can give an important help because it represents the standard deviation of the differences between the model simulated and the measured data, thereby measuring the variability of the data as defined in formula 4.4:
𝑅𝑀𝑆𝐸 = √∑ 𝑅𝑒𝑠𝑖𝑑𝑢𝑎𝑙𝑡 2 𝑛 𝑡−1 𝑛 − 2 (4.4)
where n is the number of data points. Towards a better measurement of the overall prediction accuracy of the model a relevant index associated with RMSE is used to closely reflect the accumulated magnitude of error. The Coefficient of Variation of Root Mean Square Error, CV(RMSE), is a measure of accumulated error normalised to the mean of the measured values, allowing to efficiently determine how well a BPS model fits the data by capturing offsetting errors between measured and simulated data, as defined in formula 4.5:
𝐶𝑉(𝑅𝑀𝑆𝐸)(%) = √∑𝑛𝑡−1𝑅𝑒𝑠𝑖𝑑𝑢𝑎𝑙𝑡2 𝑛 − 2 𝑚̅ = 𝑅𝑀𝑆𝐸 𝑚̅ (4.5)
where 𝑚̅ represents the average of measured consumption data. In contrast with the RMSE, the Mean Bias Error (MBE), equation 4.6, is an overall measure of how influenced the data is and is also a good indicator of how much error will likely be introduced in the annual energy consumption estimates, since positive and negative errors will cancel each other out.
𝑀𝐵𝐸 = ∑ 𝑅𝑒𝑠𝑖𝑑𝑢𝑎𝑙𝑡
𝑛 𝑡−1
𝑛 (4.6)
Similarly, to CV(RMSE) a normalised non-dimensional bias measure between measured and simulated data, NMBE, is a good indicator of the model overall bias. Equation 4.7 defines a quick and easy estimate to accomplish it.
𝑁𝑀𝐵𝐸 (%) = ∑𝑛𝑡−1𝑅𝑒𝑠𝑖𝑑𝑢𝑎𝑙𝑡 ∑𝑛𝑡−1(𝑚𝑡)
(4.7)
where 𝑚𝑡 is the respective measured data point. The calibration and corresponding BPS validation, both for heating and cooling energy consumption, is based on a model’s compliance with standard criteria as shown in table 4.1 by means of using the previous defined indices, and generally the models are considered calibrated if they are in agreement with ASHRAE Guideline 14 [32]. The criteria may vary depending the type of data one is working with, hence models can be calibrated accordingly to monthly or hourly measured data.
Table 4.1: Acceptance criteria for calibrating BPS models. Standard/guideline Monthly criteria (%) Hourly criteria (%)
MBE CV(RMSE) MBE CV(RMSE)
ASHRAE Guideline 14 [32] 5 15 10 30
IPMVP [33] 20 - 5 20
Verification and Validation of Simulation Model
However, calibration is not an exact science, after all the same exact building can have numerous models to be considered calibrated in accordance to the standard criteria, therefore calibration does not have a unique solution. Meaning that when there is reasonable agreement between measured and simulated data, the BPS model may be deemed calibrated. The whole process of calibration demonstrated in a simplistic way in figure 4.1, shows how it is going to be conducted during this research study.
Figure 4.1: Methodology process for calibrating a simulation model. Source: [31]
As a complement to the former indices, one may consider to assess the total error of a BPS model calibration. In the attempt to minimize the total error of the model, one may arbitrarily combine the root mean square heating and cooling with mean bias heating and cooling in algebraic combination to have a measure of error as defined in formula 4.8:
𝐸𝑅𝑅𝑂𝑅𝑇𝑂𝑇𝐴𝐿= [𝑅𝑀𝑆𝐸𝑇𝑂𝑇𝐴𝐿2 + 𝑀𝐵𝐸
𝑇𝑂𝑇𝐴𝐿2 ]1/2
= [(𝑅𝑀𝑆𝐸𝐶𝐿𝐺2 + 𝑅𝑀𝑆𝐸
𝐻𝑇𝐺2 ) + (𝑀𝐵𝐸𝐶𝐿𝐺2 + 𝑀𝐵𝐸𝐻𝑇𝐺2 )]1/2
(4.8)
In addition, another aspect to emphasize is that the current calibration methodology relates solely to predicted energy consumption, and does not account for uncertainties of building software environments. Calibrated Model Satisfying RMSE and NMBE? Make calibration signature Compare calibration signature with parameter
characteristic signature
Adjust parameter with the best matching signature
Compare local climate with climates
in library
No
4.3. Uncertainty and Sensitivity Analysis
The aim of a UA/SA (Uncertainty and Sensitivity Analysis) study is to support the design process by providing additional information of the parameters chosen. The different sources of uncertainty that play a role in the design of the BPS must be considered throughout the modelling, but especially during model calibration. The model does not need to represent as it is architecturally, but rather its thermal behaviour. De Wit [35] stated that modelling uncertainties arise from commonly applied physical assumptions and simplifications in a computer model. Thus, a major challenge in simulation tools is how to deal with difficulties through a large variety of parameters and complexity of factors.
Risk in the assessment of a BPS model can be categorized in different types of uncertainty, according to Hopfe [10]:
Physical; Scenario;
Design parameters.
Firstly, during the construction of the building, deviations from the design specifications may occur due to incomplete specification of all relevant properties of the building. Physical uncertainties refer to the material properties such as thickness, density or even wall, roof and floor characteristics. This is the most common source of uncertainty within a building, since one can be completely aware of the exact properties of a material and the designer as no influence on this type of uncertainty. Taking these uncertainties into account will considerable affect the quality assurance of the building model.
Secondly, uncertainties may be introduced in the scenario, trough external conditions imposed to the building, which involves the wide range of different possible usages. They are related to the influence of infiltration rate, outdoor climate conditions and occupant behaviour that may be unpredictable to determine and may change during the building life time.
Finally, uncertainties in design parameters can be described as design variations that occur during the modelling process. Even if a model is developed on the basis of a complete description of all appropriate building properties, the introduction of assumptions and the simplifications of physical processes bring uncertainty into the model. For instance, in the conceptual design of the building, aspects like the thermal zone geometry or glazing dimensions can have a substantial influence on the accuracy of the model. In addition, numerical errors and numerical approximations also represent a source of uncertainty. It is assumed that choosing the appropriate discretization scheme and time step can help to minimize the numerical uncertainty of the model, hence this uncertainty will not be addressed during this study.
The goal of integrating UA/SA into a simulation analysis, is to establish the impact that uncertainties have on the predicted energy use [10]. Uncertainty analysis is aimed to show the effect that uncertainty has on the outcome. While sensitivity analysis is to find a limited set of parameters, which account for most of the uncertainty in the model output [23].
Uncertainty analysis investigates the uncertainty of variables that are used during the design of the model, and then quantifies its propagation through the simulation. Uncertainty refers to the range of variation of a physical property, represented by a probability distribution. So, an uncertainty analysis (UA) takes into account uncertainties related to simplifications assumed during the development of the model and lack of information with respect to the input data. A
![Figure 1.1: EU final energy consumption by sector and buildings energy mix in 2015. Adapted from: [1]](https://thumb-eu.123doks.com/thumbv2/123dok_br/18421223.895245/13.892.166.772.560.797/figure-final-energy-consumption-sector-buildings-energy-adapted.webp)
![Figure 2.1: Diagram representing the four different stages during a BPE. Adapted from [15]](https://thumb-eu.123doks.com/thumbv2/123dok_br/18421223.895245/18.892.168.724.107.382/figure-diagram-representing-different-stages-bpe-adapted.webp)
![Figure 3.1: Flows of energy in a thermal zone. Source: [21]](https://thumb-eu.123doks.com/thumbv2/123dok_br/18421223.895245/22.892.183.720.95.406/figure-flows-energy-thermal-zone-source.webp)
![Figure 4.1: Methodology process for calibrating a simulation model. Source: [31]](https://thumb-eu.123doks.com/thumbv2/123dok_br/18421223.895245/31.892.127.784.277.667/figure-methodology-process-calibrating-simulation-model-source.webp)
![Table 5.5: Recommended values for power equipment in office and homes. Source: [38]](https://thumb-eu.123doks.com/thumbv2/123dok_br/18421223.895245/37.892.266.596.929.1140/table-recommended-values-power-equipment-office-homes-source.webp)
![Figure 5.1: Adaptive Temperature Limits (ATG) chart. Source: [50].](https://thumb-eu.123doks.com/thumbv2/123dok_br/18421223.895245/41.892.140.753.103.455/figure-adaptive-temperature-limits-atg-chart-source.webp)
![Figure 6.1: a) ATES system in TU/e campus; b) ATES warm and cold clusters in Tu/e. Source: [53][53]](https://thumb-eu.123doks.com/thumbv2/123dok_br/18421223.895245/44.892.128.774.908.1124/figure-ates-campus-ates-warm-cold-clusters-source.webp)