A Decision Support System for IST Academic Information
Elsa Cardoso*, Helena Galhardas*, Maria José Trigueiros
†, Rito Silva*
*Instituto Superior Técnico, INESC-ID, Portugal. Elsa.Cardoso@inesc-id.pt, hig@inesc-id.pt, Rito.Silva@inesc-id.pt
†Instituto Superior de Ciências do Trabalho e da Empresa, Portugal.
mjtrig@iscte.pt
Abstract
This article describes the Decision Support System (DSS) for Academic Information being developed at Instituto Superior
Técnico, the Engineering School of the Technical University
of Lisbon. In Portuguese, this project has been given the acronym SADIA (Sistema de Apoio à Decisão da Informação
Académica).
This paper focuses on the early phases of the DSS development process, i.e., the business requirements definition and the dimensional modelling. First, we show how the business requirements of the School drive the definition of the DSS dimensional model. Second, we detail the logical dimensional model for a selected business process, the IST Student Admission process. Third, the corresponding physical design decisions are reported. The results obtained from the three phases were successfully validated by business users.
Keywords: Decision Support Systems, Data Warehouse, Information Systems.
1 Introduction
Instituto Superior Técnico (IST) is the Engineering School of the Technical University of Lisbon, and one of the biggest Higher Education Schools in Portugal since the first decade of the 20th century. Currently, IST offers twenty-two 5-year
undergraduate degrees to a population of more than 10,000 students.
Two years ago, IST has started the FENIX project [2] aiming at the integration of academic management information. New Information Systems are being developed and others restructured. As part of this global strategy, the School’s Board of Directors has also decided to implement an Academic Information Decision Support System known as the SADIA system (in Portuguese SADIA stands for Sistema
de Apoio à Decisão para a Informação Académica) [8]. The
first prototype of the system is focused only on the School Pedagogic Assessment. Later, the SADIA system will feed a higher-level DSS system, which is being implemented by the Technical University of Lisbon to support the Dean’s management decisions.
This paper describes the SADIA system in terms of the development process and results in dimensional modelling of the underlying Data Marts. Of note, the implementation of the system is already in progress.
1.1 Decision Support Systems: Basic Definitions The SADIA system has been developed according to the
Business Dimensional Lifecycle proposed by Ralph Kimball
[1]. Figure 1 illustrates the basic elements of a Data Warehousing project, based on a four level architecture: (1) Operational Data Source Systems; (2) Staging Area; (3) Presentation Servers; (4) End-user Data Access.
extract
extract
extract
Storage:
Flat files (fastest); RDBMS; Other Processing: Clean; Prune; Combine; Remove duplicates; Household; Standardize; Conform dimensions; Store awaiting replication; Archive; Export to data marts
No user query services!
populate, replicate, recover
Data Mart #1:
OLAP (ROLAP and/or MOLAP) query services;
Dimensional!
Subject-oriented; Locally implemented; User group driven; May store atomicdata; May be frequently refreshed;
Conforms to DW Bus Data Mart #2: Data Mart #3: Conformed dimensions Conformed facts Conformed dimensions Conformed facts DW BUS DW BUS populate, replicate, recover populate, replicate, recover
feed Ad Hoc QueryTools
Report Writers End User Applications Models Forecasting; Scoring; Allocation; Data mining; Other downstream systems; Other parameters; Special UI feed feed feed Upload cleaned dimensions Upload model results SOURCE SYSTEMS (LEGACY)
DATA STAGING AREA “THE DATA WAREHOUSE”
PRESENTATION SERVERS END USER DATA ACCESS
extract extract extract extract extract extract Storage:
Flat files (fastest); RDBMS; Other Processing: Clean; Prune; Combine; Remove duplicates; Household; Standardize; Conform dimensions; Store awaiting replication; Archive; Export to data marts
No user query services!
populate, replicate, recover populate, replicate, recover Data Mart #1:
OLAP (ROLAP and/or MOLAP) query services;
Dimensional!
Subject-oriented; Locally implemented; User group driven; May store atomicdata; May be frequently refreshed;
Conforms to DW Bus Data Mart #2: Data Mart #3: Conformed dimensions Conformed facts Conformed dimensions Conformed facts DW BUS DW BUS populate, replicate, recover populate, replicate, recover populate, replicate, recover populate, replicate, recover feed
feed Ad Hoc QueryTools
Report Writers End User Applications Models Forecasting; Scoring; Allocation; Data mining; Other downstream systems; Other parameters; Special UI feed feed feed feed feed feed Upload cleaned dimensions Upload model results SOURCE SYSTEMS (LEGACY)
DATA STAGING AREA “THE DATA WAREHOUSE”
PRESENTATION SERVERS END USER DATA ACCESS
Figure 1. Basic Elements of a Data Warehouse [1] Source systems, also called operational or legacy systems (in mainframe environments), support the operational nature of the business, recording and managing transactions. The main priorities of these systems are transactional performance, uptime and availability. They usually do not record historical data and are not suitable for the generation of management reports. Traditionally, source systems are developed in organizations to support certain business areas or departments.
The Staging Area encompasses a storage area and a set of processes (which may be implemented in one or more machines) that prepare source data for use in the Data Warehouse (DW). Some of these processes are: (1) Data cleaning; (2) Data reformatting; (3) Data transformation; (4) Semantic validation; (5) Store awaiting replication; and (6)
Replication to presentation servers. At this level no kind of queries or presentation services should be allowed.
The Presentation Server is the target physical machine that stores the DW data for direct querying by end users, report writers and other applications. At this level, data is presented and stored in a dimensional framework. Presentation servers may be implemented using relational databases (with star schemas) or non-relational OLAP (On-line Analytic Processing) databases (with multi-dimensional cubes).
A Data Mart is, according to Kimball, a logical subset of the complete Data Warehouse, i.e., a restriction of the DW to a single business process or to a group of related business processes designed for a specific group of users. A Data Mart is usually sponsored and built by a single part of the business. Each Data Mart is represented by a dimensional model, supported by a set of fact tables. The apparent inconsistency does not really exist. At a high-level analysis, when subject business areas and candidate dimensions are identified, data marts may be restricted to a single star schema (meaning one dimensional model). However, the physical design of the Data Mart may impose the implementation of several star schemas, because different information aggregation levels may be needed or by performance reasons associated with data sparseness.
Kimball considers the Data Warehouse made up of the union of all its Data Marts. This statement is valid to Kimball as long as the Data Warehouse Bus Architecture rules are respected. That is, within a Data Warehouse all Data Marts must be built from conformed dimensions and conformed facts [1], otherwise Data Marts may soon become isolated and obsolete systems.
1.2 Case Study: the SADIA System
The Academic Information Decision Support System of Instituto Superior Técnico (SADIA) [8] is part of the School’s global strategic integration plan of academic management. The IST’s Computer Centre (CIIST) is the entity in charge of the FENIX project [2]: the new integrated academic management Information System of IST. The purpose of the FENIX project is to create a new Information System able to successfully respond to the current needs of all participants in the tuition process (i.e., teachers, students and administrative services). The system performance should enable gains of both time and effort, and the system ought to be designed in a modular way, in order to be easily expanded. The FENIX project has two main tracks: the operational and the decision support tracks. The operational track supports the execution of the School’s functional business processes. The decision support track (i.e., the SADIA system) provides present and historical information organized in terms of key performance indicators to support management decisions. One primary goal of the SADIA system, required by the Board of Directors, is the automatic generation of tables
including the statistics required by the external processes for accreditation and assessment of undergraduate degrees. The SADIA system has been designed according to Kimball methodology for developing Data Warehouses entitled
Business Dimensional Lifecycle.
1.3 Outline of the paper
This paper is organized in six sections. Section 2 presents the
Business Dimensional Lifecycle, which is the DW
development process adopted for the SADIA project. Sections 3 to 6 describe the execution of some activities of the Business Dimensional Lifecycle Process in the SADIA project applied to a single business area. The selected business area is the IST Student Admission process. Section 3 briefly describes the Project Planning and the Management phase. The Business Requirements Definition, described in Section 4, encompasses the Business Modelling activity performed for the SADIA project. This section presents a detailed description of the selected business process and a few examples of user analysis queries, regarding the IST Admission process. The Dimensional modelling activity is described in Section 5. This section presents the step-by-step development of the logical dimensional model of the IST Student Admission Data Mart. Physical Design decisions are reported in Section 6. Finally, we conclude and summarize future work.
2 Development Process
Figure 2 presents the Business Dimensional Lifecycle. Kimball compares this methodology to a conductor’s score [1], as a way of assuring that every piece of the project is joined correctly at the right moment. Well-succeeded DW implementations depend on the integration of numerous tasks, components and tools. To implement a successful DW, it is imperative to gain skills in all project areas. It is not enough to design the best dimensional model or to buy the most expensive technology of the market... it is necessary to coordinate the multiple features of a DW project.
As seen in Figure 2, the methodology starts with the Project Planning phase. Project Management is active through the entire life of the project. The Business Requirements Definition is the central activity, as business requirements drive the whole Data Warehouse project.
After establishing the project foundations (i.e., the business requirements), three parallel tracks should be followed:
Data Track: with three data activities: (1) the Dimensional Modelling; (2) the Physical Design; and (3) the Data Staging Design and Development.
Technology Track: encloses the activities: (1) the Technical Architecture Design; and (2) the Product Selection and Installation (e.g., SGBD, Data Staging tool and Data Access tool).
Application Track: with two activities concerning the End-user Application design and implementation.
Project Planning Business Requirement Definition Dimensional Modeling Product Selection & Installation End-User Application Specification Physical Design Data Staging Design & Development Deployment End-User Application Development Maintenance & Growth Technical Architecture Design Project Management Project Planning Business Requirement Definition Dimensional Modeling Product Selection & Installation End-User Application Specification Physical Design Data Staging Design & Development Deployment End-User Application Development Maintenance & Growth Technical Architecture Design Project Management
Figure 2. Business Dimensional Lifecycle [1] Reaching the Deployment phase corresponds to only 25% of total project effort. Another 25% will be spent on system tests and additional 25% should be dedicated to iterative correction and validation procedures to assure the quality of the DW data contents. The remaining 25% will be spent on Maintenance and Growth activities.
2.1 Project Planning and Management Phases Project Planning and Management are naturally quite similar to homonymous phases in traditional software development processes. As usual, the main activities consist in defining, planning and managing all project tasks.
Kimball starts Project Planning with a test, called the
Readiness Litmus Test [1], to evaluate the organization’s
receptiveness to a DW. The existence of one (or more) strong business management sponsor in charge of the project is the most critical factor when assessing the readiness to a DW, for a number of reasons. Since DW projects tend be expensive with rising maintenance and growth costs, a strong sponsor and a solid financial return are indispensable conditions to sustain a long term economic power. The DW may be used to respond to critical business requirements. Some business motivations that may be the driving force for an organization to adopt a Data Warehousing strategic plan are [1]: (1) a highly competitive and ever-changing market; (2) an internal crisis; (3) a strategic vision of a potential marketplace opportunity; and (4) integration problems inherent to acquisition strategies. The success of a DW also depends on a joint effort and shared responsibilities, between the business management and the IS team. Most successful DWs are built by organizations in which fact-based decision making is encouraged and rewarded. On the contrary, in an organization where managers base their decisions on their ideas/opinions (“gut-feelings”), pushing information and analysis to a secondary place, the readiness for a DW is highly questionable. Finally, technical feasibility issues should be analysed, in particular regarding: (1) data availability; (2) ease of development and deployment; and (3) resource availability and team experience.
Project Scope
The definition of the project scope should be based on business requirements and not on time constraints. Kimball
suggests the following five guidelines to determine the preliminary scope during the Project Planning phase:
The scope should be defined as a joint effort of IS and Management team representatives;
The initial scope of a DW project should have an impact in the organization (i.e., there must be some added-value to the business, by addressing a well-defined business requirement), while being feasible. Data Warehousing should start with small initiatives, since it is meant to have an iterative development process;
The project should be initially focused only on one business process, supported by data from a single source system. The Data Staging development effort is estimated to grow exponentially with each additional major source system.
The initial number of end users should be limited (e.g., to 25 users);
The success criteria of the project should be identified as soon as the scope is defined.
Project Management
Managing a DW project implies the following activities: (1) to maintain the Project Plan and Project Documentation; (2) to manage the scope; and (3) to elaborate a Communication Plan to manage user expectations.
Maintaining the Project Documentation is mandatory in Data Warehousing, due to the unending nature of this kind of projects. Nowadays, since it is quite difficult to maintain unchangeable development teams, the existence of detailed documentation will ease the integration of newcomers in the project.
Change is inevitable in DW projects! This is not due to poorly defined business requirements but to the impossibility to anticipate all user needs and the variations in the marketplace that may impact on the business. Today’s market is a turbulent one, where mergers and acquisitions of enterprises are common events. Kimball considers a change any issue resolution that impacts in the project schedule, budget or scope [1]. Changes should be formally documented and broadcasted to the users, in order to readjust their expectations.
2.2 Business Requirements Definition
Business requirements should have an impact on every DW project area. The starting point of the Requirements Business Definition phase is the set of business users. The team responsible for the Requirements Process should start by talking to business users, to understand their jobs, goals and challenges and particularly “how do they take their
decisions”. In parallel, Data Audit interviews should start
with the “data gurus” of the organization, those crucial elements in the Informatics Department with a deep
knowledge of data. The single purpose of Data Audit interviews should be the systematic exploration of the data source systems. The reality of the organizations’ data should be identified, namely whether there is data to support the analysis of the user’s requests, and start assessing the quality of data.
The requirements capture methodology is based on interviews and facilitating sessions. Kimball provides different sets of key-questions, tailored to the interviewer’s profile. These questions were found extremely useful when applied to the interviews of the SADIA project. The selection of the interviewers is crucial. One should start by interviewing business users horizontally across the organization, embracing other groups beyond the “target” group to be addressed by the DW. The objective is to gather a global vision of the organization’s common vocabulary, ensuring the data integration process over time, and therefore avoiding the development of stovepipes. These interviews should also address a vertical representation of the target business area. The Executive Business Management staff detains the high-level strategy and an overall vision of the business. However, it is imperative to go down the hierarchy to the Middle Managers, who are the key players for the translation of the high-level strategies into the real business tactics. Middle Managers also have a realistic perspective of the company’s strategy concerning information or knowledge management. At the base of this hierarchy, Business Analysts from the target business area possess a detailed and practical know-how concerning the use of the organization’s information. The interviews phase is the right moment to start defining the terminology of the project. The exact definition of this terminology will have a huge impact on the grain and dimensionality of the data model. Issues of vocabulary standardization typically emerge as we conduct interviews across departments in the organization. Vocabulary inconsistencies should not be resolved during interviews. The best approach is to host a facilitating session among the decision makers of different departments.
Business requirements establish the foundations of the project that enable to execute the three parallel tracks: Data Track, Technology Track and Application Track.
2.3 Data Track Dimensional Modelling
Dimensional Modelling is a logical design technique, used in Data Warehouses, which is an alternative to Entity-Relationship (ER) modelling. A dimensional model contains the same information as an ER model but stores data in a symmetric “star-like” structure optimized for different design goals [1,5]: user understanding, query performance and resilience to change. A dimensional model is composed of one table with a multipart key – the fact table – and a set of smaller tables – the dimensional tables. Each dimensional table is connected to the fact table by a single-part primary key that corresponds to one of the multipart key components.
Fact tables contain the business measurements or facts, whereas dimensional tables contain many textual attributes that will be used as constraints in DW queries.
There are three types of measures or facts: (1) fully additive; (2) semi-additive; and (3) non-additive. Fully additive facts are the most useful since they can be meaningfully summarized across any dimension. Semi-additive measures can only be summarized across some dimensions (for example, levels such as inventory quantities or account balances that cannot be summarized over time). Non-additive measures (e.g. ratios) cannot be summarized at all. The solution is to break the non-additive measure into its fully additive components and store them in the fact table.
The Dimensional Modelling activity starts with the definition of the DW Bus Architecture matrix [1] that displays the key business processes versus the candidate analysis dimensions. This top-down perspective matrix must be conciliated with a bottom-up data source analysis in order to adjust the information needs to the reality of available data. Then, the 4-step method [1] for the design of individual fact tables should be applied to each feasible business process or Data Mart selected for implementation. The 4-step method to design a fact table encloses the following steps:
Step 1: Choosing the Process. This step consists of
identifying the Data Mart’s subject area.
Step 2: Choosing the Data Mart Grain. The grain is the level
of detail at which each row in a Fact Table is recorded. Choosing the grain means identifying exactly what a single Fact Table record represents.
Step 3: Identifying and Conforming the Dimensions. Any
dimension that takes a single value in the presence of the grain is a good candidate to be selected for the Data Mart. Conforming dimensions imposes the requirement that the same dimension (e.g., the Customer or Product Dimension) in two different Data Marts be defined precisely in the same way.
Step 4: Choosing the Facts or Measures. The selection of
facts should be as rich as possible within the context of the declared grain. All facts must be expressed at the level previously defined for the grain. In addition, the facts should be as additive as possible.
In [6,7] Kimball enhances the 4-step method. The new proposed steps for logical dimensional modelling comprise the following activities:
Step 5: Storing Pre-calculations in the Fact Table. Some
values can be obtained from existing facts (e.g., the net price of a product can be derived from the product price minus the allowances and discounts [7]). Nevertheless, it may be interesting to pre-calculate and explicitly materialize some of them in the fact table. Although redundant information is stored, this decision avoids mistakes (for example, the user applies the wrong formula) and improves performance.
Step 6: Enriching the Dimension Tables. The grain decision
in step 2 also determines the grain of each dimension table. The goal in this step is to be as comprehensive and wordy as possible. At least 50 textual attributes should be identified for important dimensions, such as Customer or Product. Dwelling on data sourcing or data quality details should be avoided since these problems will be solved in the Data Staging Design and Development phase.
Step 7: Choosing the Duration of the Database. The business
area determines the amount of historical information to store in the Data Mart, i.e., the duration of the fact table. For example, insurance companies usually store seven or more year-old facts. Special attention must be taken in this case since older data records tend to be more difficult to interpret.
Step 8: The Need to Track Slowly Changing Dimensions.
During the DW lifecycle changes in data occur, for example a customer address change. There are three mechanisms to handle and integrate these changes into the DW schema: Type 1, 2 and 3. Type 1 is only used to correct errors since it overwrites the dimension record with the new values. Type 2 creates a new record to store the new value, and is the most used mechanism. Type 3 creates an “old” attribute in the dimension record to store the old value. This mechanism is used less frequently, for “soft changes” situations, where both the old and the new values must be supplied.
Physical Design
This phase deals with the physical database design issues that must be defined in order to support the logical design. Some modelling activities addressed in this phase are: (1) Definition of Aggregates; and (2) Definition of Indexing and Partitioning Strategies.
Aggregates are fact tables with some level of summarization, derived from the most granular or elementary fact table of the Data Mart. Aggregates are used in DW to improve query performance.
Data Staging Design and Development
This activity is typically the most underestimated within DW projects. Yet, it is a critical task consuming a large amount of project resources. Data Staging Design involves three main steps: (1) Extraction; (2) Transformation; and (3) Load, known as the ETL process.
The Extraction process extracts data from the source systems. Data must then be transformed, using Data Cleaning techniques/algorithms to overcome data quality problems. The final process loads “cleaned” data into the DW dimensional framework. Two ETL processes must be defined. The first one handles the initial migration of data from source systems, populating the DW for the first time. The second one concerns the periodical and incremental loads of data.
2.4 Technology and Application Tracks
The Technology Track encompasses two activities: (1) Technical Design Architecture; and (2) Product Selection and Installation. The design of the DW technical architecture is essentially driven by business requirements, the current technological environment and the technical directions planned for the organization DSS strategy.
The third parallel track, the Application Track, is composed of two activities: (1) End-User Application Specification; and (2) End-User Application Development. The first activity deals with the definition of a set of standard end-user applications, like report templates and required formulas used in calculations. The second activity involves the metadata tool configuration and the development of specified reports.
3 Project Planning and Management
The SADIA project has one strong sponsor: the President of the CIIST. Since the Board of Directors also supports the project, the partnership between IS and Business has been successful. The business motivation that drives the project is the ability to improve the teaching quality provided by the Faculty, since the number of students (applicants) is decreasing and Faculties struggle to attract the most brilliant students.
The Board of Directors is convinced that SADIA will allow them to base their decisions on factual data and, more importantly, that the system will allow them to start creating a culture of decision-making based on factual data.
4 Business Requirements Definition
The SADIA development team interviewed the key business users, i.e., the School’s Pedagogical Council (several members of the Executive Commission including the President) and the School’s Office for Studies and Planning (GEP, standing for Gabinete de Estudos e Planeamento in Portuguese). In parallel, data “gurus” were also interviewed to identify the reality of the School’s data. The following deliverables were produced [8]: (1) the Requirements Specification Document that includes a detailed analysis of GEP Studies, a summary of all interviews and the analysis of two source systems – the data model reengineering of the current students enrolment application (managed by CIIST) and the SIGLA database (managed by GEP); and (2) the Organizational Model of the School, enclosing the static organization of IST and the business processes modelling. The application of Kimball’s methodological proposals to the SADIA project was found extremely useful. In particular, the interview questionnaires [1] for business users (managers and analysts) and for Data Auditing produced excellent results for capturing business requirements. However, this methodology lacks a notation to detail business requirements. Due to the SADIA team experience in Software Engineering, UML (Unified Modelling Language) [3] was selected as the
language to model business processes. The identified SADIA business processes are represented as UML business use cases, illustrated in Figures 3 and 4.
Provide student admission data Ministery of
Education
Evaluate teaching reports
Evaluate the results of the Pedagogical Assessment Inquiries Pedagogic
Council
Ministery of Education Send DIMAS Application Statistics
Manage undergraduate student enrolments
Manage undergraduate degree curriculum by academic year
Manage graduation student enrolments Computer
Centre (CIIST)
SADIA
Figure 3. SADIA Business Processes
Clearly, this represents a major system that cannot be implemented all at once. We have selected the following business processes or major subject areas to be supported by the first release of the SADIA system:
Elaborate IST Student Admission Study Elaborate Student Performance Study
Elaborate Undergraduate Degree Self-assessment Study These studies have well-defined and documented business requirements. The scope of the first release of the SADIA system will have an impact on the Pedagogic Assessment of the School.
Some statistics of the Student Admission and Student Performance studies are also required by the Undergraduate Degree Self-assessment study. The SADIA system is focused on the following subset of business processes required by the Undergraduate Degree Self-assessment study: (1) IST Student Admission; (2) Undergraduate Degree Performance Evaluation; (3) Course Performance Evaluation; and (4) Student Performance Evaluation.
For each of the selected processes the corresponding business indicators were identified. From this point forward, the IST Student Admission process is used to illustrate all activities already performed in the SADIA project. Business indicators were identified through the analysis of existing School documentation and user interviews. Section 4.1 presents the
description of the Student Admission process and a few user queries are exemplified in Section 4.2.
Elaborate Study Degree Assessment Commission Portuguese Universities Foundation (FUP) Professional Engineers' Association Scientific Council Degree Assessment Commission Degree Coordinator Board of Directors Generic Public Elaborate undergraduate degree
self-assessment Study
Elaborate undergraduate Degree Accreditation Study
Calculate ETIs
Manage Teaching Reports Elaborate 1st year students
social-economic caracterization
Elaborate final year students caracterization Study
Elaborate School drop-out rate Study
Elaborate Student Monitoring Study Elaborate Student Performance
Study Elaborate IST Student Admission
Study GEP SADIA (cont.) Elaborate Study Degree Assessment Commission Portuguese Universities Foundation (FUP) Professional Engineers' Association Scientific Council Degree Assessment Commission Degree Coordinator Board of Directors Generic Public Elaborate undergraduate degree
self-assessment Study
Elaborate undergraduate Degree Accreditation Study
Calculate ETIs
Manage Teaching Reports Elaborate 1st year students
social-economic caracterization
Elaborate final year students caracterization Study
Elaborate School drop-out rate Study
Elaborate Student Monitoring Study Elaborate Student Performance
Study Elaborate IST Student Admission
Study
GEP
SADIA (cont.)
Figure 4. SADIA Business Processes (cont.) 4.1 The IST Student Admission Process
The IST Student Admission process for each academic year may be analysed from three perspectives: (1) the overall admission process of the School; (2) the student admission process for each undergraduate degree of the School; and (3) the admission process for a particular applicant.
Overall Admission Process of the School
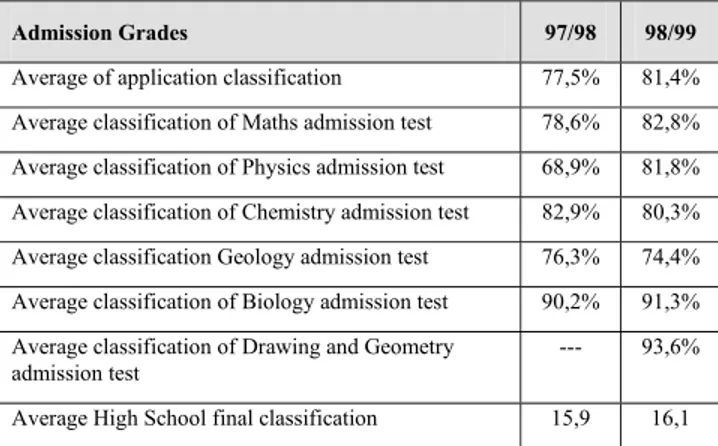
The global business indicators that characterize the admission process of the School for an academic year are displayed in Table 1. The Admission process also includes the analysis of the admission average classification of all admitted students for an academic year, represented in Table 2.
Global Business Indicators 97/98 98/99
Number of vacancies 1250 1300
Total number of applicants 8457 7184
Occupation rate 100% 100%
% admissions from the General Admission Contingent
Contingent
Table 1. Global business indicators for the IST Student Admission process
The admission process corresponds to the fulfilment of the number of vacancies by applicants, depending on their application classification and on their application option. Applicants are ordered according to their ranking, which is currently defined as 50% of the High School final classification plus 50% of the classification obtained in the specific set of admission tests required by the degree.
Admission Grades 97/98 98/99
Average of application classification 77,5% 81,4%
Average classification of Maths admission test 78,6% 82,8% Average classification of Physics admission test 68,9% 81,8% Average classification of Chemistry admission test 82,9% 80,3% Average classification Geology admission test 76,3% 74,4% Average classification of Biology admission test 90,2% 91,3% Average classification of Drawing and Geometry
admission test
--- 93,6%
Average High School final classification 15,9 16,1
Table 2. Average admission grades of all students admitted to IST.
Student Admission Process for each Undergraduate Degree
Table 3 presents an analysis map illustrating the Student Admission Business Indicators calculated for each undergraduate degree for an academic year. In order to assess the quality of the admitted students, some admission classifications were also calculated (see Table 4). The values represented in Tables 3 and 4 refer to the Student Admission process to the Electrical Engineering undergraduate degree (LEEC, in Portuguese) in 1997/98 and 1998/1999.
The geographic origin of students is also an important issue regarding the characterization of the admitted students. The business indicator underlying this analysis is the Number of Applicants per Geographic District.
Student Admission Business Indicators 97/98 98/99
Number of vacancies 250 250
Number of applicants 982 961
Number of first option applicants 401 395
Ratio applicants/vacancies 3,9 3,8
Ratio first option applicants/vacancies 1,6 1,6
Occupation rate 100% 100%
% admitted from the General Admission Contingent
92,8% 94%
Table 3. Student admission analysis map for each Undergraduate Degree
Admission Grades 97/98 98/99
Minimum application classification 69,3% 74,4%
Average of application classification 77,3% 82,7%
Average classification of Maths admission test 79,0% 85,0% Average classification of Physics admission test 69,5% 83,7% Average High School final classification 16,1 16,2
Table 4. Minimum and average admission gradesof the admitted students in the LEEC degree Admission Process for a particular Applicant
The performance of an individual student in an Admission Contest is measured in terms of his/her application classification, the order of entrance of the applicant, the High School final classification, and the classifications obtained in the specific admission tests he/she performed.
4.2 User Queries
Another result of the interviews performed during the Business Requirements Definition Phase is a set of typical user analysis queries. Consider the following three questions related to the Analysis of the Admission for an Undergraduate Degree in a particular academic year (see [8] for the complete set of user queries):
Q1: Number of admitted students per Admission Contingent? Q2: Number of students that did not registered?
Q3: Distribution of admitted students by application option?
5 Dimensional Modelling
The Dimensional Modelling activity started with the definition of the DW Bus Architecture matrix [1], represented in Table 5. This matrix displays the key business processes versus the candidate analysis dimensions. Then, we followed the enhanced 4-step method previously described in Section 2.3. Business Processes TIM E STUDENT AD MISSIO N G E OGRAPHY CO UR SE D E G R EE DEPARTM E N T
IST Student Admission X X X X
Undergraduate Degree Performance Evaluation X X X X Course Performance Evaluation X X X X Student Performance Evaluation X X X X X
Table 5. DW Bus Architecture Matrix Step 1: Choosing the Process
The admission process of potential students is modelled as a specific Data Mart, with one accumulating snapshot fact table, as suggested in [4]. This kind of fact tables is suitable for short-lived processes, such as the admission pipeline, with well-defined beginning and ending dates and a set of standard milestones.
In the admission process to an undergraduate degree, the potential students (our clients!) progress through a set of admission milestones. The process is similar to a funnel, where many candidates enter the pipeline, but few reach the final milestone. GEP considered only the following milestones: application, admission and registration. In the future, additional milestones considered relevant may be added to this model.
Step 2: Choosing the Data Mart Grain
The grain of the accumulating snapshot to track the applicant’s lifecycle is one row per potential student [4]. This granularity represents the lowest level of detail captured when the student enters the pipeline. The candidate’s state is updated in the fact table row with the information collected while he/she progresses through the application, admission and registration milestones.
Step 3: Identifying and Conforming the Dimensions The candidate dimensions defined for the IST Admission Data Mart are: Time (including the academic year hierarchy), Student (encompassing the candidates’ attributes), Admission (including admission types and contingents), Geography, Degree and Department.
The Geography dimension was isolated from the Student dimension to enable more intuitive geography-driven analysis. Assuming that the natural evolution of the SADIA system will be the implementation of a Data Mart to support the decisions of the Scientific Council, a conformed Geography dimension will be the most helpful.
Step 4: Choosing the Facts or Measures
As stated in Section 2.3, there are three types of measures or facts: (1) fully additive; (2) semi-additive; and (3) non-additive. Apart from this classification, in the SADIA project we have identified elementary aggregated and derived measures or facts [10]. Elementary facts designate the fundamental or key business measures. Aggregated facts are measures with some level of aggregation. Derived facts are those measures calculated from the values of other elementary or aggregated measures.
The elementary measures considered for the IST Student Admission fact table are presented in the star schema model of Figure 5. Dates (e.g., the Application Date) are treated as
role-playing dimensions, using surrogate keys to overcome
the inevitable unknown dates when we first load the row. The measures applicant, admitted and registered are factless (i.e., with values 0 or 1). This choice represents a design optimization to facilitate the frequent counting of the number
of students in each of the process milestones, that is, the number of applicants, admitted and registered students.
Time_Dimension skTime Student_Dimension skStudent Degree_Dimension skDegree StudentSex_Dimension skStudentSex StudentAge_Dimension skStudentAge AcademicYear_Dimension skAcademicYear Admission_Dimension skAdmission Geography_Dimension skGeometry Student_Admission_Fact_Table skAcademicYear skAdmission skStudent skStudentSex skStudentAge skDegree skGeographyBirthPlace skGeographyResidence skApplicationDate skAdmissionDate skRegistrationDate applicant (0|1) admitted (0|1) registered (0|1) seriationGrade MathsAdmissionTestGrade PhysicsAdmissionTestGrade ChemistryAdmissionTestGrade BiologyAdmissionTestGrade GeologyAdmissionTestGrade DrawingGeometryAdmissionTestGrade HighSchoolGrade OrderOfEntrance
Figure 5. IST Student Admission Star Schema Step 5: Storing Pre-calculations in the Fact Table
In order to identify the set of pre-calculations to store in the fact table, we gathered all derived and aggregated facts. In practice, we have anticipated the beginning of one step of the Physical Design, i.e., the definition of the Aggregation Strategy. This modelling step will be described in Section 6. Step 6: Enriching the Dimension Tables
In this step, dimension tables are enriched with all the attributes identified for analysis constraints.
Time Dimension and Academic Year Dimension
The Time Dimension is based on the traditional Time Dimension proposed by Kimball [1]. Initially, the academic year was considered a parallel hierarchy inside the Time Dimension similar to the fiscal year hierarchy, as represented in Figure 6. However, since the majority of the user queries intended to analyse data for a particular academic year and semester, a new dimension for the Academic Year was created. Another argument for this decision is related to the navigation in aggregated models (that will be presented in the following sections). These models are meaningful only in the context of one Semester/Academic Year and not for a particular day (i.e., the grain of the Time Dimension).
Figure 6 represents the detailed diagram produced for the Time Dimension. This kind of diagram highlights dimension hierarchies and the expected cardinality of each hierarchy level. In the diagram, the relationships between attributes specify the possible navigation or drill paths. Each record in the Time Dimension has a surrogate key generated sequentially from a fixed reference date (e.g., the 1st of
Figure 6. Detailed diagram of the Time Dimension
Degree Dimension
Currently, IST offers twenty-two 5-year-long undergraduate degrees, some of them with branches or profiles of specialization. The partition into degree years is common to all undergraduate degrees. Figure 7 represents the detailed diagram of the Degree Dimension. The set of attributes considered for this dimension is listed in Table 6.
Degree Degree Year (22) (5) Branch / Profile Degree Degree Year (22) (5) Branch / Profile
Figure 7. Detailed diagram of the Degree Dimension
Department Dimension
The Department Dimension exhibits one hierarchy partitions departments into sections. This dimension still needs to be conformed, but we need to model the Scientific Council business processes to accomplish this task. In this version of the SADIA system the attributes considered for the Department Dimension are: (1) Department name; (2) Department acronym; (3) Head of the Department; (4) Department Section name; (5) Department Section acronym; and (6) Department Section Coordinator.
Dimension Attributes Example Data
Degree Name Undergraduate Degree in
Electrical Engineering and Computer Systems
Degree Acronym LEEC
Degree year 2
Branch/Profile Control and Robotics
Branch/Profile acronym CR
Degree Coordinator Professor XZ
Maths admission test Required
Physics admission test Required
Chemistry admission test Not required
Geology admission test Not required
Biology admission test Not required
Drawing and Geometry admission test Not required Coordinating Department #1 3 Coordinating Department #2 1 Coordinating Department #3 1 Coordinating Department #4 1 Coordinating Department #5 1
Table 6. Attributes of the Degree Dimension
Student Dimension
The Student Dimension corresponds to the traditional DW Customer Dimension. Therefore, some Customer Relationship Management (CRM) techniques can be applied to the design of this dimension. The basic idea of CRM is to determine an integrated and unique view of each customer, enabling the establishment of long-lasting and profitable business relations [4]. CRM objectives are not confined to maintain the business relations with the most profitable customers of the organization. It is also important to turn current non-profitable customers into profitable ones. From the point of view of a University it is extremely important to develop “attraction mechanisms” to capture the best students in the market, since the number of applicants is declining. By defining an integrated and unique view of the student (as a customer or client!) the University may develop mechanisms to maintain profitable relations with the students. Moreover, it becomes possible to identify early on situations of risk, e.g. a student with low classifications, and act before the probable drop-out occurs.
The first CRM modelling mechanism used in the Student Dimension concerns the parsing of names and addresses. The way operational systems deal with customers’ names and addresses is usually too simplistic to be useful in Data Warehousing [4]. The most common design with generic columns for names (name-1 to name-3) and addresses (address-1 to address-6) is useless for analyzing and segmenting the behaviour of customers. Thus, instead of using generic fields, names and addresses should be divided into their elementary components. Attributes should be standardized, e.g., “St” should be replaced by “Street”. It is also necessary to verify the correctness of information, for instance, checking if the localor district of a postal code is correct. This is a complex task since Portuguese names and addresses are usually strongly unstructured. In the current version of the SADIA system we did not tokenize and standardize the address attributes.
Table 7 presents the attributes of the Student Dimension. The more detailed is the description of our customers¸ the more
Calendar Year
Calendar Month
Day
Academic Year
Academic Semester
Day of the Week
(365 ) (1 ) (12 ) (7 ) (1 ) (2 ) Grain of the Time Dimension Academic Year Calendar Year Calendar Month Day Academic Year Academic Semester
Day of the Week
(365 ) (1 ) (12 ) (7 ) (1 ) (2 ) Grain of the Time Dimension Dimension
robust the Student Dimension will be and consequently more interesting analysis become possible.
Some attributes of the Student Dimension were modelled as mini-dimensions, namely gender and age. The creation of a new Student-Gender Dimension enhances the performance of the user queries, since most of them impose constraints on the student gender. The Student-Age Dimension is a design optimisation that enables the specification of several age ranks, used in standard user reports, without over sizing the Student Dimension.
Geography Dimension
The Geography Dimension has been enriched with the Portuguese Administrative Geographic Divisions (NUTS that stands for Nomenclatura das Unidades Territoriais para fins
Estatísticos, in Portuguese) standardized by the National
Statistic Institute [9]. These attributes will enable more intuitive geographic-related analysis, such as: “What is the
influence of the origin district of the students in the application classification?” or “From which regions in Portugal do most of the IST students come from?”
Steps 7 and 8 are currently being defined.
6 Physical Design
As explained in Section 2.3, Aggregates are fact tables with some level of summarization, derived from the Data Mart most granular fact table. The elementary fact table, presented in Figure 5, corresponds to the student admission fact table. Each aggregated fact table should be designed in a different physical table, since facts of different grains should not be mixed in the same table [4].
Dimension Attributes Example Data
Salutation Sra.
Informal name Elsa
Formal name Sra. Elsa Cardoso
First and middle names Elsa Alexandra Cabral da
Rocha
Surname Cardoso Title Engineer
Address Rua XPTO de Baixo, Lote
31, 2º Esq
Local Sassoeiros
Postal code (4 digits) 2775
Postal code (3 digits) 785
Complete postal code 2775-785
Postal code local Carcavelos
Home phone 211111111
Mobile phone 911111111
Email Elsa.cardoso@inesc-id.pt
Alternative email Elsa.cardoso@iscte.pt
Web site www.esw.inesc-id.pt/~eac
Date of birth 29-12-1970
Year of birth 1970
Name of the father Manuel Cardoso
Name of the mother Maria Cândida Rocha
Nationality Portuguesa
Country of birth Moçambique
Civil state Single
Identification document number 11111111
Identification document type Bilhete de Identidade Identification document emission locality Lisboa Identification document expiration date 02-08-2006 Fiscal number 222222 Application Option 1
Table 7. Attributes of the Student Dimension Table 8 presents the set of derived and aggregated facts identified for the Admission process. The users were questioned about the real usage pattern of these facts. The facts were then parameterised in terms of usage frequency and required computation effort. This classification (from 1 to 5) was the basis for determining whether each fact should be stored.
Based on this study, we have created a new aggregated fact table for the Admission Process for an Undergraduate Degree. The grain of this fact table, presented in Figure 8, is one record for each undergraduate degree offered by IST per academic year. STUDENT ADMISSION PROCESS TI ME AC AD EMIC YEAR STU D EN T ST UDE N T-GE N D ER STU D EN T-AGE GEOGRAPH Y D EG R EE D EPAR TMEN T C O U R SE AD MI SSION U SAG E F R EQ U EN C Y COMPU TTATI ON E FFO RT INCL UD E? ) No of candidates X X X X 1 2 Y No of admitted students X X X X 1 2 Y No of registered students X X X X 1 2 Y No of first option candidates X X X X 1 2 Y
Minimum application classification X X X X 1 2 Y Maximum application classification X X X X 1 2 Y Average application classification X X X X 1 3 Y Average classification of
Maths Admission Test X X X X 1 3 Y
Average classification of
Physics Admission Test X X X X 1 3 Y
Average classification of
Chemistry Admission Test X X X X 1 3 Y
Average classification of
Geology Admission Test X X X X 1 3 Y
Average classification of
Biology Admission Test X X X X 1 3 Y
Average classification of Drawing and Geometry
Admission Test
X X X X 1 3 Y
Average High School final
classification X X X X 1 3 Y
Occupation rate = (No of admitted students/ No of
vacancies)
X X X X 1 1 N
Ratio No of candidates/ No
of vacancies X X X X 1 1 N
Ratio No of first option candidates/ No of
vacancies
X X X X 1 1 N
No of unregistered students= (No of admitted
– No of registered)
X X X X 1 1 N
Table 8. Aggregated and Derived Facts Validating the Dimensional Model
Although the methodology does not preclude a validation phase, it is fundamental to check if the logical and physical models completely respond to user analysis queries. The validation process of the dimensional model has been performed, query-by-query, using validity matrixes built with a Microsoft-Excel spreadsheet. Degree_Dimension skDegree degreeName degreeAcronym degreeYear branch_profileName branch_profileAcronym degreeCoordinator mathsAdmissionTest physicsAdmissionTest chemistryAdmissionTest geologyAdmissionTest biologyAdmissionTest drawingGeometryAdmissionTest coordinatingDepartment#1 coordinatingDepartment#2 coordinatingDepartment#3 coordinatingDepartment#4 coordinatingDepartment#5 AcademicYear_Dimension skAcademicYear Admission_Dimension skAdmission Degree_Admission_Aggregate_Fact_Table skDegree skAdmission skAcademicYear numberVacancies numberVacanciesGeneralAdmissionContingent numberVacanciesAzoresContingent numberVacanciesMadeiraContingent numberVacanciesMacauContingent numberVacanciesEmigrantContingent numberVacanciesMilitaryContingent numberVancanciesDeficientContingent numberOfApplicants numberOfAdmitted numberOfRegistered numberFirstOptionApplicants minimumSeriationGrade maximumSeriationGrade averageSeriationGrade averageGradeOfPhysicsAdmissionTest averageGradeOfChemistryAdmissionTest averageGradeOfBiologyAdmissionTest averageGradeOfGeologyAdmissiontTest averageGradeOfDrawingGeometryAdmissionTest averageHighSchoolGrade Department_Dimension skDepartment departmentName departmentAcronym headOfDepartment departmentSectionName departmentSectionAcronym departmentSectionCoordinator
Figure 8. Aggregated Model for the Admission Process for a Undergraduate Degree
7 Conclusions
This paper presented the SADIA system [8], which is the Academic Information Decision Support System of Instituto Superior Técnico. We have defined the business requirements and reported on the dimensional modelling achievements concerning the first release of the DSS.
Apart from validating the dimensional model, the key business users have also approved the design decisions. We also concluded that users completely understood star schema models, since they easily realized the business advantages of decision support systems.
Current ongoing work encompasses the Technology and Application tracks. A business intelligence tool will be used to develop the end-user application. Future work includes the deployment of the first SADIA prototype.
Acknowledgements
The authors would like to thank José Barateiro for his valuable comments to this paper.
References
[1] Kimball, R., and Reeves, L., and Thornthwaite, W. The Data Warehouse Lifecycle Toolkit. John Wiley & Sons Inc., New York, 1998.
[2] Silva, A. Rito. The FENIX Project. Technical Report. IST, 2002.
[3] Booch, G., Rumbaugh, J. and Jacobson, I. The Unified Modeling Language User Guide. Addison-Wesley, 1999.
[4] Kimball, R. and Ross, M. The Data Warehouse Toolkit – the Complete Guide to Dimensional Modeling, 2ª Ed. John Wiley & Sons Inc., 2002.
[5] Kimball, R. A Dimensional Modelling Manifesto. DBMS online, Data Warehouse Architect, 1997.
[6] Kimball, R. Letting the Users Sleep, Part 1. DBMS online, Data Warehouse Architect, December 1996. [7] Kimball, R. Letting the Users Sleep, Part 2. DBMS
online, Data Warehouse Architect, January 1997. [8] Cardoso, E. Sistema de Apoio à Decisão para a
Informação Académica do Instituto Superior Técnico. Master Thesis, 2003 (in Portuguese).
[9] INE, Instituto Nacional de Estatística. Nomenclaturas – Divisão Administrativa, 2002 (in Portuguese). http://www.ine.pt/prodserv/nomenclaturas/refter/div_ad min.htm
[10] Soares, J. Soluções de Data Warehousing – Fundamentos Teóricos, Metodologias e Práticas de Implementação. Master Thesis, 2002 (in Portuguese).
![Figure 1. Basic Elements of a Data Warehouse [1]](https://thumb-eu.123doks.com/thumbv2/123dok_br/18373915.891949/1.918.493.849.553.770/figure-basic-elements-data-warehouse.webp)
![Figure 2. Business Dimensional Lifecycle [1]](https://thumb-eu.123doks.com/thumbv2/123dok_br/18373915.891949/3.918.105.453.113.313/figure-business-dimensional-lifecycle.webp)