ISSN: 2333-6412 (Print), 2333-6420 (Online) Copyright © The Author(s). All Rights Reserved. Published by American Research Institute for Policy Development DOI: 10.15640/rcbr.v4n2a3 URL: http://dx.doi.org/10.15640/rcbr.v4n2a3
Organizational Social Capital Scale Based On Nahapiet and Ghosal Model:
Development and Validation
Antonio Martinez Fandiño
1, Catarina Maria Valente Antunes Marques
2, Rui Manuel Pereira de
Menezes
3& Sónia Margarida Ricardo Bentes
4Abstract
The goal of this work is to develop and validate a scale to identify workers' behaviors as well as those of organizations, and to understand how they develop and build enterprise competitiveness through organizational social capital, a complex network of relationship that is critical to business success. For this the present theories were mapped out to identify the similarities and differences within social capital, focusing on organizational social capital. With this background a Nahapiet and Ghosal three dimensional model was chosen as the most suitable construct with which to create the instrument. All methodological research steps for behavioral instrument creation were taken into account. The questionnaire created was refined and validated for semantic and content validity, then it was tested using statistical tools for items reduction through Exploratory Factor Analysis to refine the instrument. The scale was approved in the tests and the findings of this process also led to the conclusion that social capital is a one-dimensional construct. Keywords: Organizational Social Capital, scale development, Nahapiet and Ghosal Model, Likert scale, scale validation.
1. Introduction
Social Capital in the area of business has emerged as the focus of many researches since technology and innovation created a feedback cycle in which one fosters the other, creating the basis for global market competition through telecommunications and information systems upon which industrial society has become dependent. The logic behind these processes has its foundation in how human beings organize themselves to satisfy their needs through the division of labor since their first social groupings. Arie De Geus in the eighties of last century states in his book “The Living Company” a concept that elucidate the nature of organizations as a community of human beings, which supports the value of social capital as a critical asset. He studied twenty seven centenarian companies and has found that companies which have certain similar characteristics with live systems are the most longevous. Mainly because they have a strong notion of community and collective identity, built from common values, a community where members know that they are supported by each other, interacting with the external environment which it is part of.(fitted in) , tolerating new comers and new ideas (Capra, 2005). The sum of these is a capacity to learn and adapt to challenges of the environment through their collective capacity, created from the relationship between their members.
1 Rural Federal University of Rio de Janeiro - UFRRJ, Department of Accounting Sciences and Management, Rodovia BR 465 -
Km 7 - Campus Universitário, Seropédica - RJ, 23851-970, Rio de Janeiro – RJ, Brasil. tel: +55 21 2682 1701, [email protected]
2 ISCTE-IUL, Department of Quantitative Methods for Management and Economics, Avenida das Forças Armadas, 1649-026,
Lisbon, Portugal. tel: +351 21 790 30 04, [email protected]
3 ISCTE-IUL, Department of Quantitative Methods for Management and Economics, Avenida das Forças Armadas, 1649-026,
Lisbon, Portugal. tel: +351 21 790 30 04, [email protected]
4 ISCAL – Lisbon Institute of Management and Accounting, Avenida Miguel Bombarda, 20, 1069–035, Lisbon, Portugal. tel:
The research aim presented in this paper is to create a scale to identify and measure the gaps and strengths of social capital in organizations to make management decisions possible. For this in the second paper’s section is synthesized the theoretical background, and discussions about social capital which support the theoretical construct definition. In the third section is described the methodology process to define sampling and the questionnaire. In the fourth is unveiled a detailed scale development process. In the fifth is presented the scale validation steps, and lastly the conclusions and discussions.
2. Social Capital
Social capital has been discussed by many scholars since the seminal works of Bourdieu (1986) and Coleman (1988, 1990), highlighting the concerns about cohesion in social dynamics as an important social resource. According to them social capital is a reciprocal expectation of economic benefits among individuals and groups through cooperation. From this, the role of social capital has being studied from different perspectives since economic performance, to human capital development, as well regions and countries development (Nahapiet and Ghoshal, 1998), all of them generating commonalities and at the same time a variety of definitions, because of the broad scope that the subject encompasses: complex network connections between social and economic perspectives (Robison et al., 2002).
Expanding on this, as social capital is about goodwill created by relationships from within social networks, it can be internal, inside a group; persons with interactions having a sense of unity, sharing similar characteristics which define boundaries, or external with other groups (Reagans and Zuckerman, 2001). It means that social relations happen in different levels from micro level (individual), to meso (group) and macro (societal) all of them with the purpose of meeting the different needs that individuals, groups and regions/nations have, generating thus a socioeconomic dynamics (Kilby, 2002), especially in industrial societies, making it an important variable to understand what are the possibilities for optimization of the organizational work capacity (Inkpen and Tsang 2005; Han, 2006). 2.1 Critical Review
Although, social capital as an organizational asset has gained relevance, there hasn’t been yet a consensus among scholars about its definition. On the other hand, there is not much discussion about its consequence, because human beings, working in net, are the only resource with intelligence and creativity in organizations which depends ever more on them to remain competitive in their markets in the case of private enterprises, or usefulness in case of government organizations as a consequence of complex economic and social challenges which demand constant innovations to adapt to them (Lindgreen et al., 2012).
According to the resource-based view (Black and Boal, 1994), as organizational scholars (e.g., Andrews, 2010; Houghton, Smith, & Hood, 2009; Coleman, 1988), this flow of worker’s interactions to deliver a product is a system resource which propitiates performance, from an individual, to organizational or inter-organizational levels. It is a tradable asset resulting from organizational actors’ actions, which look for mutual socio-economic gains to satisfy their needs.
In this context, the main research perspectives are: structural/relational/cognitive as well as internal/external. The study of these subjects overlaps showing different perspectives of how social networks are built in different circumstances and spheres, from a social unit to an organization or country. In the first group of perspectives, structural is focused on network analysis, it is an impersonal view, understanding how the network configuration is (e.g. it is density, connectivity, hierarchy) and relationship patterns - who is linked with whom and how (Nahapiet & Ghoshal, 1998; Adler and Kwon, 2002; Carmona-Lavado et al., 2010). It describes the linkage among people and/or units. The second and third, relational and cognitive describes the quality of the network, where actors’ feelings towards each other, determining how cohesive the network will be in terms of trust, companionship and a shared sense of vision, which allow cooperative interactions, and the transfer of knowledge among members fostering innovation capabilities and promptness in responding to the environment’s demands (McFadyen and Cannella, 2004).
The second perspective (internal/external) analyses the same aspects looking at the internal and external relations of a group or organization. External relations studies is focused on how and to what degree individuals, groups or organizations link and create other social networks which can give reciprocal benefits such as information, power, making alliances or partnerships due to common interests (Bourdieu, 1986; Portes, 1998).
The internal one focuses on the social relations of organizational actors, and how they tie into other ones, from within their group, and between their group and organization, analyzing norms, common values, feelings and attributes of cohesiveness such as: trust, perceived obligations, a sense of mutual identification, among others that can facilitate communication, cooperation, knowledge exchanges and promote benefits for all participants (Nahapiet & Ghoshal, 1998; Fukuyama, 1995; Putnam, 1995; O’Reilly and Caldwell, 1985).
As the consequence of these different approaches is the existence of lack of consensus among the scholars about what social capital is, affecting so the (ways) to measure it, because most of all measurement definitions don’t clear up if social capital is a social resource, a social product or is an individual attribute, as stated by Macinko (2001) and Kawachi (2004). These conceptual debates about social capital lead to infer based in the evidences presented that as a result of those different perspectives, different kinds of components were identified to understand and analyze social capital, thus different set of indicators are necessary to measure it effectively (Poder 2011, Baum and Ziersch 2003; Cox and Caldwell 2000). Consequently, there is not a measurement instrument that reflects the whole sort of social relationships networks which happens in societies and organizations; in contrary they represent a specific theoretical concept and their outputs are capable to describe particular aspects of social networks, embedded in a social structure (Van der Gaag and Snijders, 2005).
2.2 Construct Justification
Social Capital indicators to be reliable have to express the cohesion and trustworthiness states of a relationship network has through attitudes, expectations and how things happen or should happen inside a certain network (Cox and Caldwell 2000). To translate it without bias and/or missing important aspects of the construct into to a scale, this study has had its background and foundation in a recognized social capital model by peers proposed by Nahaphiet and Ghoshal (1998); because its focus is organizational social capital (internal) and how it promotes the creation of intellectual capital through dimensions, and specified by the model in aspects which allows the creation of approaches to deal with it. These dimensions are: structural, cognitive and relational. The first refers to the organizational structure, patterns of connections among individuals, and the links that form the organizational network. The second is based on components that represent shared knowledge, comprehension and a system of shared symbols (i.e. language, codes and culture). The last is formed by trust, norms and sanctions, duties and expectations, which allow the setting of the other dimensions as it builds the necessary conditions for relationships to exist, as shown in more aspects in the picture bellow.
Figure 1: Dimensions of Social Capital (Ariño, Pastoriza, Ricart, 2008)
This proposition leads to the understanding of the individual’s acting characteristics not only to develop their work but also to use or generate ideas and solutions, that is to say, knowledge, in a work flow setting of an organization. For this process to be possible, it is vital to understand and accept that the pre-requisite of knowledge transmission in the labour reality is good will in the interactions among individuals, in a structure which functions as an environment where exchange encourages relationships among the participants (Davenport and Prusak, 1998; Von Krogh, et al, 2000), for this purpose the present scale was created as a tool to identify it among employees, as well as the conditions offered by the organization for it to happen.
Structural Dimension: Extent to which people in an organization are connected and access to the intellectual capital of others. Relational Dimension: Nature and quality of the connections
among employees; referred as well as generalized trust among individuals.
Cognitive Dimension: Extent to which employees share a common perspective and understanding of how to interact with one another. Referred as well as the willingness of individuals to share collective goals.
Coming to a conclusion, this construct was chosen because it has clearly defined what dimension and their aspects, which allows constructing a scale to measure bonds and good will in organizational realities, to identify gaps and strengths in them to provide information to optimize their organizational capabilities.
3. Methodology
3.1. Scale Development Process
For the development of a scale (or a measurement instrument as it has been mentioned in this article) specific stages should be carried out to guarantee a reliable and valid measure (DeVellis, 2003). The stages are as follows: (1) First, after the definition of the construct, an item pool should be generated and the form of measured defined; (2) Then the item pool should be reviewed by experts; (3) The next step consists in evaluate the items by a pre-test; (4) Finally, the scale should be validated after being administered to a representative sample of the study population.
Dimensions are derived from an exploratory analysis in the pre-test stage. The MINRES method (Jöreskog, 2003) was used to derive the underlying dimensional structure of the social capital variables. LISREL’s data pre-processing program PRELIS 2.8 was used for this purpose.
3.2. Sampling
The first goal of the research has been the development and validation of an attitudes scale to identify the perceptions about pro-active collaboration among skilled participants inside an organization. To examine and possibly refine the dimensional structure of the scale, a development sample was collected. As the target population was defined as the skilled labor workers with at least a secondary level education from different industrial sectors, the scale was administered to a sample of professionals of 21 Portuguese companies random chosen from a list that encompasses active as well as competitive companies in the Portuguese business scenario.The selection of companies was stratified by the industrial and service organizations. For the selected companies, the professionals with some kind of decision were invited to answer the questionnaire. The questionnaire included the scale, and characterisation questions about the individual and the company he/she belongs. The questionnaire was self-administrated, via web throughout a survey technology provider, and its link was sent to all selected participants by email. Sixty seven organizations were contacted to participate in the survey, through a Business School’s Career Services office, with ensuing emails exchange in order to clarify research goals and anonymity guaranties. As a result of this invitation process, twenty companies have accepted to participate. The survey was conducted between January and July 2013. The sample is composed by 191 usable questionnaires, from a total of 204 answered questionnaires.
3.3. Scale validation
The scale was validated according the assessment of construct validity and the reliability of measurement. Construct validity is the extent to which a scale adequately assesses the construct it purports to measure (Nunnally and Bernstein, 1994). Typically, it is assessed by validating the two subtypes of validity, the convergent validity and the discriminant validity. Convergent validity refers to the degree to which the scale relates closely to others measures that theoretically should be similar to. In contrast, discriminant validity tests whether constructs that are not supposed to be related should, in fact, not related to the scale. Confirmatory factor analysis (CFA) was conducted to test these subtypes of validity. The convergent validity of the measurement models, the dimensions of Social Capital, was examined by the Average Variance Explained (AVE), which evaluates the amount of variance that is captured by the construct in relation to the amount of variance due to measurement error (Fornell and Larcker, 1981). It should be greater than 0.50, since the variance due to the construct should be greater than the variance due to measurement error. Discriminant validity exists when each construct shares more variance with its measures than with other constructs. This can be assessed if the square root of the AVE values for each construct is bigger than the correlations between the construct and all other constructs (Fornell and Larcker, 1981). To validate the construct validity is also needed to establish the construct relationships to other variables with which it should, theoretically, be associated (Cronbach and Meehl, 1955; Netemeyer et al., 2003), that is, determine how the construct behaves in a nomological network. This property was assessed by empirically evaluating the relationships between Social Capital and Anomie.
The reliability of measurement should be also assessed. The Composite Reliability (CR), measured by the Dillon Goldstein’s Rho, evaluates the overall reliability of a collection of heterogeneous but similar measures. Values of CR are recommended higher than 0.6 for all constructs.
The individual item reliability was assessed by examining the standardized loadings; this estimate should be higher than 0.5 for all items. LISREL 8.8 (Jöreskog and Sörbom, 1996) with Robust Maximum Likelihood estimation was used to verify whether the observed data fit the dimensions of the expected factor structure of the scale (using CFA). Since all indicator variables are ordinal, polychoric correlations were calculated on a pair wise basis.
Different types of goodness-of-fit measures were used. Among the most used absolute fit indices are the Satorra-Bentler Scale Corrected Chi-square, the Root Mean Square Error Approximation (RMSEA), and the Goodness-of-Fit Index (GFI). We also applied incremental fit indices such as the Normed Fit Index (NFI), the Incremental Fit Index (IFI), and the Comparative Fit Index (CFI). RMSEA values ranging from 0.01 to 0.06 are indicative of a close fit and from 0.06 to 0.10 indicate an acceptable fit (Browne and Cudeck, 1993). The GFI, NFI, IFI and CFI range from 0 (no fit) to 1 (perfect fit) (Hair et al., 2005). The comparison of models were made using the Akaike’s Information Criterion (AIC), the Corrected AIC (CAIC) and the Expected Cross-Validation Index (ECVI); the lower values of AIC, CAIC and ECVI correspond to a better fit.
4. Scale Development Process
4.1. Generation of an initial item pool and determination of the form of measurement
To reach the purpose of development a consistent perceptions’ scale that gives information for drawing conclusions of organizational reality, we followed the key characteristics stated by Cavaye (2004). First, it has to be pointed out, as the theory states, that many of the dimensions’ features are highly interrelated. One of the goals of this research is to determine through a measurement instrument or scale how individuals perceived these dimensions and whether they are perceived as separate or not. The specificity of the targeted variables was granted by a theoretical construct which depicts clearly the components of each, in terms of measurability as it rates individuals’ perception.
In terms of comprehensiveness, the statements’ items were designed following the theoretical framework for organizational realities, whose workers have at least secondary level education, and who need to improve their performance continuously. Each item is built around a word that translated the core resource of each social capital dimension, bearing in mind that it should represent a range of relational characteristics. All of them were submitted to apparent and content validity as will be elaborated in the next topics to certify, among other aspects, the easy interpretability of the questions/statements for different educational and professional backgrounds.
It is important to highlight that the precise parameters (population’s attributes) definition is what has allowed the pertinent information to be collected, because it is embedded in the respondents’ tacit knowledge learned from their daily work routine. The questions that have driven the questionnaire formulation are aimed at verifying the level of engagement among employees to their work, exchanging knowledge in a way to help each other in their tasks as well as the conditions provided by organizations for it to happen. For that the questionnaire was made in three parts based on Nahapiet and Ghoshal three dimension’s model (1998) which identified the components of this reality clustered as: a) impersonal connections among people or groups, specifically the presence or absence of ties among organizational actors; b) and also the kind of ongoing relationships these actors have between themselves to fulfill their personal social aims such as prestige, approval and comradery. Lastly, c) the common understanding these organizational participants have about their reality through shared representation, interpretations, and systems of meaning such as vocabulary and local culture.
The core perspective of this model and scale is that any organization is a web of relationships between people and groups throughout the different organization levels, where every component has a degree of interdependence with others, forming a social system which includes everyone from the CEO to 'bottom rung' employees. The research’s aim is to create a tool to help to understand the state of cohesion inside the labor net, identifying its strengths and weaknesses. This is done by statements which reflect critical characteristics identified previously in the theoretical study. As pointed out previously, Likert scale has been identified as the most suitable instrument to measure it, although there is controversy about its efficacy, due to occurrences of some bias in the results (Fowler, 1995; Foddy, 1993). It can be avoided with an accurate statement definition of the topic for respondents, and using rates scales with seven or more categories for the informant to express their opinions (Foddy, 1993); therefore eight categories was purposed to this instrument.
Those two pre-requisites were followed in the scale and question/statement generation. First, to create unambiguous questions/statements, each question/statement refers to one dimension with a clear meaning for all informants, as well as written statements with the same level of generality as the behavior that they will predict, and finally guidance instructions for respondents to give prompted responses, based on implicit social cognition theory where the first prompted choice is the best/right answer (Banaji, 2001).
The Likert scale was chosen to measure agreement or disagreement with the questions/statements, because it is a suitable tool for respondents and gives consistent information for predefined goals. We defined a 9-point scale, following previous research, that identified the accuracy of this level of response category in the highest range of reliability, from 7 to 10 points, as well as the validate and discriminate power criterions which fall within six or more categories. From respondents’ perspective, preferences also confirm this range which has been identified as 10, 9 or 7 (Preston and Colman, 2000). Another aspect observed has been that as Likert is a bipolar scale, measuring from total concordance to disagreement with a statement; adverbs of intensity have been used in all labels and repeated in the same continuum in both sides of the scale to avoid any misunderstanding of the meaning or semantic confusion. (Hill and Hill, 2012). A neutral middle point and not applicable point to cover all opinion possibilities have been introduced to avoid bias due to a lack of options (Dolnicar, 2013; Cavaye, 2004).
4.2. Review of initial item pool by experts and pre-test
Initially a pool of 48 questions/statements was formulated to cover the complete spectrum of the construct’s conceptual domain with some redundant questions/statements among them. This guaranteesd that all the concept’s aspects would be included after validation phases that could eliminate some of them. The next phase was a semantic analysis of question composition, to exclude fuzzy items in terms of the clarity of ideas related to the construct. After that, the pool was submitted for content validation by three expert researchers, who dropped some items and requested that others be rewritten to form a representative social capital construct. A pre-test was applied to the pool to verify the clarity of the questions/statements. Ninety three graduate students of Business Masters in Lisbon who were employees in companies from different economic sectors constituted the pilot sample. Respondents were asked to answer the questions and also point out which items were unclear. An exploratory factor analysis was conduct to these data and Cronbach’s alpha values were calculated to measure the internal consistency of the scale. Two questions/statements were revealed to be unclear; hence they were rewritten according to the information given.
The next phase was the adaption of the questions/statements for a survey/questionnaire to be applied through an internet survey, according to the methodological principles for this kind of media (Dillman, 2006). The questions/statements were constructed to apprehend the respondents’ perceptions about themselves, and how they understand their colleagues as well as the structure they are embedded in.
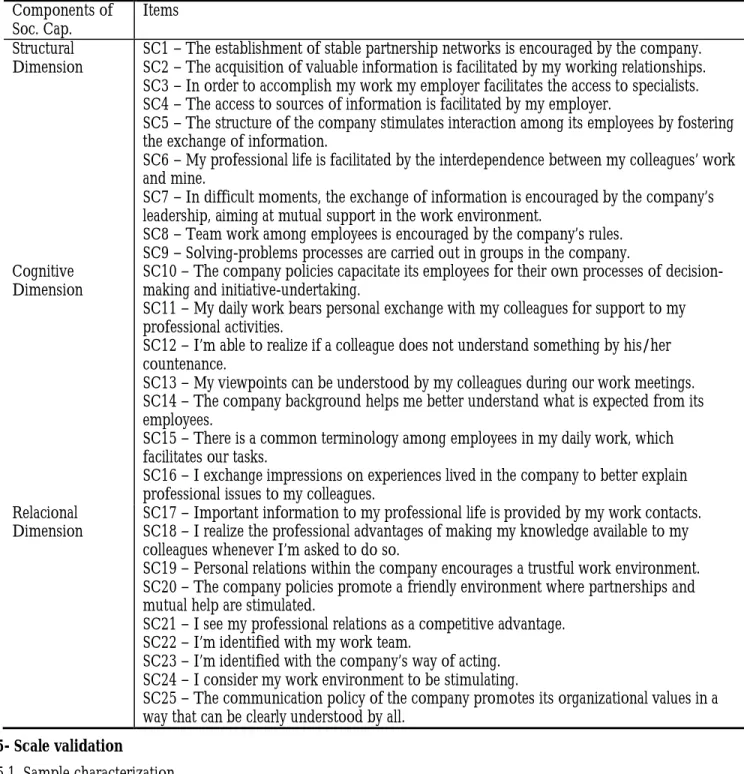
Table 1 presents the final item pool.Table I: Final item pool of Capital Social Components of Soc. Cap. Items Structural Dimension
SC1 – The establishment of stable partnership networks is encouraged by the company. SC2 – The acquisition of valuable information is facilitated by my working relationships. SC3 – In order to accomplish my work my employer facilitates the access to specialists. SC4 – The access to sources of information is facilitated by my employer.
SC5 – The structure of the company stimulates interaction among its employees by fostering the exchange of information.
SC6 – My professional life is facilitated by the interdependence between my colleagues’ work and mine.
SC7 – In difficult moments, the exchange of information is encouraged by the company’s leadership, aiming at mutual support in the work environment.
SC8 – Team work among employees is encouraged by the company’s rules. SC9 – Solving-problems processes are carried out in groups in the company. Cognitive
Dimension
SC10 – The company policies capacitate its employees for their own processes of decision-making and initiative-undertaking.
SC11 – My daily work bears personal exchange with my colleagues for support to my professional activities.
SC12 – I’m able to realize if a colleague does not understand something by his/her countenance.
SC13 – My viewpoints can be understood by my colleagues during our work meetings. SC14 – The company background helps me better understand what is expected from its employees.
SC15 – There is a common terminology among employees in my daily work, which facilitates our tasks.
SC16 – I exchange impressions on experiences lived in the company to better explain professional issues to my colleagues.
Relacional Dimension
SC17 – Important information to my professional life is provided by my work contacts. SC18 – I realize the professional advantages of making my knowledge available to my colleagues whenever I’m asked to do so.
SC19 – Personal relations within the company encourages a trustful work environment. SC20 – The company policies promote a friendly environment where partnerships and mutual help are stimulated.
SC21 – I see my professional relations as a competitive advantage. SC22 – I’m identified with my work team.
SC23 – I’m identified with the company’s way of acting. SC24 – I consider my work environment to be stimulating.
SC25 – The communication policy of the company promotes its organizational values in a way that can be clearly understood by all.
5- Scale validation
5.1. Sample characterization
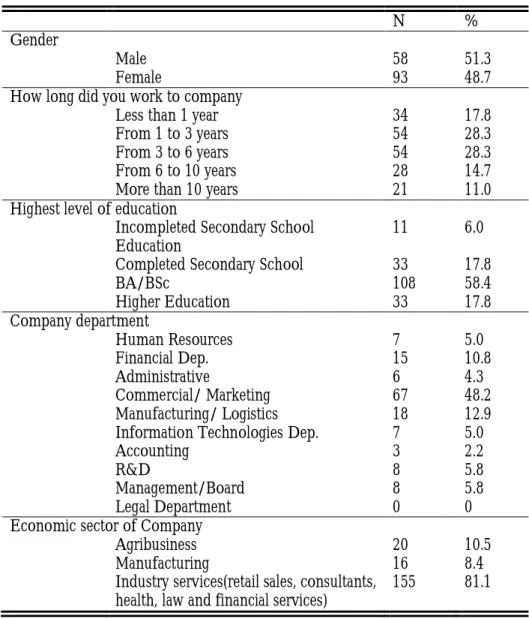
Table 2 summarizes the main characteristics of respondents. Out of a total of 191 respondents, 51% are male; the majority is employed in the company more than three years. More than an half has a bachelor's degree (58%) or higher education (18%), such as a master or a PhD. Regarding the area or department, almost the majority of respondents work in the Commercial or Marketing areas of the company and 13% in the Manufacturing or Logistics areas. To more than 80%, their companies belong to industry services sector.
Table II: Respondent’s characteristics
N %
Gender
Male 58 51.3
Female 93 48.7
How long did you work to company
Less than 1 year 34 17.8
From 1 to 3 years 54 28.3
From 3 to 6 years 54 28.3
From 6 to 10 years 28 14.7
More than 10 years 21 11.0
Highest level of education
Incompleted Secondary School Education
11 6.0
Completed Secondary School 33 17.8
BA/BSc 108 58.4 Higher Education 33 17.8 Company department Human Resources 7 5.0 Financial Dep. 15 10.8 Administrative 6 4.3 Commercial/ Marketing 67 48.2 Manufacturing/ Logistics 18 12.9
Information Technologies Dep. 7 5.0
Accounting 3 2.2
R&D 8 5.8
Management/Board 8 5.8
Legal Department 0 0
Economic sector of Company
Agribusiness 20 10.5
Manufacturing 16 8.4
Industry services(retail sales, consultants, health, law and financial services)
155 81.1
5.2. Distribution of Social Capital items
Table 3 presents the distribution of item responses. The majority of respondents quite or completely agree with all social capital items. However, some items are characterized by percentages of agreement superior to 75%. For example, those relational items interrelated with the valuable information and knowledge facilitated by the working relationships and the employer.
In fact, more than 80% these workers consider there are professional advantages in having exchange of knowledge and information with colleagues, not only making this information available (89%) as receiving from their peers (81%). More precisely, 78% argue that they see their professional relationships as a competitive advantage. Other example of great agreement is related the ability to realize the colleague’s understanding of something by him/her facial expressions (82%).
Table III: Distribution of Social Capital items* Items 1 2 3 4 5 6 7 % % % % % % % SC1 1.0 5.2 4.2 10.5 15.7 42.4 20.9 SC2 0.0 .5 4.2 6.8 13.1 44.5 30.9 SC3 2.1 4.7 3.7 7.3 20.9 42.4 18.8 SC4 .5 1.0 4.7 5.8 15.7 42.9 29.3 SC5 1.0 5.8 9.4 3.7 17.3 30.9 31.9 SC6 1.0 5.2 3.7 4.2 15.2 45.5 25.1 SC7 1.6 6.3 8.4 7.3 19.9 33.5 23.0 SC8 1.0 4.7 6.3 2.6 20.9 39.8 24.6 SC9 2.1 9.9 7.3 6.8 23.0 34.0 16.8 SC10 4.7 7.3 4.2 3.7 19.4 34.6 26.2 SC11 3.1 3.7 3.1 5.2 14.7 39.3 30.9 SC12 .5 0.0 0.0 5.2 12.0 47.1 35.1 SC13 0.0 1.0 3.7 12.6 8.9 53.4 20.4 SC14 1.0 3.1 2.6 14.1 15.7 34.0 29.3 SC15 0.0 .5 2.6 7.3 18.3 44.5 26.7 SC16 1.0 2.6 3.1 4.2 13.6 44.0 31.4 SC17 0.0 2.1 .5 4.2 12.6 49.2 31.4 SC18 .5 .5 .5 2.1 7.9 47.1 41.4 SC19 1.6 3.1 3.1 7.9 20.4 36.1 27.7 SC20 1.6 4.2 7.9 6.8 15.7 39.8 24.1 SC21 .5 .5 1.0 5.2 14.7 40.8 37.2 SC22 .5 2.6 3.1 3.7 16.8 41.4 31.9 SC23 1.6 7.9 6.8 7.3 20.9 36.1 19.4 SC24 2.1 6.3 9.4 4.2 20.4 38.7 18.8 SC25 4.7 10.5 5.8 7.9 17.8 32.5 20.9
*Measurement scale: 1- Completely Disagree; 2- Quite Disagree; 3- Somewhat Disagree; 4- No Opinion; 5- Somewhat Agree; 6- Quite Agree; 7- Completely Agree.
5.3. Construct validity and final version of the scale
Multiple models were estimated. Table 4 presents the standardized loading estimates for each item, the average variance extracted (AVE) and the composite reliability (ρ) estimates for each factor as well as the correlation between factors for the chosen estimated models considering three, two or one factor. These solutions are those that try to verify the various tests of convergent and discriminant validity and to balance these results with the number of measurement items in the scale, presented after the references, due to its size.
The 3-factor models were the first to be estimated. The final solution (presented in table 4) has only three items on the cognitive dimension. The remaining items were dropped along the analyses due to low individual item reliability measured by low standardized loadings. Three other related issues for the cognitive dimension undermine this solution: (1) one regards to the low individual item reliability of the item SC18, since its standardized loading estimate on cognitive dimension is lower than 0.5 (0.468)5; (2) the second issue refers to his AVE value of 0.366,
meaning that on average the cognitive dimension only is able to explain 36.6% of the variance of its items (Fornell and Larcker,1981); and (3) finally, the composite reliability value is lower than 0.7 which indicates that the internal consistency of this construct is low.
Therefore, the cognitive items were aggregated to the relational items and a 2-factor model was analyzed. That is, in this model the cognitive and relational dimensions were aggregated in a single factor because they present high correlation, confirming researches’ view about these two dimensions, for example studies have identified complex interdependences between social identification and shared vocabulary (Ashforth and Mael, 1995; Nahapiet and Ghoshal, 1998).
Regarding the adequacy of the 2-factor final model, AVE and composite reliability values of the two dimensions (structural and cognitive/relational) are clearly placed above the recommended thresholds of 0.5 and 0.7, respectively (Hair et al., 2005). However, when analyzing the correlation between the two factors, we can see that they are very high, close to 1. As a result, the square root of the AVE values for each factor is lower than the correlations between the factors thus the discriminant validity is not assessed. The high correlation between the two factors suggests that the social capital is one-dimensional construct, as it admitted by the theory where it is pointed out that all social capital dimensions are interwoven and interrelated in a complex manner, making it hard to be identified as separated clusters (Nahapiet and Ghoshal, 1998). Additionally, the information criteria measures (presented in table 4) point out to the 1-factor solution model, the chosen model of a single factor.
The final solution of the 1-factor model has 18 items as presented in the table 4. This set of items are composed by all of those that measure the structural dimension of the construct, two cognitive related items and seven of the nine items concerned the relational aspects of social capital. As in the two above described models, the construct validity is not an issue, since both the convergent and discriminant validity are assessed.
To achieve nomological validity, the construct Anomie was hypothesized to negatively correlate with social capital, because its theoretical core point is a lack/absence of interactions among people, who no longer identify themselves as participants of a common organization (Besnard, 1988), therefore Social Capital and Anomie should be negatively correlated. Both questionnaires were applied at the same time to the respondents.Table 5 presents the results of the nomological network of Social Capital with Anomie. Table 6 presents the final factor model. As expected, Anomie is strongly negatively correlated with Social Capital. Consequently, the scale quality is verified and therefore we can consider that Social Capital is an unidimensional construct measured by the set of items of the 1-factor model presented in table 4, in the end of the paper.
Table V: Model results of the nomological network of Social Capital with Anomie
Factors Social Capital Anomie
Variables SC1 0.824 - - SC2 0.631 - - SC3 0.603 - - SC4 0.613 - - SC5 0.832 - - SC6 0.546 - - SC7 0.821 - - SC8 0.823 - - SC9 0.829 - - SC10 0.730 - - SC15 0.581 - - SC17 0.559 - - SC19 0.691 - - SC20 0.858 - - SC22 0.648 - - SC23 0.820 - - SC24 0.792 - - SC25 0.741 - - A1 - - 0.669 A2 - - 0.676 A3 - - 0.624
A5 - - 0.637 A6 - - 0.621 A7 - - 0.637 A8 - - 0.636 A9 - - 0.681 A10 - - 0.639 A13 - - 0.614 A14 - - 0.635 A15 - - 0.696 A16 - - 0.679 A17 - - 0.595 A18 - - 0.738 A19 - - 0.624 Correlations Social Capital 1 Anomie -0.646 1 GoF Indices Satorra Chi-squared (df); p 1052.607 (526); 0.000 RMSEA; P-value for Test of
Close Fit 0.0726; 0.000
NFI 0.944
CFI 0.971
IFI 0.971
GFI 0.618
Table VI: One Factor Model of Social Capital
Items
SC1 – The establishment of stable partnership networks is encouraged by the company. SC2 – The acquisition of valuable information is facilitated by my working relationships. SC3 – In order to accomplish my work my employer facilitates the access to specialists. SC4 – The access to sources of information is facilitated by my employer.
SC5 – The structure of the company stimulates interaction among its employees by fostering the exchange of information.
SC6 – My professional life is facilitated by the interdependence between my colleagues’ work and mine.
SC7 – In difficult moments, the exchange of information is encouraged by the company’s leadership, aiming at mutual support in the work environment.
SC8 – Team work among employees is encouraged by the company’s rules. SC9 – Solving-problems processes are carried out in groups in the company.
SC10 – Important information to my professional life is provided by my work contacts. SC11 – Personal relations within the company encourages a trustful work environment. SC12 – The company policies promote a friendly environment where partnerships and mutual help are stimulated.
SC13 – I’m identified with my work team.
SC14 – I’m identified with the company’s way of acting. SC15 – I consider my work environment to be stimulating.
SC16 – The communication policy of the company promotes its organizational values in a way that can be clearly understood by all.
The statistical study and theory statements converge, with evidences supporting each other through the scale development process. More precisely, the items describing facets from dimensions related to other ones have been understood as belonging to the same dimension, because they are interrelated in complex and important ways (Nahapiet and Ghoshal, 1998). In this perspective, one finding in the process of refining the items has been the tendency of the cognitive dimension to melt into relational. For example: at one facet of cognitive dimension, the shared narratives, its items presented a strong relation with relational dimension, leading to the conclusion that it belongs to this dimension.
The analysis of the items individually shows up those evidences, as it is illustrated by one of dropped cognition’s item. “I exchange impressions on experiences lived in the company to better explain professional issues to my colleagues.” It can be figured out the relational process implicit in sharing narratives in form of stories between individuals. Shared narratives, a cognition dimension facet demands personal interactions involving respect, a relational process, to be put in practice (Granovetter, 1992).
Summing up, although structural and relational dimension remain with more items based on the statistical results, as described, and theory arguments, it has come to the conclusion that social capital scale is considered as an unidimensional construct.
6. Discussion and conclusion
This study proposes a measurement scale for assessing the organizational capital social. The scale was developed and validated using data of high qualified workers of Portuguese companies. Findings suggest that the social capital scale developed is unidimensional and has proprieties of convergent validity and reliability. It is highlighted, that the purpose of this scale is to be a tool for organizations that relies on their intellectual capital to make headway as well as remain competitive in markets. For this, the background for the scale development was based on the Nahapiet and Ghoshal model of social capital, that answers the aspiration to build a scale for organizational social capital which is suitable to identify the mechanisms of social cohesion that create intellectual capital, matrix resource of competitive capacity, through their dimensions and characteristics.
As for the limitation of the research and future works, the scale does not apply to any kind of organizational reality, in fact it has been designed to be used in intellectual workers, as well as the scale was applied in a certain context and period of time needing so more surveys to examine its criterion-related-validity. For this it should be applied in different contexts to further complementary studies. These findings can offer a better understand of the scale as well to improve the organizational social capital knowledge in distinct environments.
Note
1Item SC18 was not dropped during the purification process because the correlation matrix of latent variables
in the resulting model is not positive definitive. References
Adler, P.S. and Kwon, S-W (2002). ‘Social Capital: prospects for a new concept’. Academy of Management. The Academy of Management Review, 27, 17-40.
Andrews, R. (2010). ‘Organizational social capital, structure and performance’. Human Relations, 63(5), 583–608. Ariño M. A., Pastoriza D. and Ricart J. E. (2008). ‘Antecedents and Consequences of Organizational Social Capital:
An Empirical Study’. Paper presented at The Academy of Management 2008, Anaheim, *Best Paper Award, 8-13 August.
Ashforth B. E. and Mael F. A. (1996). ‘Organizational Identity and Strategy as a Context for the Individual’. Advances in Strategic Management, 13, 19-64.
Banaji, M. R. (2001). ‘Implicit attitudes can be measured’. In Roediger III, H. L., Nairne, J. S, Neath I., and. Surprenant A. M. (Eds.), The nature of remembering: Essays in honor of Robert G. Crowder. Washington DC: American Psychological Association, 117-150.
Baum, F.E. and Ziersch, A. M. (2003). ‘Social Capital’. Journal of Epidemiology & Community Health, 57, 320-3. Besnard, P. (1988). ‘The True Nature of Anomie’. Sociological Theory, 6(1), 91-95.
Black J. A. and Boal K. B. (1994). ‘Strategic Resources Traits, Configurations and Paths to Sustainable Competitive Advantage’. Strategic Management Journal, 15, 131-148
Bourdieu, P. (1986). ‘The forms of capital’. In Richardson J. G. (Ed.), Handbook of theory and research for the sociology of education. New York: Greenwood, 241–258.
Browne, M. W. and Cudeck, R. (1993). ‘Alternative ways of assessing model fit’. In Bollen K. A. and Long J. S. (Eds.), Testing Structural Equation Models. Beverly Hills, CA: Sage, 136-162.
Cavaye, J. (2004). ‘Social Capital: A Commentary on Issues, Understanding and Measurement’. Obersatory PASCAL – Place Management, Social Capital and Learning Regions. Available at: http://www.obs-pascal.com/reports/2004/Cavaye.html (accessed 29 Dec. 2013).
Carmona-Lavado A, Cuevas-Rodríguez G., Cabello-Medina C. (2010) ‘Social and organizational capital: Building the context for innovation’. Industrial Marketing Management 39, 681–690.
Cochran, W. G. (1977). Sampling techniques, 3rd edition. New York: Wiley.
Coleman, J. (1988). ‘Social capital in the creation of human capital’, American Journal of Sociology, 94, S95-S120. Cox, E. and Caldwell P. (2000) ‘Making policy social’. In Winter I (Eds), Social capital and public policy in Australia.
Melbourne: National Library of Australia, 43–73.
Cronbach, L. J. and Meehl, P. E. (1955). ‘Construct validity in Psychological Tests’. Psychological Bulletin, 52, 281-302.
DeVellis, R. F. (2003). Scale Development: Theory and Applications. Applied Social research Methods Series, 2nd edition. Los Angeles: Sage.
Dillman,D. A. (2006). Mail and Internet Surveys: The Tailored Design Method, 2nd edition. New York: Wiley. Dolnicar, S. (2013). ‘Asking Good Survey Questions’. Journal of Travel Research, 52, 551-574.
Durlauf S. and Fafchamps M. (2004). Social Capital. Working Paper 10485, National Bureau of Economic Research 1050 Massachusetts Avenue Cambridge, MA 02138. Available at: http://www.nber.org/papers/w10485 (accessed 24 October 2013).
Foddy, W (1993). Constructing questions for interviews and questionnaires, theory and practice in social research. New York, Cambridge: University Press.
Fornell C, and Larcker, D. F. (1981). ‘Evaluating structural equation models with unobservable variables and measurement error’. Journal of Marketing Research, 18, 39–50.
Fowler Jr., F. J. (1995). Improving Survey Questions, design and evaluation. Thousand Oaks: Sage Pub. Fukuyama, F. (1995). Trust: The social virtues and the creation of prosperity. New York: Free Press
Granovetter M S (1992). ‘Problems of explanation in economic sociology’. In Nohria, and Eccles R. (eds.). Network and organizations: structure, form and action. Boston: Harvard Business School Press, 25-56.
Hair Jr., J. F., Black, W. C., Babin, B. J., Anderson, R. E. and Tatham, R. L. (2005). Multivariate Data Analysis, 6th edition. Upper Saddle River, NJ: Prentice Hall.
Han, M. (2006). ‘Developing social capital to achieve superior internationalization: a conceptual model’, Journal of International Entrepreneurship, 4, 99-112
Hill, M. M. and Hill. A. (2012). Investigação por Questionário, 2nd edition. Lisboa: Edições Silabo.
Houghton, S. M., Smith, A. D. and Hood, J. N. (2009). ‘The influence of social capital on strategic choice: An examination of the effects of external and internal network relationships on strategic complexity’. Journal of Business Research, 62(12), 1256–1261.
Inkpen A. C. and Tsang E.W. K. (2005). ‘Social capital, networks, and knowledge transfer’. Academy of Management Review, 30, 146–165.
Jöreskog, K. G. and Sörbom, D. (1996). LISREL 8: User’s Reference Guide. Chicago: Scientific Software International, Inc.
Jöreskog, K.G. (2003). Factor Analysis by MINRES. Available at:
http://www.ssicentral.com/lisrel/techdocs/minres.pdf. (accessed 20 June 2013).
Kawachi I., Kim D., Coutts A. and Subramanian S.V. (2004). ‘Reconciling the three accounts of social capital’. International Journal of Epidemiology, 33, 682-690.
Kilby P. (2002). ‘Social capital and civil society’. National Centre for Development Studies at ANU, Canberra.
McFadyen, M. and Cannella, A. (2004). ‘Social capital and knowledge creation: Diminishing returns of the number and strength of exchange relationships’. Academy of Management Journal, 47(5), 735−746.
Macinko J. and Starfield B. (2001). ‘The utility of social capital in research on health determinants’. The Milbank Quarterly, 79,387-427.
Nahapiet J. and Ghoshal S. (1998). ‘Social capital, intellectual capital and the organizational advantage’. Academy of Management Review, 23(2), 242–266.
Netemeyer, R., Bearden, W. and Sharma, S. (2003). Scaling procedures: issues and applications, London: SAGE. Nunnally, J. C. and Bernstein, I. H. (1994). Psychometric theory, 3rd edition. New York: McGraw-Hill.
O'Reilly, C. and Caldwell, D. (1985). ‘The impact of normative social influence on task perceptions and attitudes: A social information processing approach’. Journal of Occupational Psychology, 58, 193-206.
Poder T G. (2011). ‘What is Really Social Capital? A Critical Review’. The American Sociologist, 42(4), 341-367. Portes, A. (1998). ‘Social capital: Its origins and applications in modern sociology’. Annual Review of Sociology, 24,
1-24.
Preston, C. C. and Colman, A. M. (2000). ‘Optimal number of response categories in rating scale: reliability, validity, discriminating power, and respondent preference’. Acta Psychologica, 104(1), 1-15.
Putnam, R. D. (1995). ’Bowling alone: America's declining social capital’. Journal of Democracy, 6(1), 65-78.
Reagans, R., and Zuckerman, E.W. (2001). ‘Network diversity and productivity: the social capital of corporate R&D teams’, Organization Science, 12, 502-517.
Robison L. J., Schmid A. A. and Siles M. E. (2002) ‘Is social capital really capital?’ Review of Social Economy, 60, 1-24.
Van der Gaag, M. and Snijders, T. (2005). ‘The Resource Generator: Social capital quantification with concrete times’. Social Networks, 27, 1-27.