CENTRO INTERDISCIPLINAR DE INVESTIGAÇÃO MARINHA E AMBIENTAL
A Graphical and Numerical Approach for
Functional Annotation and Phylogenetic
Inference
Guillermin Agüero Chapin
Guillermin Agüero Chapin
Thesis Advisers
Ph.D. Agostinho Antunes, FCUP, University of Porto, Portugal
Ph.D. Vitor Vasconselos, FCUP, University of Porto, Portugal
Ph.D. Reinaldo Molina Ruiz, University Central of Las Villas, Cuba
2013
Dissertation submitted in fulfillment of the requirements for the degree of Doctor in Biology of University of Porto
Acknowledgments
I acknowledge the Portuguese Fundação para a Ciência e Tecnologia (FCT) for financial support (SFRH/BD/47256/2008) to carry out this work. My gratitude to my research advisors, Ph.D. Agostinho Antunes, Ph.D. Vitor Vasconcelos and Ph.D. Reinaldo Molina, who provided scientific guidance and economical support for the successful culmination of this project. Thanks to my colleagues from LEGE, CIIMAR, for allowing me an easy integration with the group; they were very kind since my arrival. Gratefulness to colleagues, ex-colleagues and friends from the Molecular Simulation and Drug Design Group in Santa Clara, Cuba, for their valuable technical contributions, especially to Ph.D. Humberto González and Ph.D. Maykel Pérez for the support given while developing the TI2BioP software. Thanks to Ph.D. Aminael
Sánchez for his orientation and help with the overall research, particularly for encouraging the learning of programming languages. I also acknowledge the revision performed by the Ph.D. Ricardo Medina that significantly improved the thesis writing.
Agradezco especialmente a:
Mi familia por apoyar siempre mi superación profesional y por su amor incondicional
Mi primera y única amiga gallega, que me abrió las puertas de su casa, su familia y su corazón...Marta Teijeira Bautista
Mi amigo en Porto, en Galicia y espero que en todas partes y por siempre...Luis Cagide Fajin
Doris, la Dra pinareña y su esposo Luis, por su ayuda y hospitalidad desde el 2008 hasta la fecha
Angela por ser mi amiga,modelo y silenciosa compañia durante las tediosas compras
María por traer nuevamente el toque latino a la residencia y por resumir tan bien
Alius y Leticia por ser mis mejores amigas cubanas y ayudarme de alguna forma en la elaboración del trabajo
Mi suegri por quereme como un hijo y compatir mis éxitos y amarguras
Mi querida Gisselle por su total dedicación en la revisión, edición, discusión técnica de la tesis y sobretodo por ser la Chichi
Abstract
We developed a new graphical/numerical method called TI2BioP (Topological Indices to BioPolymers) to estimate topological indices (TIs) from two-dimensional (2D) graphical
approaches for DNA/RNA and protein data. TIs were used to build up alignment-free models to the functional classification and to infer evolutionary relationships without alignments in highly diverse gene/protein classes with relevance for the drug discovery process. The method was effective in the detection of new members and remote protein homologous compared to alignment procedures and was further confirmed by experimental evidences. The 2D Cartesian protein representation and its TIs were able to unravel the Cry 1Ab C-terminal domain from Bacillus thuringiensis´s endotoxin as a bacteriocin-like protein, which has not been detected by classical alignment methods. We registered in public databases new members of the internal transcribed spacer (ITS2) and of the RNase III protein classes using alignment-free models. The predictions of these two members were verified through enzymatic assay for the new RNase III member and by evaluating both queries against profiles Hidden Markov Models (HMM). The amino acid clustering strategy to build 2D Cartesian protein maps was extrapolated to generate a non-classical profile HMM with high prediction accuracy to detect RNase III members. Classical profiles HMM showed a lower classification performance on the ITS2 genomic class than alignment-free models in spite of the fact they were generated by multiple sequence alignment (MSA) algorithms improved for sets of low overall sequence similarity. The new ITS2 sequence isolated from Petrakia sp. was used by alignment-free based techniques applied for the first time to the estimation of phylogenetic inferences. The Petrakia sp. fungal isolate was placed inside the
Pezizomycotina subphylum and the Dothideomycetes class. Finally, we demonstrated that
the use of graphical/numerical-based models in cooperation with alignment sequence search methods provided the most reliable exploration of the Adenylation domains (A-domains) repertoire of Nonribosomal Peptide Synthetases (NRPS) in the Microcystis aeruginosa proteome. The knowledge of the complete A-domain repertoire in the proteome of a cyanobacteria species may allow unraveling new NRPS clusters for the discovery of novel natural products with important biological activities.
Key words: 2D graphs/ Topological Indices/ Sequence similarity/ Alignment-free models/
Resumo
Neste trabalho foi desenvolvido um novo método gráfico-numérico TI2BioP (Topological Indices to BioPolymers) para fornecer índices topológicos (ITs) a partir de aproximações
gráficas a duas dimensões (2D), com o objectivo de construir modelos livres de alinhamentos para a classificação funcional de DNA, RNA e proteínas. O método permite igualmente inferir relações evolutivas em diversas classes de genes ou proteínas, directa ou indirectamente relacionadas com a descoberta de novos fármacos. O método foi efectivo na detecção de novos membros e de proteínas homólogas remotas, quando comparado com procedimentos que usam alinhamentos, tendo sido ainda confirmado por evidências experimentais. A representação cartesiana 2D das proteínas e seus ITs permitiu desvendar que o domínio Cry 1Ab C-terminal da endotoxina de Bacillus thuringiensis é uma proteína semelhante à bacteriocina, facto que não tinha sido possível detectar com métodos clássicos de alinhamento. Foram detectadas em bases de dados públicas novos membros das classes de proteínas RNase III e do espaçador interno transcrito (ITS2) usando modelos livres de alinhamentos. Essas predições foram verificadas através de ensaios enzimáticos, no caso do novo membro das RNase III, e através da avaliação de perfis HMM em ambos os casos. A estratégia de agrupamento de aminoácidos para construir os mapas cartesianos 2D de proteínas foi extrapolada para gerar um perfil HMM -clássico com alta precisão para a detecção de membros da classe RNase III. No entanto, os perfis clássicos HMM gerados por algoritmos de alinhamentos múltiplos de sequências (MSA), melhorados para conjuntos de sequências de baixa semelhança global, mostraram um pobre desempenho na classificação da classe genómica ITS2 relativamente aos modelos livres de alinhamentos. A nova sequência ITS2 isolada de Petrakia sp. foi utilizada pela primeira vez para fazer inferências filogenéticas com técnicas não baseadas em alinhamentos. O nosso grupo colocou o isolado fúngico de Petrakia sp. dentro do subphylum Pezizomycotina e a classe Dothideomycetes. Finalmente, demonstramos que o uso de modelos gráficos-numéricos juntamente com métodos de alinhamentos de pesquisa de sequências fornecem os resultados mais fiáveis nas explorações do repertório dos domínios de adenilação (domínios A) das sintetases de péptidos não ribosomais (NRPS) no proteoma de
Microcystis aeruginosa. O conhecimento de todo o repertório de domínios A no proteoma
das diversas espécies de cianobactérias poderá revelar novos grupos de NRPS, o que poderá potencialmente permitir a descoberta de novos produtos naturais com importantes actividades biológicas.
Palavras-chave: Gráficos 2D/ Índices Topológicos/ Similaridade de sequências/ Modelos
Index
1. Introduction ... 12
2. Materials and Methods ... 19
2.1. General scheme of procedure ... 19
2.2. Database ... 20
2.2.1. Training and test subsets selection ... 21
2.2.2. Methods to explore database diversity... 21
2.3. TI2BioP software ... 22
2.3.1. 2D graphical representations of TI2BioP ... 23
2.3.2. Spectral moments calculation for different 2D graphical representations ... 26
2.3.3. Alignment-free models developed from TI2BioP‟s spectral moments ... 28
2.4. Alignment-based Methods for Functional Classification ... 30
2.5. Experimental validation ... 31 2.6. Phylogenetic analysis ... 31 3. Results ... 33 4. Discussion ... 35 5. Conclusions ... 48 5.1. Future directions ... 48 6. References ... 50 7. Annexes ... 62
Annex 1. TI2BioP: Topological Indices to BioPolymers. Its practical use to unravel cryptic bacteriocin-like domains ... 63
Annex 2. Non-linear modelsbasedon simple topological indices to identify RNase III protein members ... 75
Annex 3. An alignment-free approach for eukaryotic ITS2 annotation and phyloge- netic inference ... 87
Annex 4. Exploring the adenylation domain repertoire of nonribosomal peptide synthe- tases using an ensemble of sequence-search methods ... 101
List of Figures
2.1. Flowchart of the general procedure ... 19
2.3. Window View of TI2BioP for the representation of protein four-color maps ... 22
2.3.1. The2D-Cartesian map for the DNA fragment AGCTG ... 23
2.3.2. The 2D-HP map assigned to the protein fragment DEDKV ... 24
2.3.3. 2D-HP map for the RNase III protein from E. coli BL21... 25
2.3.4. Four-color map for the first nine amino acids of 1 pdb AMU ... 25
List of Tables
3.1. Best reported alignment-free models for the classification of each gene/protein
family involved in the study ... 34
3.2. Prediction performance for the best alignment-free model and alignment-based
List of Abbreviations
AAC Amino acid composition
A Adenylation
A-domains Adenylation domains
ATSd Broto–Moreau autocorrelation
AASA AminoAcid Sequence Autocorrelation ANN Artificial Neural Networks
BLAST Basic Local Alignment Search Tool
CGT Chemical Graph Theory
CATH Class, Architecture, Topology and Homology C&RT Classification and Regression Trees
CT Classification Trees
CV Cross-validation
C Condensation
D Dimensional
DTM Decision Tree Models
Ed Euclidean distance
FFT Fast Fourier transform
GDA General Discrimination Analysis HMM Profile Hidden Markov Models ITS2 Internal transcribed spacer J Balaban index
JC Jukes-Cantor K2P Kimura-2-parameter k-MCA K-Means cluster analysis
MARCH-INSIDE Markov Chain Invariants for Network Selection & Design
MSA Multiple Sequence Alignment MAFFT Multiple Alignment based onFFT
MCL Maximum Composite Likelihood MLP Multilayer Layer Perceptron
NRPS Nonribosomal Peptide Synthetases
NW Needleman-Wunsch
NJ Neighbour-joining
PINs Protein interaction networks PAM Point Accepted Mutation
PDB Protein Data Bank
PG Polygalacturonase
PKS Polyketide synthases
PseAAC Pseudo amino acid composition
QSAR/QSPR Quantitative-Structure-Activity/Property Relationship ROC Receiver Operating Characteristic
SVM Support Vector Machine
SW Smith-Waterman
S Score
siRNAs Short interfering RNAs
TIs Topological Indices
TOPS-MODE Topological Substructural Molecular Design
TI2BioP Topological Indices to BioPolymers
UTRs Untranslated regions
List of Original Papers
This thesis is based on the following articles:
Agüero-Chapin G, Pérez-Machado G, Molina-Ruiz R, Pérez-Castillo Y,
Morales-Helguera A, Vasconcelos V and Antunes A. TI2BioP: Topological
Indices to BioPolymers. Its practical use to unravel cryptic bacteriocin-like domains. Amino Acids.2011; 40(2):431-42.
Agüero-Chapin G, de la Riva GA, Molina-Ruiz R, Sánchez-Rodríguez A,
Pérez-Machado G, Vasconcelos V and Antunes A. Non-linear modelsbasedon simple topological indices toidentifyRNase III protein members. Journal of Theoretical Biology. 2011; 273(1):167-78.
Agüero-Chapin G, Sánchez-Rodríguez A, Hidalgo-Yanes PI, Pérez-Castillo
Y, Molina-Ruiz R, Marchal K, Vasconcelos V and Antunes A. An alignment-free approach for eukaryotic ITS2 annotation and phylogenetic inference.
PLoS ONE 2011; 6(10).
Agüero-Chapin G, Molina-Ruiz R, Maldonado E, de la Riva GA,
Vasconcelos V and Antunes A. Exploring the adenylation domain repertoire of nonribosomal peptide synthetases using an ensemble of sequence-search methods. PLOS ONE 2013; 8(7).
FCUP 12
A Graphical and Numerical Approach for Functional Annotation and Phylogenetic Inference
1. Introduction
Graphical approaches have been successfully used in several branches of science such as mathematics, physics, chemistry, biochemistry, biology and computer science to visualize complex relationships, including functional relations, outcomes of complicated processes and interactions, as well as to simplify scientific notation. A graph is a collection of vertices or nodes and a compilation of edges that connect pairs of vertices; they have been deeply studied in graph theory, a branch of discrete mathematics, to model pairwise relation between objects from a certain collection [1].
Graph theory has facilitated the development of Chemical Graph Theory (CGT) to allow combinatorial and topological exploration of the chemical molecular structure through the calculation of mathematical descriptors [2].The molecular topology is represented as graphs where atoms and bonds are considered as vertices and edges of the graph, respectively. It is possible to derive molecular descriptors from the graph representing an approximation of the molecular structure to carry out Quantitative-Structure-Activity/Property Relationship (QSAR/QSPR). Such mathematical descriptors have been traditionally used in QSAR/QSPR studies for small sized molecules. When these methodologies are applied to drugs, they can be used in medicinal chemistry for modeling drug design and drug-receptor relationships [3, 4].
More recently with the emergence of genomics and proteomics, the CGT is being extended to bioinformatics through the characterizations of DNA/RNA and proteins for comparative analysis without the use of sequence alignments. In genomics and proteomics, nucleotides, amino acids, proteins, electrophoresis spots, polypeptidic fragments, or more complex objects can play the role of nodes and the bonds or the relation either functional or geometrical between them are considered the edges of the graph [2].Thus, we can simplify complex biological systems like proteomes, metabolic networks and protein interaction networks (PINs) into the topology of a graph providing support to gain useful insights into such systems. All of these graphs or networks can be numerically described using the so-called Topological Indices (TIs) [5]. TIs are numerical indices derived from the graph-theoretical representation of a molecule as a whole and contain information about the connections between atoms in the molecule and the properties for the connected atoms [6]. Therefore, a topological index is the numerical representation of the information extracted from a chemical complex but it can be easily extended to characterize biological systems as mentioned above [7].
numeric characterization of genes and proteins families through the calculation of TIs, we build a graph representing a DNA/RNA and protein sequence where nodes are represented by nucleotides or amino acids while the connections are normally represented by covalent bonds, hydrogen bridges, electrostatic interactions, van der Waals bonds and so on [8-10]. There are several types of TIs depending on the complexity of the biomolecule representation that could comprise several dimensional (D) spaces. Linear sequences (sequence order), is a one dimensional (1D) representation, while two-dimensional (2D) and three dimensional (3D) are related to sequence arrangement or geometry into these spaces [11-13]. Particular attention has been placed into the 2D representations which do not represent the “real structure” of the natural biopolymers but have been very effective in inspecting similarities/dissimilarities among biopolymers either by direct visualization or by numerical characterization [2]. Examples of 2D artificial representations for DNA and protein sequences with potentialities in bioinformatics include the spectrum-like, star-like, cartesian-type and four-color maps [2, 14-17]. These DNA/RNA and protein maps can generally unravel higher-order useful information contained beyond the primary structure, i.e. nucleotide/amino acid distribution into a 2D space. Their essence can be captured in a quantitative manner through TIs to easily compare a great number of sequences/maps [18-21].
Despite the complexity of the biomolecule representation, for the calculation of any TI is necessary the creation of the adjacency matrix. There are variants of the adjacency matrix e.g., node and edge adjacency matrix [22]. They translate the connectivity/adjacency relations between nodes or edges in the graph to a matrix arrangement [23]. The adjacency matrix is a square matrix where nodes or edges are numbered without specific order. The elements of the adjacency matrix nij or eij are equal to 1 if i and j are adjacent otherwise take the value of 0. When two nodes share a common edge are adjacent; the same consideration is applied for two edges sharing at least one node [24]. Once the adjacency matrix is built, there are several algorithms to calculate the TIs. One of the most common algorithms used in QSAR for TIs calculation can be represented according to the key vector-matrix-vector scheme. Several authors have reported TIs using this algorithm, such as the Winner index (W) [25], firstly defined in a chemical context; and others like Randić invariant (χ) [26], Balaban index (J) [27], Broto–Moreau autocorrelation (ATSd) [28] and the spectral moments introduced by Estrada [29].
The last ones are based on the method of moments developed in the 70‟s and applied in solid-state physics and chemistry. Estrada et al.. extended these concepts to the use of
FCUP 14
A Graphical and Numerical Approach for Functional Annotation and Phylogenetic Inference
bond moments and included bond weights related to hydrophobic, electronic and steric molecular features. The spectral moments are defined as the sum of main diagonal entries of the different powers of the bond adjacency matrix [30]. This matrix is the same adjacency matrix described above where non-diagonal entries are 1 or 0 if the corresponding bonds share one atom or not but with the particularity that main diagonal entries are weighted with bond properties. Spectral moments were implemented in the TOPS-MODE (Topological Substructural Molecular Design) program [31] and have been widely validated by many
authors to encode the structure of small molecules in QSAR studies [32-34] including the characterization of the folding degree of proteins based on its dihedral angles [35, 36]. Despite, the versatility of the spectral moments in QSAR studies, they have been poorly used to describe biopolymers structures excepting when they promoted the arising of the Estrada folding index (I3) for proteins [37]. We extended the spectral moments to search structure-function relationships in DNA/RNA and proteins classes with no alignments, turning the spectral moments into alignment-free predictors applied to annotate biological functions of genes/proteins [8, 19, 38].
The prediction of the biological function, 2D and 3D structure of a query gene or protein has traditionally relied on similarity measures provided by alignment algorithms, to other recorded members of the family. The first tools to distinguish biologically significant relationships from chance similarities were based on dynamic programming algorithms; the Needleman-Wunsch [39] and Smith-Waterman algorithms [40]. Needleman-Wunsch algorithm was reported in 1970 to calculate global similarity scores between two sequences and it is more suitable when the homologies have been previously set, e.g. when evolutionary trees are built [39]. The Smith–Waterman procedure was proposed in 1981 to determine similar regions between two sequences instead of looking at the total sequence. This algorithm is able to detect sub-regions or sub-sequences with evolutionary conserved signals of similarity avoiding regions of low sequence similarity [40]. However the high computational cost of dynamic programming algorithms makes them impractical for searching large databases [41]. Rapid heuristic algorithms inspired on above-mentioned methods were developed to perform sequence searches against large databases in normal computers such the cases of FASTA [42] and Basic Local Alignment Search Tool (BLAST) programs [43]. FASTA algorithm was reported in 1985 by Lipman et al.. to find locally similar regions between two sequences based on identities but not gaps [42]. Such regions were rescored using a measure of similarity between residues, such as a PAM matrix [44]. BLAST was developed by Karlin and Altschul in 1990 to perform rapid sequences comparison
searches, and in the analysis of multiple regions of similarity in long DNA sequences. It is a simple and robust method that works faster than the other existing sequence comparison tools mentioned so far [43].
Today, the most powerful sequence-based comparison methods use sets of aligned sequences, either as profiles like HMM [45, 46] or position specific scoring matrices (PSSMs) [47]. Profile/HMM/PSSM methods are more sensitive than single-sequence comparison methods because they summarize the evolutionary history of a family, identifying more and less conserved positions within the protein [48]. PSSMs are the essence of the Position Specific Iterative-BLAST (PSI-BLAST), a very sensitive comparison tool that has revealed homologies between sequences that previously were recognized only from structure [47]. Profiles HMM are the core of the popular Protein family (Pfam) database made up for alignment profiles representing more than 3071 protein families [49]. Profiles HMM are sensitive tools to detect structural and functional protein signatures in large databases even when the sequence conservation is restricted.
In short, alignment methods have being improved their sensitivity to detect functional signals in query sequences by using several strategies like the substitution of the original similarity matrixes among the aligned sequences for PSSMs [47], the addition of other steps in BLAST searches [50-52] and the implementation of stochastic predictive models such as the case of profiles HMM for DNA/RNA and protein sequences [49, 53].
Similar efforts have been carried out to improve the quality of MSA in phylogenetic reconstruction accuracy [54-56]. Phylogenetic tree reconstruction is traditionally based on MSAs and heavily depends on the validity of this information bottleneck [57]. CLUSTALW was reported in 1994 to align any number of homologous nucleotide/protein sequences with an improved sensitivity and it is widely utilized since then due to its well performance in practice [58]. Later, other algorithms have tried to improve MSA on the accuracy of CLUSTALW. T-Coffee reported in 2000 employed a similar progressive strategy but achieved a higher accuracy alignment by combining information derived from global and local multiple alignments [56]. MAFFT reduced drastically the CPU time in respect to T-Coffee and CLUSTALW. Homologous regions are rapidly identified by fast Fourier transform (FFT) using a simplified scoring system. It provides increased alignment accuracy even for sequences having large insertions as well as distantly related sequences of similar length [59]. Edgar in 2004 implemented progressive and iterative refinement alignment strategies in MUSCLE. The speed and accuracy of MUSCLE are compared with T-Coffee, MAFFT and CLUSTALW [55]. More recently, DALIGN-TX was developed as a segment-based multiple
FCUP 16
A Graphical and Numerical Approach for Functional Annotation and Phylogenetic Inference
alignment tool improved for sets of low overall sequence similarity. On locally related sequences, DIALIGN-TX outperforms all other programs without increasing the CPU time [60].
Although the detection of functional signals in gene/protein classes has been improved as well as the quality of MSA to produce reliable phylogenetic trees; low sequence similarity or the similarity to genes/proteins lacking functional annotations represent a drawback for the performance of alignment algorithms [61]. It is still difficult to produce reliable alignments for proteins that share less than 30-40% of identity [61, 62]. Consequently, several alignment-independent approaches are being developed to overcome this limitation for an effective functional annotation and for reliable phylogenetic inferences in highly diverse gene/protein families.
Most of the alignment-free classifiers have been based on amino acid composition such as the one reported by Strope and Moriyama in 2007 to detect remote similarity of G-protein-coupled receptor superfamily members using support vector machines [63]. In the same year, alignment-free descriptors such as amino acid content and amino acid pair association rules were used along with routinely available classification methods to classify protein sequences [64]. The web-server Composition based Protein identification (COPid) was developed in 2008 by Kumar et al.. to exploit the full potential of protein composition to annotate the function of a protein from its composition using whole or part of the protein [65]. One of the most popular alignment-free approaches is the Chou‟s concept of pseudo amino acid composition (PseAAC) introduced in 2001; it reflects the importance of the sequence order effect in addition to the amino acid composition to improve the prediction quality of protein cellular attributes [66]. This concept has been widely used to predict protein subcellular location [67], enzyme family classes [68], membrane protein types [69], protein quaternary structure [70] and many others protein attributes. A similar approach was developed by Caballero and Fernandez defined as Amino Acid Sequence Autocorrelation (AASA) vectors but instead of using a distance function (property difference) like in the
PseAAC
, they used autocorrelation (property multiplication) to predict the conformational stability of human lysozyme mutants [71]. AASA is an extension of the Broto-Moreau autocorrelation TIs used before in SAR studies to protein sequences [28]. Following the same philosophy González-Díaz and co-workers have scaled their Markovian descriptors and stochastic spectral moments to characterize protein sequences. They implemented 1D, 2D and 3D TIs into the MARCH-INSIDE (Markov Chain Invariants for Network Selection &Few alignment-free approaches have dealt with high sequence divergence [73] to increase the reliability of phylogenetic inferences [74]. There is evidence that at low divergence between sequences, the genetic code is a better indicator of the phylogenetic relationships while at high divergence better accuracy is achieved by focussing on amino acid properties [75]. The most relevant alignment-independent approaches reported for phylogenetic trees reconstruction have been based on patterns discovered in unaligned sequences [76], amino acid composition [65] and a kernel approach for evolutionary sequence comparison [74].
While several types of graphical/numerical methods have been developed to carry out comparative analyses for DNA/RNA and proteins with no alignments [11], very few studies have exploited its potentialities in bioinformatics to perform functional predictions and phylogenetic inferences in highly diverse gene/protein classes. Therefore, we aimed to develop a new graphical/numerical tool inspired on previous experiences achieved by other methodologies such as TOPS-MODE and MARCH-INSIDE, to face alignment problems.
Such graphical/numerical tool was called TI2BioP (Topological Indices to BioPolymers)
because it allows the calculation of the original spectral moments as simple TIs from different 2D graphical approaches for DNA, RNA and proteins biopolymers. TI2BioP will be
assessed by predicting functional classes and by inferring phylogenetic relationships at low sequence similarity [19].Thus, we placed the following hypothesis:
Is TI2BioP methodology an effective tool to develop alignment-free models to
predict biological functions for highly diverse gene/protein families and useful in the molecular evolutionary field to obtain reliable phylogenetic trees?
To validate this hypothesis we have selected four gene/protein families that share common features: (i) low sequence similarities among its members and (ii) relative involvement in the drug discovery process. Furthermore, the gene/protein family members studied belong to both prokaryotic and eukaryotic organisms.
The gene/protein families studied were the following:
1. Proteinaceous bacteriocins are toxins produced and exported by both gram-negative and gram-positive bacteria as a defense mechanism. The bacteriocin family includes a diversity of proteins in terms of size, method of killing, method of production; genetics, microbial target, immunity mechanisms and release Bacteriocins can be applied as food preservatives and are of great interest for novel antibiotics development and as diagnostic agents for some cancers.
FCUP 18
A Graphical and Numerical Approach for Functional Annotation and Phylogenetic Inference
2. Ribonuclease III (RNase III) class shows variable homology and different domain structures. RNases III are useful for drug search or drug-target candidates for drug development because these enzymes are involved in several important biological processes.
3. ITS2 gene class shows a high sequence divergence, which has traditionally complicated ITS2 annotation and limited its use for phylogenetic inference at low taxonomical level analyses (genus and species level). ITS2 is the standard gene target for fungal taxonomical identification at the species level [77], being especially relevant to identify fungal species that cannot be cultured such as the potential producers of bioactive compounds [78].
4. A-domains from NRPS show low sequence similarity between its members. NRPS are megasynthetases composed by several domains organized in clusters for the synthesis of oligopeptides having different biological activities.
In summary, the objectives of this thesis are the following:
1. To develop the TI2BioP methodology based on the graph theory to generate
alignment-free predictors (spectral moments).
2. To evaluate the ability of TI2BioP to detect functional signatures from the
above-mentioned gene/protein classes and to identify new members of such families in cooperation with experimental evidences and alignment procedures.
3. To compare TI2BioP performance in detecting functional signatures among the
gene/protein classes involved in this study against alignment algorithms like profiles HMM.
FCUP 19
A Graphical and Numerical Approach for Functional Annotation and Phylogenetic Inference
2. Materials and Methods
2.1. General scheme of procedure
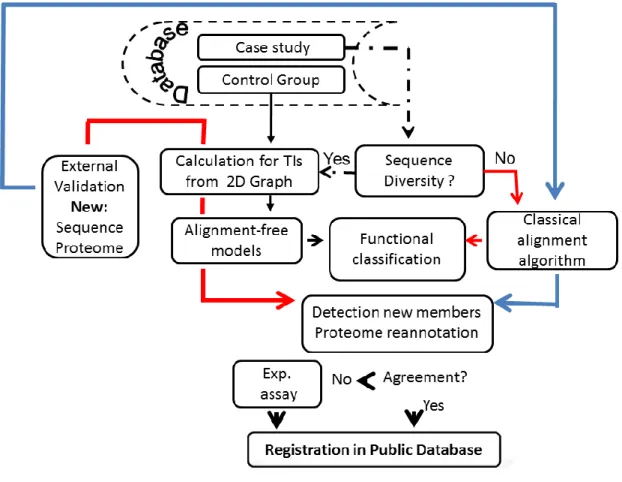
In this chapter, information about the general procedure and methods used in this study is provided. Alignment-free models for functional classification of highly diverse gene/protein families were developed using TIs derived from 2D graphical representations for DNA and protein sequences. The classification performance of such models were compared with the obtained by classical alignment procedures from the same database. Both methods were used in cooperation to annotate the function of new gene/protein members and to re-annotate proteomes (Figure 2.1).
Figure 2.1. Flowchart of the general procedure to evaluate alignment-free models for functional classification of
2.2. Database
To test the performance and efficacy of our alignment-free approach TI2BioP to detect
DNA and protein signatures and to infer phylogenetic relationships, four gene/protein families having low sequence similarity among their members according to some reports were selected. In addition, such gene/protein families are relevant for drug discovery.
The gene/protein classes studied were:
1. Bacteriocin protein class: A total of 196 bacteriocin-like proteins sequences belonging to several bacterial species were collected from the two major bacteriocin databases, BAGEL [50] and BACTIBASE [79].
2. Ribonuclease III class (RNase III): 206 RNase III protein sequences belonging to prokaryote and eukaryote species were downloaded from GenBank database gathering all RNAses III registered up to May of 2009.
3. ITS2 class: A total of 4 355 ITS2sequences from a wide variety of eukaryotic taxa (http://its2.bioapps.biozentrum.uni-wuerzburg.de) were used.
4. Adenylation domains (A-domains): 138 A-domain sequences from NRPS were collected from the major NRPS–PKS database (http://www.nii. res.in/nrps-pks.html). Because a negative set or control group to develop classification models is needed, three different control groups were selected according to some features: (1) structurally well-characterized sequences (2) high functional diversity among its members and (3) similar sequence lengths in respect to the study case.
Protein control groups:
1. Sequences from Class, Architecture, Topology and Homology (CATH) domain
database (version 3.2.0) (http://www.cathdb.info) sharing only 35% of sequence similarity were selected to provide a functional representation and avoid structural redundancy. This group was used as a control to develop the alignment-free models to recognize bacteriocin-like and A-domains sequences.
2. High-resolution proteins in a structurally non-redundant and representative subset from the Protein Data Bank (PDB) made up of enzymes and non-enzymes were also used. This subset was selected according to independent-sequence similarity criteria but using simple features such as secondary-structure content, amino acid
FCUP 21
A Graphical and Numerical Approach for Functional Annotation and Phylogenetic Inference
propensities, surface properties and ligands. Redundancy was removed by structural alignments to provide just representative structures. This protein subset was used as a control group to develop alignment-free models to detect RNase III enzymes [61].
Gene control group:
1. A non-redundant subset containing both 5‟- and 3‟-untranslated regions (UTRs) sequences from the fungi kingdom was selected from the eukaryotic mRNAs database: UTRdb (http://www.ba.itb.cnr.it/UTR/). It was selected as a control group to identify ITS2 members with no alignments because this class comprises diverse but structurally related genomic sequences to the ITS2 class. Similar to the ITS2, UTRs are non-coding regions with divergence among the eukaryotes but showing a more conserved secondary structure when are transcribed into RNAs [80].
2.2.1. Training and test subsets selection
After assessing the diversity of the study cases; both study case and control group were divided independently into training and test subsets. The selection of training and test members was carried at random when the size of the study case and the control group sets were originally balanced. Otherwise, both sets (study and control group) were balanced to avoid classification bias. K-Means cluster analysis (k-MCA)was performed to reduce representatively the size of control groups (generally, the control group is larger than the study case) [81].This procedure required a partition of the study case and its control group independently into several statistically representative K centers according the TIs values for each case (sequence). Each K center is the mean of the cases assigned to each cluster. Finally, clustering process was driven by structural features due to the intrinsic nature of TIs. Members that made up training and test sets were straightforwardly selected from such clusters.
2.2.2 Methods to explore database diversity
Pairwise alignment
Although a high dissimilarity among gene/protein members of each study case involved in this study was previously reported [52, 79, 82, 83]; the quantification of such diversity had not been recorded yet. It has been demonstrated that the reliability of the predicted biological function and the phylogenetic reconstruction dramatically decreases when gene/protein
families share pair-wise sequence similarities lower than 50% [57, 61, 84]. Thus, the Smith-Waterman (SW) [85] and Needleman-Wunsch (NW) [39] dynamic programming algorithms were used to perform local and global sequence similarities either between pairs of DNA or pairs of proteins (all vs all) to explore the sequence diversity of gene/protein families involved in the present study.
2.3. TI2BioP software
TIs were calculated by our in-house TI2BioP software from different 2D graphical
approaches applied to DNA/RNA and proteins. TI2BioP is based on the graph theory
considering the “building blocks” of DNA/RNA and protein biopolymers as nodes and the bonds between them as edges into the 2D graphs. Consequently, the information contained in biopolymeric long strings is simplified in the topology of 2D graphs that is eventually determined by the sequence order and the nucleotide/amino acid composition of these biopolymers.
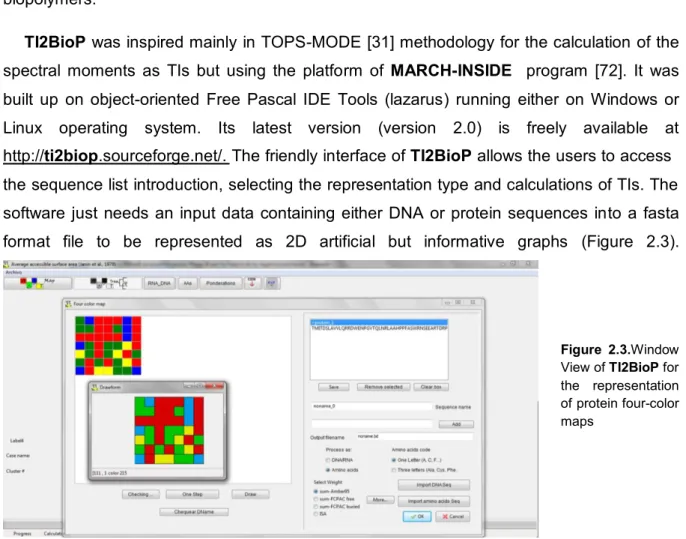
TI2BioP was inspired mainly in TOPS-MODE [31] methodology for the calculation of the
spectral moments as TIs but using the platform of MARCH-INSIDE program [72]. It was
built up on object-oriented Free Pascal IDE Tools (lazarus) running either on Windows or Linux operating system. Its latest version (version 2.0) is freely available at http://ti2biop.sourceforge.net/. The friendly interface of TI2BioP allows the users to access
the sequence list introduction, selecting the representation type and calculations of TIs. The software just needs an input data containing either DNA or protein sequences into a fasta format file to be represented as 2D artificial but informative graphs (Figure 2.3).
Figure 2.3.Window
View of TI2BioP for
the representation of protein four-color maps
FCUP 23
A Graphical and Numerical Approach for Functional Annotation and Phylogenetic Inference
Two main types of 2D artificial representations have been implemented so far in the software (i) one based on Cartesian representation for DNA strings introduced by Nandy [86] and the other inspired on the four-color maps reported by Randic [87]. These two 2D artificial graphs were implemented in TI2BioP to represent DNA and protein sequences as well as the
spectral moments calculations for each type of 2D DNA and protein maps. It is important to highlight that TI2BioP can also import files containing 2D structure inferred by other
professional programs e.g. the RNASTRUCTURE [88] for the calculation of the spectral moments as TIs.
2.3.1. 2D graphical representations of TI2BioP
Cartesian representation for DNA and RNA
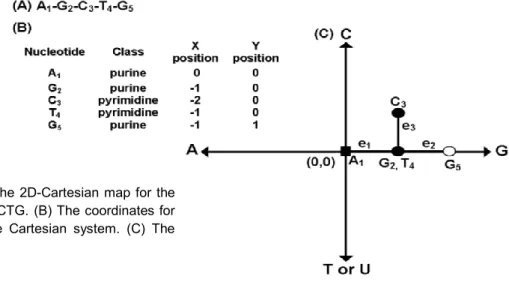
We used the Cartesian representation reported by Nandy for the calculation of the spectral moments as TIs [86, 89]. This 2D representation is obtained by arranging a DNA primary sequence into a 2D Cartesian system following the sequential appearance of its bases. Purine and pyrimidine bases are placed on the Cartesian system by assigning them to X and Y axes, respectively. The representation is built by adding the k-th nucleotide of the DNA sequence to the coordinates (0, 0) of the Cartesian system. The first nucleotide is placed in the origin of the Cartesian system (0, 0) and it is represented as a square dot (figure 2.3.1). The value (1, 0) is assigned if the (k + 1)-th nucleotide is Guanine (rightwards-step); (-1, 0) if Adenine (leftwards-(rightwards-step); (0, 1) if Cytosine (upwards-step) or (0, -1) if the (k + 1)-th nucleotide is Thymine or Uracil (downwards-step) in the case of RNA sequences. The resulting path gives the overall graphical representation of DNA, though the information on the individual steps has been lost. The 2D Cartesian map for the sequence (AGCTG) is showed in the figure 2.3.1C; note that the central node contains both Guanine and Thymine nucleotides.
Figure 2.3.1.Building the 2D-Cartesian map for the
(A) DNA fragment AGCTG. (B) The coordinates for each nucleotide in the Cartesian system. (C) The 2D-Cartesian map
Cartesian representation for proteins
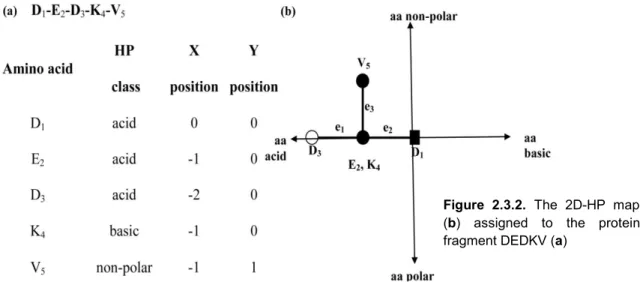
This representation is based on the graphs introduced by Nandy for DNA sequences described above but instead of using the four nucleotides assigned to each axe direction in the Cartesian space, all twenty amino acids were grouped into four groups: acid, basic, polar and non-polar amino acids [90]. These four groups characterize the physicochemical nature of the amino acids in terms of hydrophobicity (H) and polarity (P) [91]. Each amino acid in the sequence is placed in a Cartesian 2D space starting with the first amino acid at the (0, 0) coordinates. The coordinates of the successive amino acids are calculated as follows:
a) Decrease by –1 the abscissa axis coordinate for an acid amino acid (leftwards-step) or:
b) Increase by +1 the abscissa axis coordinate for a basic amino acid (rightwards-step) or:
c) Increase by +1 the ordinate axis coordinate for a non-polar amino acid (upwards-step) or:
d) Decrease by –1 the ordinate axis coordinate for a polar amino acid (downwards-step).
Similar to 2D-Cartesian maps for DNA, more than one amino acid could be assigned to one node in the protein map. The information contained in the linear sequence is arranged into a 2D space of hydrophobicity and polarity (2D-HP) according to the sequence order and amino acid composition of proteins. 2D-HP protein maps provide a topology that depends on these two structural features, sequence order and amino acid composition, the same as to the real secondary structure.
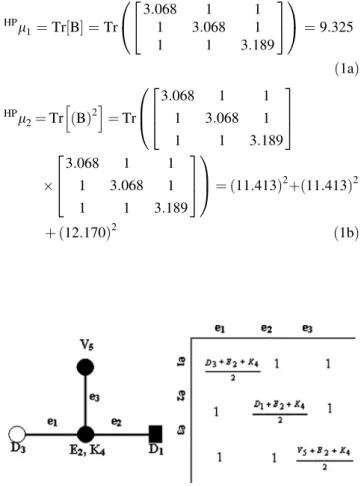
The 2D-HP map of the sequence (D1-E2-D3-K4-V5) is showed in the figure 2.3.2. Please note that the central node contains both E and K amino acids.
Figure 2.3.2. The 2D-HP map
(b) assigned to the protein
FCUP 25
A Graphical and Numerical Approach for Functional Annotation and Phylogenetic Inference
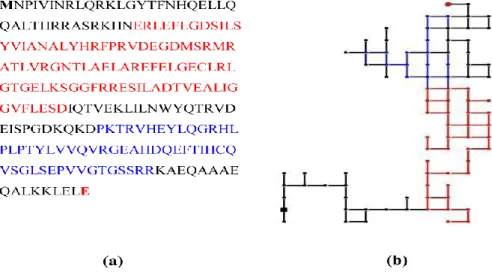
The figure 2.3.3 shows the complete 2D-HP map for the new RNase III member from Escherichia coli BL21 substrain GG1108. Its two major domains are highlighted in red (RNase3 domain) and in blue (double-stranded RNA binding motif), respectively.
Figure 2.3.3. (a) RNase III protein sequence from Escherichia coli BL21 substrain GG1108 (b) 2D-HP map for
the RNase III protein.
Four-color maps for proteins
Protein four-color maps are inspired on Randic‟s DNA/RNA [92] and protein 2D graphical representations [87]; but instead of using the concept of virtual genetic code, we have constructed the spiral of square cells straightforward from the amino acid sequences [21]. The four colours are assigned to the four amino acids classes (polar, non-polar, acid and basic) used previously by our group in Nandy‟s representation for proteins [38, 90] (Figure 2.3.4).
Figure 2.3.4. Steps for the four-color map construction for the first nine amino acids of 1 pdb AMU. (A) The first
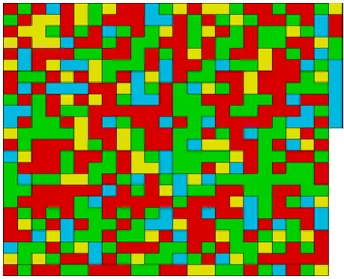
Figure 2.3.5 shows how the four-color map for the first A-domain structurally characterized (pdb 1AMU) is built up. The four colors are associated with each one of the amino acid groups: polar (green), non-polar (red), acid (yellow), basic (blue).
Figure 2.3.5. The final four-color map for pdb 1AMU.
2.3.2. Spectral moments calculation for different 2D graphical representations
Spectral moments for 2D-Cartesian DNA and RNA maps
In order to calculate the spectral moments, an edge adjacency matrix B was assigned to
each graph after the representation of DNA/RNA sequences. B is a square symmetric matrix
whose non-diagonal entries are either ones or zeroes if the corresponding edges (e) share or not one node in the 2D-Cartesian DNA map. These spectral moments are defined as the trace of B as is indicated in the equation below.
k
1k T r Β
μ
Where Tr is called the trace and indicates the sum of all values in the main diagonal of the matrices kB = (B)k, which are the natural powers of B [29]. The different powers of B give rise to the spectral moments series (µ0- µ15). The number of edges (e) in the graph is equal to the number of rows and columns in B but may be equal or even smaller than the number
of nucleotide bonds in the sequence. The main diagonal was weighted with the average of the electrostatic charge (Q) between two bound nodes. The charge value q in a node is
FCUP 27
A Graphical and Numerical Approach for Functional Annotation and Phylogenetic Inference
equal to the sum of the charges of all nucleotides placed on it. The electrostatic charge of one nucleotide was derived from the Amber 95 force field [93].Thus, it sets up connectivity relationships between the nucleotides into the 2D Cartesian map but these interactions are characterized electronically providing a pseudo secondary structure for DNA sequences. When we apply equation 1 for the calculation of µk values, we are considering the topology of DNA pseudo-folding and its electronic features to numerically characterize DNA and RNA sequences; therefore we use the term pseudo-folding spectral moment (pfµ
k) (equation 2)
k
2k
p fμ Tr Β
In order to illustrate the calculation of the spectral moments for this type of representation, an example is developed in section 1.1 of the annexe 3.
Spectral Moments for 2D-Cartesian protein maps
We used the same philosophy for the calculation of spectral moments as TIs described for 2D Cartesian maps of DNA/RNA sequences. They were calculated from the adjacent matrix B which is modified according to the building of the 2D-Cartesian protein map; also
called 2D-HP protein map due to the HP nature of the 2D Cartesian space. Thus, we used this nomenclature (HPµ
k) for the spectral moments series from the 2D Cartesian protein maps or 2D-HP protein maps. These TIs are analogously calculated as the trace of B (equation 2).
We used the same property (electrostatic charge) to weight the main diagonal of B but using
the values for amino acids.
Spectral moments from inferred DNA/RNA secondary structures
In addition to the development of artificial but informative representations for natural biopolymers; there are other approaches for inferring the secondary structure of DNA/RNA molecules. The Mfold algorithm implemented in the RNASTRUCTURE 4.0 software [94], which is based on the minimization of the folding energy (lowest ΔG), is one of the methods to infer DNA and RNA secondary structures. The algorithm generates 2D DNA/RNA maps topologies containing stems and loops formed by possible hydrogen bond interactions between nucleotides placed at middle and long range in the sequence. This graphical information is also provided through the connectivity table (ct files). Ct files contain information about the connection between nucleotides in the secondary structure generated with thermodynamic models [94]. Ct files containing topological information are imported by
TI2BioP to generate the bond adjacency matrix B for the calculation of spectral moments
(mfµ
k), based on folding thermodynamics parameters. The main diagonal was weighted with the average of the electrostatic charge (Q) between two bound nucleotides as described above.
Spectral moments for protein four-color maps
To calculate the spectral moments for protein four-color maps, we considered each map region as a node made up of the amino acids clustering; two adjacent regions of the map sharing at least one edge (not a vertex) are connected. B is calculated in a similar way but
instead of considering the adjacency relationships between edges, it is set up between nodes. The number of nodes or clusters in the graph is equal to the number of rows and columns in B. Since a cluster is made up of several amino acids sharing similar
physicochemical properties, the cluster is weighted with the sum of individual properties (e.g. electrostatic charge (q) [93]) of all amino acids placed in a cluster). The main diagonal of B
was weighted with the average of the electrostatic charge (Q) between two adjacent clusters. The calculation of the spectral moments up to the order k = 3 from the four colours maps using the first nine amino acids of pdb 1AMU (M1V2N3S4S5K6S7I8L9) is illustrated in
details in the methods section of annex 4 [21].
2.3.3. Alignment-free models developed from TI2BioP’s spectral moments
Spectral moments series were used as alignment-free predictors to develop classification models to detect gene/protein members and to calculate alignment-free distances in order to reconstruct phylogenetic relationships at low sequence similarities. The classification models were built up using the following statistical techniques:
Linear Models. General Discrimination Analysis
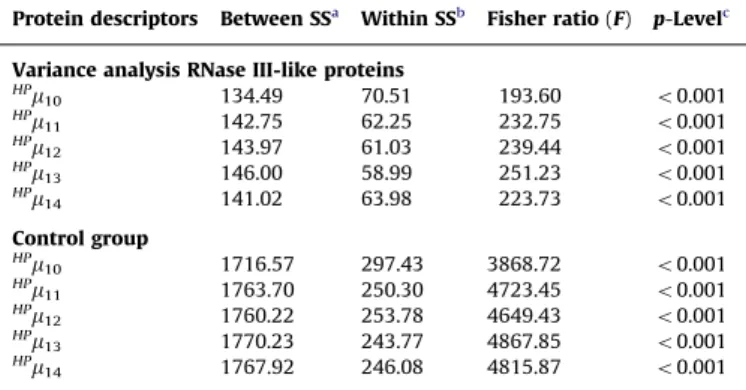
General Discrimination Analysis (GDA) was selected as the linear statistical technique to perform predictors selection (spectral moments from TI2BioP) and to develop alignment-free
models [95-97]. Both, model and variable selection were based on the revision of Wilk‟s () statistics ( = 0 perfect discrimination, being 0<<1). The Fisher ratio (F) was also inspected to indicate the contribution of one variable to the discrimination between groups with a probability of error (p-level) p(F) < 0.05.
FCUP 29
A Graphical and Numerical Approach for Functional Annotation and Phylogenetic Inference
Non-linear models. Decision Tree Models (DTM)
The application of DTM as alignment-free models to protein functional classification and to search for protein signatures was introduced for first time in this work. We used the Classification and Regression Trees (C&RT)-style univariate split selection from the Classification Trees (CT) module of the STATISTICA 8.0 for Windows [98].The Gini index was used as a measure of goodness of fit and the ¨Prune on misclassification error¨ was set up as an stopping rule to select the right-sized classification tree.
Artificial Neural Networks (ANN)
We used the Multilayer Layer Perceptron (MLP) network architecture as the most popular network architecture in use today. The selection of the subset of predictors that were most strongly related to the response variable was supported on the Feature and Variable
Selection analysis of the ANN module from STATISTICA software [98]. The right complexity
of the network was selected by testing different topologies to the MLP while checking the progress against a selection set to avoid over-fitting during the two-phase (back propagation/conjugate gradient descent) training algorithm [99].
Evaluation of Model performance
The performance of all alignment-free models was evaluated by several statistical measures commonly used for classification: accuracy, sensitivity, specificity and F-score (it reaches its best value at 1 and the worst score at 0). The prediction power of such models was evaluated on the test set (this subset was not used to train the model) and the same statistical parameters were applied to show the prediction performance. The area under the Receiver Operating Characteristic (ROC) curve, commonly known as AUC was also calculated for the training and test sets to evaluate the classifier‟s performance (a value of AUC=1.0 means a perfect predictor and 0.5 a random predictor).
Validation procedures
The reliability of the classification models was verified by 10-fold cross-validation (CV) procedure on both training and test sets. The CV statistics for each of the ten samples were averaged to give a 10-fold estimate for the accuracy, sensitivity and specificity for both subsets [100]. The external validation was carried out using the test set as an external set to measure the predictability of the alignment-free models. In addition to this external validation, new gene/protein sequences (not registered in any database) and proteomes were used as real external cases to evaluate the prediction power of the alignment-free
models. The predictability (performance in the prediction) was always compared to alignment classification algorithms either for the test set or for new isolated sequences.
2.4. Alignment-based Methods for Functional Classification
InterPro resource
This tool combines different protein signature recognition methods native to the InterPro member databases into one resource with look up of corresponding InterPro and Gene Ontology annotation. The sequence classification was carried out by the InterProScan tool [101] looking into the InterPro database [102].
Profile Hidden Markov Models (HMM)
Profiles HMM provide a classification model to predict structural and functional attributes for gene/protein families [103, 104]. The HMMER software containing the hmmbuild and
hmmsearch programs, was used to obtain different profiles HMM [46]. Hmmbuild demands
an MSA file obtained by any of the MSA methods that will be described below to build the profile HMM for a certain gene/protein family. The generated HMM profile is used for the hmmsearch to detect DNA/protein signatures against a database.
Basic Local Alignment Search Tool (BLAST)
BLAST is a widely used sequence search method to find matches to a query sequence within a large sequence database, such as Genbank. Although BLAST does not generate a predictive model as profiles HMM; it can be used for classification purposes. The similarity of a query sequence to others already annotated in a database is measured through a goodness score (S) and an estimate of the expected number of matches (E-value) with an equal or higher score than would be found by chance. Whether the query sequence is similar enough (positive) or not to others registered is decided based on the score and E-value threshold [47].
In this work we used two types of BLAST:
1. BLASTn search (E-value cutoff = 10e-10) against the NCBI database to contrast the annotation of a new ITS2 genomic sequence.
2. A multiple-template BLASTp reported by the NRPS-PKS database developers for NRPS (Adenylation (A), Condensation (C) and Thiolation (T)) domains searches was
FCUP 31
A Graphical and Numerical Approach for Functional Annotation and Phylogenetic Inference
used [52]. Multiple-template BLASTp consist in using each one of the (A, C and T) domain sequences as template to evaluate each query of a certain database by BLASTp (E-value=10) using BLOSUM62 scoring matrix and default values for gap penalties. The best matches under these conditions were retrieved. Namely, we used it to search the A-domain signature against the proteome of the cyanobacteria Microcystis aeruginosa.
2.5. Experimental validation
Although, the prediction performance of our alignment-free models in respect to alignment classification methods was assessed using a characterized test set, new isolated sequences were evaluated by both approaches as well as the re-annotation of the cyanobacteria Microcystis aeruginosa proteome. New sequences were registered at Genbank if at least two models (alignment-free models and alignment algorithms) agreed in the prediction; if they disagreed then an in vitro experimental test was used for a definitive functional annotation. A general experimental procedure was followed to isolate new gene/protein members that were used in this further external validation. A new member from the ITS2 genomic and the RNase III protein classes was isolated, respectively as follows:
1. DNA extraction from Escherichia coli and the fungus Petrakia sp.
2. PCR amplification of the ITS2 genomic sequence from Petrakia sp. and amplification of E. coli RNase III gene from Escherichia coli BL 21 strain CG 1208
3. Sequencing of both PCR products
4. Purification and enzymatic assay of recombinant E. coli RNAse III
The isolation, expression and the cryptic bactericide function of the Cry 1Ab C-terminal domain from Bacillus thuringiensis´s endotoxin was indirectly included in this work because its sequence was used to evaluate the bacteriocin alignment-free model. Its bactericide function was unraveled by the author of this thesis under the supervision of Vázquez-Padrón R.I in 2004 [105].
2.6. Phylogenetic analysis
We have declared the hypothesis that our TIs are not only useful for functional classification of gene/protein classes but also to infer phylogenetic relationships. So, we used distance-based methods to reconstruct phylogenetic relations among different fungal classes applying the ITS2 biomarker. The taxon of interest was the fungus Petrakiasp. Phylogenetic trees were constructed using the Neighbour-joining (NJ) method. NJ trees
were generated from different sequence distance matrices: (1) alignment-based and (2) alignment-free distances
1. Alignment-based distances: Evolutionary distances computed using Jukes-Cantor (JC), Kimura2-parameter (K2P) and Maximum Composite Likelihood (MCL) substitution models were obtained using the MEGA4.
2. Alignment-free distances: Euclidean distances (Ed) were computed from TIs values of sequences involved in the analysis, whereas phylogenetic trees were obtained by applying hierarchic clustering methods (furthest neighbor linkage). The validation of the classical NJ trees was mainly supported by bootstrap values and hierarchic clusters were validated by the cophenetic correlation coefficient. The topology consistency of both trees was also evaluated using other distances.
Multiple sequence alignment (MSA) methods
We used several MSA methods for different purposes; either to build profiles HMMs to search for a certain gene/protein signature in a sequence database or to carry out phylogenetic analyses. Depending on the sequence similarity degree of the gene/protein families involved in the study, different MSA methods were applied, such as:
1. CLUSTALW: It uses progressive alignment methods, then progressively more distant groups of sequences are aligned until a global alignment is obtained [58]. 2. DIALIGN-TX: DALIGN-TX is a segment-based multiple alignment tool improved
for sets of low overall sequence similarity [60].
3. MAFFT: Multiple Alignment (MA) based on fast Fourier transform (FFT), in which an amino acid sequence is turned into a sequence composed of volume and polarity values of each amino acid residue. It is suitable for sequences having large insertions or extensions as well as for distantly related sequences of similar lengths [106].
CLUSTALW and DIALIGN-TX were run using the default parameters. In the case of MAFFT, the iterative alignment option (L-INS-I) was used [40, 41].
FCUP 33
A Graphical and Numerical Approach for Functional Annotation and Phylogenetic Inference
3. Results
In this section, the results are supported by the four articles published by the author during the thesis period. Each one of the author‟s papers is attached under the heading ANNEXES at the end of this manuscript. They are organized from the TI2BioP version 1.0
implementation until its latest version 2.0 available at http://ti2biop.sourceforge.net/. Both
software versions were applied to the gene/protein families in the same order given in the introduction. Pages belonging to the published works keep the actual journal numbering while thesis s sections follow the appropriate numeration system.
The results presented herein are related to the application of TI2BioP to the functional
classification of proteinaceous bacteriocins, RNase III, ITS2 and NRPS A-domains. All these classes show high sequence divergence among their members and are related to the drug discovery process either by providing secondary metabolites with biological activities (bacteriocin and NRPS) or by representing drug targets (RNases III). The methodology was also useful to develop alignment-free based techniques applied to phylogenetic inference to complement the taxonomy of the Petrakia sp. fungal (putative producer of bioactive compounds) isolates using the ITS2 biomarker.
In general, all papers contain the development of alignment-free models using different statistical classification techniques and the TIs generated by TI2BioP as input predictors, for
functional annotation of the families mentioned above. These models were built with linear and non-linear statistical techniques and validated by cross and external validation procedures. The applicability of the models was demonstrated by detecting new members belonging to each gene/protein class, which were supported by experimental evidences and by classical alignment methods. Table 3.1 shows the best reported alignment-free model for the functional classification of each gene/protein family involved in the study and the procedure carried out to achieve the functional annotation of new members by such models, in cooperation with experimental evidences and alignment procedures. The performance of the alignment-free models was always contrasted with classical alignment procedures such as InterPro and profiles HMM for functional detection of the chosen gene/protein classes (Table 3.2). The graphical approach TI2BioP was used to visualize functional relationships
studied. New detected members of each gene/protein class and the procedure carried out for their functional annotation.
Table 3.2. Prediction performance measured through the sensitivity on the test set and the identification of the new member for the best reported alignment-free and alignment-based method. When alignment-based procedures achieved a sensitivity of 100%, complex algorithms were applied.
Alignment-free models Alignment-based procedures
Gene/protein
class Technique Statistical Sensitivity Test set
New Member Prediction
Alignment
algorithm Sensitivity Test set
New Members Detection Protein
Bacteriocins GDA 66.67% Significant hit InterPro 60.2% No-hit
Genomic
ITS2 ANN 92.59% Significant hit
Profile HMM
(MAFFT) 66.66%
Significant hit
RNase III DTM 96.07% Significant hit Profile HMM
(modified) 100%
Significant hit
A-domains
NRPS DTM 100% Significant hits profiles HMM 100% Significant hits
Gene/protein
class Control Group
2D-Graph Type Best-Reported Alignment-Free Model New Detected
Members Annotation Procedure Protein
Bacteriocins domains Cartesian CATH GDA
Cry 1Ab C-terminal domain Bacillus thuringiensis 1- Alignment-free prediction 2- Experimental evidences Genomic
ITS2 3´UTRs 5´and
Cartesian and Mfold ANN ITS2 genomic Petrakia sp. 1-Alignment-free prediction 2- Homology-based prediction RNase III Non-redundant subset (enzymes and non-enzymes) PDB
Cartesian DTM E coli BL21 substrain Rnase III CG 1208 1- Alignment-free prediction 2- Homology-based prediction 3- Experimental evidences A-domains
NRPS domains CATH color map Four- DTM
5 hits in the proteome of Microcystis
aeruginosa