Copyright © 2018 The Author(s). Published by VGTU Press
This is an Open Access article distributed under the terms of the Creative Commons Attribution License (http://creativecommons.org/licenses/by/4.0/), which permits unre-stricted use, distribution, and reproduction in any medium, provided the original author and source are credited.
2018 Volume 22 Issue 1: 1–11 https://doi.org/10.3846/ijspm.2018.317
*Corresponding author. E-mails: [email protected] or [email protected]
CLASSIFICATION AND SELECTION OF TENANTS IN RESIDENTIAL REAL
ESTATE: A CONSTRUCTIVIST APPROACH
Manuel B. C. B. F. FONSECA1, Fernando A. F. FERREIRA1,2,*, Wenchang FANG3, Marjan S. JALALI1
1 ISCTE Business School, BRU-IUL, University Institute of Lisbon, Avenida das Forças Armadas, 1649–026,
Lisbon, Portugal
2 Fogelman College of Business and Economics, University of Memphis, Memphis, TN 38152–3120, USA 3 Graduate School of Business Administration, National Taipei University, 69, Sec 2, Jian-Kuo N. Rd,
Taipei City 10433, Taiwan ROC Received 24 October 2016; accepted 1 June 2017
Abstract. Choosing a tenant is a key issue in the housing rental market. Knowing, a priori, whether a tenant will pay the
rent on time, be able to hold a good relationship with the neighbors or take care of the property (i.e. whether s/he will be a “good” tenant) is not a simple endeavor. It is crucial, however, as it can help save time, money and conflicts that can end up in court. This study aims to address this issue, through the integrated use of cognitive maps and the Decision EXpert (DEX) technique. Grounded on a constructivist logic, the study brought together a panel of experts with experience and knowledge in the residential rental market, in order to identify and articulate the criteria to be taken into account in the classification and selection of tenants. The results achieved show that the integration of these two methodologies (i.e. cog-nitive maps and DEX) can help increase our understanding of the decision problem at hand, and lead to more informed and potentially better tenant choices. Advantages and limitations of the framework are also discussed.
Keywords: decision making, real estate market, classification and selection of tenants, cognitive maps, decision EXpert
(DEX).
Introduction
The recent economic crisis significantly affected Europe, driving down almost all economic activities; and the real estate industry was no exception. This is of relevance, because the real estate market not only has an undeni-able importance for economic development, but is also a cornerstone of other economic activities: the real es-tate market provides shelter to other domestic services (Goodhart & Hofmann, 2007). Although signs of recov-ery from the crisis are beginning to emerge, the unique characteristics of the conjuncture it created in the real estate market cannot be overlooked, namely: a lack of li-quidity; heterogeneity of assets; and decreasing sales in almost all segments of the real estate industry (Cheng, Lin, & Liu, 2008; Lin & Liu, 2008; Cirman, Pahor, & Ver-bic, 2015). In the residential rental market, in particular, understanding these unique characteristics is important to ensure minimum rent/price volatility, regardless of the economic conjuncture.
In practical terms, the source of income of a rented house is the tenant. As such, it is a major concern for the landlord to ensure that s/he should choose the best pos-sible option available (i.e. a tenant who pays the rent in full, on time, and takes care of the property). This is not an easy endeavor, however. Knowing, a priori, whether someone will be a “good” tenant is very difficult, due to asymmetric information. Indeed, it is typically only after the tenant actually lives in the property that this asymme-try is reduced, and it is possible to know whether s/he was a “good” choice. Notwithstanding, decision support can be provided for landlords, in terms of tenant selection, before signing the rental contract, as is the aim of the current research. Grounded on a constructivist standpoint, and a process involving face-to-face meetings with an expert panel of landlords and real estate agents, this study aims to provide support for the classification and selection of tenants in the residential rental market.
Due to the complexity and ill-structured nature of this decision problem, the methodology chosen relies on the combined used of the Strategic Options Development and Analysis (SODA) approach (Ackermann & Eden, 2001), which is based on cognitive mapping, and the Decision EXpert (DEX) technique (Bohanec & Rajkovic, 1999). The integrated use of these two operational research (OR) methods should allow the problem at hand (i.e. the clas-sification of tenants in the residential rental market) to be structured and clarified, using the knowledge and expertise of the expert panel members to: (1) define and articulate the criteria to be taken into account in the selection and classification of tenants; (2) group the criteria by clusters and define aggregation rules; and (3) apply and validate the appraisal system created in a real-world context. By allowing for more informed and defensible decisions, we expect that the evaluation system proposed in this study can contribute to reducing conflicts between tenants and landlords in the residential rental market.
The remainder of the paper is organized as follows. The next section presents the literature review, so as to provide the framing of the study. Then, the theoretical background of the techniques applied is provided, fol-lowed by the methodological procedures undertaken, the model created and the results obtained, highlighting new insights and practical implications. The final section con-cludes the paper, highlighting the study’s contribution and limitations, and presenting avenues for future research.
1. Literature review
Although it is the foundation of almost all the other mar-kets, the real estate market is quite distinct from other economic activities, in particular due to “the fact that its
‘product’ is not portable” (Case, Goetzmann, &
Rouwen-horst, 2000, p. 2). Yet, as noted by Carter (2011, p. 159),
“acquiring shelter is an economic activity in which virtually all members of society participate, either in the rental or owner-occupied markets”. This is true not only of
individu-als, but also organizations, such as firms, hospitindividu-als, police departments, government buildings and farms, among many others, that depend on the real estate market to physically exist. The real estate market is not only a basis for other economic activities, but also plays a decisive role in the world economy. As Poterba, Weil, and Shiller (1991, pp. 145-146) note, “house prices are of more than
conver-sational interest to economists. Owner-occupied housing accounts for a greater fraction of household net worth than corporate equity. […] Movements of real house prices have large effects on household wealth, and potentially on con-sumer spending. High house prices relative to buildings costs also call forth increased construction activity and channel resources to the building sector”. The real estate market can
thus impact people’s lives, families, companies, as well as banks (cf. Goodhart & Hofmann, 2007), and may arguably be considered the most important market of all.
In broad terms, the real estate market refers to the trad-ing of real estate (Maier & Herath, 2009), and can assume
three main forms: (1) commercial (e.g. warehouses and re-tail stores); (2) industrial (e.g. factories, mines and farms); and (3) residential (e.g. undeveloped land, houses and town-homes). Within the last form (i.e. residential), there are two options: sale and rent; and the decisions surrounding them are not always easy. Hjalmarsson, E. and Hjalmarsson, R. (2009, p. 215) note that “the buy versus rent decision is a
very large one for most households, and may depend on many factors, not all of which are of a financial nature”. The focus
in this study will be on the rental market.
Within this submarket, the tenant can plausibly be considered the most important stakeholder, because s/he: (1) serves as the property’s source of financial income; (2) interacts with other market players, such as landlords, oth-er tenants and real estate agents; and (3) is the one respon-sible for taking care of the rented property. It is easy to see, then, why tenant choices matter. No landlord wishes to bear the problems that a “bad” tenant can bring, in par-ticular since the relationship between tenant and landlord is often expected to be long term. In fact, it begins before the contract is even signed, and continues through rents paid, services and upgrades, until the tenant leaves (Lars-en & Sommervoll, 2009; Gbadegesin & Oletubo, 2013).
This long-term relationship can be seen as a good investment if it is with a “good” tenant – it ensures the property is looked after, good relations are maintained, and substitution costs, such as search and contract reno-vation costs, are avoided. These transaction costs suggest avoiding turnover is generally in the landlord’s best in-terests. Contractual clauses aside, one of the best ways to accomplish this objective is to choose the “right” tenant (cf. Miceli & Sirmans, 1999). Indeed, it can be argued to be even more important than contractual clauses, because these take time to be drawn up, negotiated and agreed upon, and can be costly to enforce if disputes end up in court. Olawande (2011, p. 4) reinforces this view: “tenant
selection is the most important aspect of successful property management. […] Most mistakes can be corrected; however, putting wrong tenant in possession can not only cost lots of money, but also endless frustration. [...] Without proper screening procedures, the agents and owners can find them-selves stuck with potentially bad tenants”.
It is unsurprising, then, that this topic has attracted researchers’ attention. Indeed, there have been several contributions on this topic in the literature, from areas ranging from marketing, consumer behavior and psy-chology to finance (Anikeeff, 1996; Chye, Chin, & Peng, 2004; Burnaz & Topcu, 2011; Ju, Wenbin, & Bei, 2011; Baklouti, 2014), and using different methodologies. These studies have allowed several determinants able to predict a “good” tenant to be identified, namely: the tenant’s an-nual income, credit access and psychological profile (cf. Olawande, 2011); as well as demographic factors such as: age, gender, social class, marital status, and number of dependents, among others (Jackson, Jones, & Balsmeir, 1986; Yau & Davis, 1994; Olawande, 2011; Gbadegesin & Oletubo, 2013). Table 1 summarizes some of these studies, highlighting their contributions and limitations.
The contributions presented in Table 1 are representa-tive of the importance of the research topic at hand; but, as the table also shows, are not without their limitations. In particular, statistical data is required in most cases for a good selection and classification of tenants; and there are practical difficulties in defining evaluation criteria and the trade-offs among them. Thus, there appears to be room for further research into the field.
Taking into account the baseline convictions of the multiple criteria decision analysis (MCDA) approach (i.e. the interrelation between objective and subjective crite-ria in the decision-making framework, learning through participation, and constructivism) (for deeper discussion, see Bana e Costa, Stewart, & Vansnick, 1997; Belton & Stewart, 2002), this study resorts to the combination of cognitive mapping and DEX to create a more complete and reliable evaluation system for the classification and selection of tenants, able to overcome some of the limita-tions of the existing contribulimita-tions.
2. Methodology
2.1. Background on cognitive mapping
As already pointed out, this study assumes the baseline convictions of the MCDA approach. According to Bana e Costa et al. (1997) and Belton and Stewart (2002), the decision-making process is usually divided into three stag-es, namely: (1) the structuring phase, where the objective is to gather and shape the decision makers’ value
judg-ments and preferences in order to structure the decision problem at hand; (2) the evaluation phase, in which an evaluation model that represents the experts’ preferences is built; and (3) the recommendations phase, in which rec-ommendations are provided based on the framework cre-ated and the discussion underlying its development. One of the most common methods used during the structuring phase is SODA (Ackermann & Eden, 2001; Eden & Ack-ermann, 2001), which is grounded on cognitive mapping and helps individuals to project and explain the way they see a decision problem (Shaw, Ackermann, & Eden, 2003; F. Ferreira, Jalali, Bento, Marques, & J. Ferreira, 2017a).
Lima (2003) refers to human cognitive process as a set of mental activities such as thinking, imagination, mem-ory and problem solving, which occur differently from individual to individual, according the way these indi-viduals perceive and interpret real-world phenomena and respective decision situations. This interpretation of reity can be made explicit by cognitive mapping, which al-lows cause-and-effect relationships between concepts to be identified and modeled (Eden, 1988; Kwahk & Kim, 1999; Ferreira, Jalali, Zavadskas, & Meidutė-Kavaliauskienė, 2017b). This technique also allows for in-depth discus-sion among different decidiscus-sion makers, generating large amounts of data and information on the decision situa-tion at hand (Montibeller, Ackermann, Belton, & Ensslin, 2008). As a problem-structuring methodology, cognitive mapping has been widely applied in different decision sce-narios, and its main advantages result from its ability to help: (1) structure complex decision problems; (2) increase
Table 1. Classification and selection methods: contributions and limitations
Authors Method Contribution / originality Limitations acknowledged by the author/s Jackson et al.
(1986) Probit Analysis Classification of tenants based on their probability of being accepted or rejected for federally subsidized housing.
The specificity of the sample does not allow for the generalization of results.
Yau and Davis
(1994) Tenant Selection Decision Support System (TSDSS)
Uses multiple criteria analysis for the classification and selection of tenants for a shopping mall.
Model created for shopping mall tenants, requiring adaptations to be used by different decision makers and in different real estate contexts. Aickelin and Dowsland (2002) Enhanced Direct and Indirect Algorithm
Uses a model for classification of commercial tenants to solve a mall layout and tenant selection problem.
Difficulty in defining the weights of the selected variables.
Furick (2006) Neural Networks Application of reports and credit scores to the residential real estate market in order to create a model that can forecast future tenant behavior.
The sample is not random and is centered on a specific apartment complex located in a specific city.
Zu, Wu and
Wang (2010) Extended Bayes Model The weights of the attributes are changed in the Bayes model depending on their effect on the classification.
The model is used for clients (and not for tenants).
Olawande
(2011) Analytic Hierarchic Process (AHP)
Uses AHP to select tenants. The study is conducted in Nigeria, with criteria defined by a panel of Nigerian experts. As such, some of the criteria are related to cultural aspects, and the results cannot be extrapolated. Gbadegesin and Oletubo (2013) Hierarchical Cluster Analysis (HCA)
Uses HCA to determine which are the most important criteria in tenant selection and highlights the fact that one should take into account several criteria when selecting tenants.
The study is conducted in just one city, Ibdaban.
understanding of decision situations; (3) manage large amounts of data; and (4) contribute to reduce the rate of omitted criteria in the decision-making framework (Bel-ton & Stewart, 2002; Montibeller et al., 2008). As a result,
“both transparency and understanding of the decision prob-lem” are typically increased (F. Ferreira, Marques, Bento, J.
Ferreira, & Jalali, 2015b, p. 2693).
In practical terms, a cognitive map consists of chains of concepts connected by arrows, which represent the cause-and-effect relationships between them (Eden & Ackermann, 2004). Figure 1 exemplifies part of a cogni-tive map.
As shown in Figure 1, the arrows can present positive (+) or negative (–) signs, depending on the type of relation-ship between concepts: “a positive relationrelation-ship occurs when
a change in a predecessor concept causes a similar change in the successor: an increase (decrease) in the first causes an increase (decrease) in second. With a negative relationship, an increase (decrease) in the predecessor causes a decrease (increase) in second” (Klein & Cooper, 1982, p. 64).
Although subjective in nature, such maps can be of great use in organizing and structuring complex decision problems, enabling different perspectives to be considered and harmonized based on discussion and exchange of ex-periences among decision makers (for developments, see Belton & Stewart, 2002; Eden, 2004; Eden & Ackermann,
2004; Montibeller et al., 2008 and F. Ferreira,Spahr,
Sun-derman, Banaitis, & J.Ferreira, 2017c).
2.2. The DEX approach
The second phase of the MCDA approach is the evalua-tion phase. In this phase, after understanding and struc-turing the decision problem, the experts’ value preferences
are gathered to construct an evaluation model (Belton & Stewart, 2002). In this study, the model was built follow-ing the procedures of the DEX technique (Bohanec & Ra-jkovic, 1999), which uses qualitative attributes with dis-crete scales that consist of words instead of numbers to sort choice alternatives. The technique thus allows for the combination of MCDA, expert systems, machine learn-ing and fuzzy logics, holdlearn-ing great potential when deal-ing with uncertain or missdeal-ing data (Bohanec & Rajkovic, 1999). Taskova, Stojanova, Bohanec, and Dzerpski (2007, p. 480) note that the DEX technique is “particularly
suit-able for a hierarchical decomposition of evaluation problems that require judgment and qualitative reasoning”.
Technically, DEX uses decision rules to obtain value functions (Bohanec, 2014), which are responsible for
ag-gregating combinations of lower-level attributes (i.e. Xi) into
an upper-level criterion Y, as shown in formulation (1):
f.X1 × X2 × …. × Xn → Y. (1)
In practice, this utility function maps all the combina-tions of lower-level attributes into an aggregate evaluation criterion Y. The mapping is presented in a table where each row (i.e. decision rule), provides the value of f for one combination of lower-level attribute values. This is com-monly defined as an if–then rule, according to formulation (2) (cf. Bohanec, 2014):
1 1 2 2 n n,
if X value and X= =value and and X… =value
(
)
.
thenY value or valueinterval= (2) Overall, the DEX models are comprised by: (1)
attrib-utes (i.e. variables that represent the basic characteristics
of the choice alternatives); (2) scales, which should be
Source: Eden (2004, p. 675)
Figure 1. Example of a cognitive map [partial view]
150 management of the competition 32 mktg find gaps in mkt place continuously 58 reactive frame of thinking ... more proactive 56 mktg help in assessment of acquisitions, launches ... just do prom work 151 mktg dept
out more ot what competition is doing
208 work on a launch on a full time basis ... normal product &
launch 83 mktg help develop new products ... concentrate on successful products 234 using mktg for developmental work ... using outside agency for developmental work 17 mktg and provide full media
planning support 147 mktg involved
with long term thinking ... firelighting, short termism 63 better product differentiation 149 motivation ot mktg dept 160 product mgrs take their work to outside consultants ... use expertise 11 mktg dept seen usefui, responsibie consultants ... seen as gophers 202 provide more fundamental support to customer ... sales support work
112 sales bring big customers
to meet mktg dept 66 product mgrs will take unilateral action to solve mktg problem 171 route into promotions area 107 understanding of mktg depts role
qualitative and ordered preferentially, either in decreas-ing or increasdecreas-ing order; (3) a hierarchy of attributes, which represents the decomposition of the decision problem and the relationships between attributes; and (4) decision rules, used to evaluate attributes (Bohanec, Rajkovic, Zupan, & Bratko, 2013). The simplicity of DEX, its use of qualita-tive modeling, the fact that its application involves acqualita-tive support from a facilitator, make the technique ideal to tackle essentially qualitative, ill-structured, real-life deci-sion problems (Bohanec & Rakjovic, 1999; Bohanec et al., 2013), as is the case of the classification and selection of tenants in the residential rental market. In operational terms, DEX is supported by an interactive software pack-age called DEXi, which, according to Bohanec et al. (2013, p. 2), is “extremely useful even for most difficult
decision-making tasks”.
3. Application and results
As noted above, the aim of this study is to develop a framework to assist decision making in what pertains to residential tenant selection. The goal is thus to develop a multiple criteria evaluation model for this purpose; and in doing so, assessing the applicability of the combined use of the SODA and DEX methodologies for this purpose.
Following the premise that decision-making groups
“should have between 6 and 10 key individuals” (Eden &
Ackermann, 2004, p. 618), the expert panel in this study was composed of six participants with ages ranging be-tween 29 and 70 years old. The participants all had exper-tise in the residential rental market: four were landlords with practical experience in short- and long-term rental contracts, and two were professional real estate agents, op-erating in the city of Lisbon, Portugal. It is worth noting that, due to the constructivist and process-oriented nature of our framework, when correctly adjusted, the proce-dures followed can work well with any other expert panel (cf. Belton & Stewart, 2002; Ferreira et al., 2017c). Two group meetings, with an average duration of four hours each were carried out, guided by two experienced facilita-tors, who coordinated the negotiation process between the panel members. The first session pertained to the structur-ing phase, as described below.
3.1. Developing the cognitive map
The first stage of the MCDA approach – the structur-ing phase – is intended to clarify the problem, and allow participants’ points of views to be considered and ana-lyzed for model building. Following the guidelines set out by Ackermann and Eden (2001), Eden and Ackermann (2001), Ferreira (2016) and Jalali, F. Ferreira, J. Ferreira, and Meidutė-Kavaliauskienė (2016), and in order to avoid misunderstandings, the first group session started with a presentation of the research objectives and methodological procedures to be applied. Participants were then presented with the following trigger question: “Based on your values
and personal experience, how do you identify an excellent tenant?”, which served as the starting point for discussion
and allowed the “post-its technique” to be applied (Ack-ermann & Eden, 2001; Eden & Ack(Ack-ermann, 2001). This technique operationalizes the SODA approach through the use of post-its, on which each decision maker writes the criteria that s/he considers pertinent in responding to the decision problem presented, with the rule that there should only be one criterion per post-it. A fundamental aspect of this process is the underlying discussion among the panel members, such that each criterion put forth, its meaning and implications are thoroughly debated.
Once the panel feels they have achieved “saturation” in the identification of criteria, they are asked to group them into clusters. In the current study, three main clusters were identified: Guarantees and Financial Indicators; Owner’s
Ini-tial Analysis/Feeling; and Tenant Profile, with Tenant Profile
then divided into three sub-clusters: Behavioral Aspects;
Physical Aspects; and Family Issues. In the final part of this
first meeting, the decision makers were invited to perform a mean-end analysis and regroup the post-its (i.e. criteria) within each cluster, according to their relative importance. Figure 2 presents two snapshots of different stages of this structuring process, which are important to demonstrate the dynamics behind the application of the post-its technique.
Using the Decision Explorer software (www.baxia. com), a group cognitive map was then created based on the application of the post-its technique. Figure 3 illus-trates the final version of this map, which was presented, analyzed, discussed and validated by the decision makers.
1 Best T
enant
2 Guarantees and Financial Indicators
3 Owner Initial Analysis / Feeling
4 T enant Profile 5 F amily I ssues 6 Ph ysical Aspects 7 Behavorial Aspects 8 P
ays Always on Time
9 Income 10 Last Y ear T ax Income 112 Last Salar y Receipts 12 Bank Guarantee 13 Gives a Deposit of M ore Than 2 Months
14 Readiness in Come up with 2 or more
Guarantors 15 Down P ayment of Rents Agreeded on the Contract 16 Income T ax From Last 3 Y ears 171 Y ear P ayment U pfront 18 U pfront P ayment of Rents 19 Income T ax
Evidence that Proves Possibility of Rent
Payment
20 Guarantees
21 Shows Declaration with N
o T ax Debt 23 H as a Guarantor 24 Retired W ith High Income 25 A ccepts P enal Clauses on the Contract 26 U nemployment 27 U nemployed W ithout Income 28 A
ccepts Contract Clause with Immediate Termination on the First M
onth of N on-P ayment 29 Employed in a Trustworth y Compan y
that Ensures Salar
y
30 Statement of Bank
Account
31 Shows Employment Contract with Identification of
Time
32 Rent Assured by Employer (Private Compan
y or Public Entity) 33 Stable Professional Status 34 Several Sources of Income 35 A vailability to
Raise the Deposit
Value 36 Biggest Rent Offered 37 M odels of T enants
Defined by Real Estate Agencies
38 2 to 3 M onths of Rent U pfront 39 N umber of P eople in the H ousehold 40 H ousehold Compatible W ith the Typolog y 41 1st Family H ouse
42 Children Studys - Location of Schools
43 N umber of Children 44 Animals 45 T oo Man y Animals 46 A ppearance 47 Aspect 48 Age 49 N eat 50 Dodg y / Sleazy Look 51 Gypsy 52 Black 53 P
ersonal Analysis to the P
otential Tenant 55 Feeling 57 Purpose of the H ouse 58 U
nwillingness to Present Bank References
59 Sounding 60 Empaty Between Landlord and T
enant
61 Desired Time for
the Renting
62 Referred / Known by Someone Who Can Prove H
onesty
63 A
vailability to
Facilitate the Requested Information
64 E
valuation Thru
Research on the Last Known A
dress 65 K eeping the H omogeneity in the Building 66 Several H ouse M
ovings in the Same
Area
67 Feedback
68 Being Owner of Rented Real Estate
69 "Smelled Bad"
70 Location of the House in Relation to W
ork / School
71 V
alue H
e Can
Afford For the Rent
72 Wh y this Area? 73 "Smelled Good" 74 Experience 75 I dentification Strateg y 76 Entusiasm T owards the H ouse 77 Priority to First Comers 78 W ants the H ouse Furnished 79 Information From Friends or Acquaintances 80 H as a Maid / H ousekeeper 81 Interest in H ouse N
eeding Construction Work, with Rent A
justment 82 A ccepts Increase of Rent to Assure the H ouse 83 H ousehold Professional Stability 84 Sense of Discipline 85 B ehavior and
Posture During the Inter
view / T our 86 Civism 87 Dubious Lifestyle 88 E thics 89 P ersonal Inter view 90 Antagonistic on 1st A pproach 91 Makes P ositive References to Family
, Friends and Lifestyle
92 M
oral Conduct
93 In
volves Family
and Friends in the House Selection
Process
94 Doesn't Show
Esteem for the H
ouse
95 V
alues the H
ouse
Because it's Close to W
orkplace,
School, F
amily
-Visibility Before His Sphere of Influence
96 Presents
Declaration From Previous Landlords
97 B
eing Thorough in
the Analysis of the House and Show Concern A
bout the Maintenence of the Property 98 H abits and Customs 99 Bad H abits 100 Started to W ork
Recently in the Area
101 Curious and Wants to Know the
Landlord
102 A
vailable to
Reply to Questions About H
ousing
Histor
y (Rent or
Personal)
103 Doesn't Question Extremists T
opics
104 Blacklist of Telecom Operators
105 Blacklist (Doesn't P ay W ater / Electricity / etc) 106 Questionable H abits 107 Looks in the E ye
and Answers Questions
108 W ork Location 109 Sought T ypolog y 110 Priorities
111 Distance From Work to the H
ouse
112 H
as Informations
of the Last Place H
e Lived as T enant 113 J ob W ith Public Exposure 114 W
ants Fitted Kitchen
115 Renting by
Geographical Areas of the H
ousehold
116 Contract in Behalf of Other Member of the Household
117 Alcoholism
118 Drugs
119 Knowledge A
bout
Societies and Ethnicities
120 T enant P ays Rental Insurance 122 Bank Guarantee 123 Reasons Wh y Tenant is Looking for H ouse
124 Analysis in an Improvise Context
-Figur e 3. G ro up cog ni tiv e m ap
Following the methodological guidelines provided by Keeney (1992, 1996), a value tree was constructed based on the collective cognitive map, as shown in Figure 4. Al-though not always a smooth transition (for discussion, see Ferreira, Santos, Rodrigues, & Spahr, 2014; Ferreira, Jalali, Meidutė-Kavaliauskienė, & Viana, 2015a; Filipe, Ferreira, & Santos, 2015; Gonçalves, Ferreira, Jalali, & Meidutė-Kavaliauskienė, 2016; Jalali et al., 2016), this step of the process proved very valuable and was considered of ex-treme importance by the participants involved.
The first criterion in Figure 4, CTR1 – Guarantees and
Financial Indicators – refers to the financial guarantees the
tenant is able to present before signing the rental contract, such as tax returns for the previous three years, pay slips,
sta-ble professional situation or other evidence indicating ability to pay the rent. CTR2 – Owner’s Initial Analysis/Feeling –
encompasses issues such as reasons why the tenant is
look-ing for a house, last known address and the landlord’s initial feeling or intuition, among others. CTR3 – Tenant Profile –
pertains to the perceived characteristics and stability of the tenant and respective household, and incorporates three sub-clusters, namely: Behavioral Aspects (CTR4), which comprises a set of behavioral characteristics, such as
hab-its and mores, lifestyle, ethics and civism; Physical Aspects
(CTR5), which relate to factors such as age and appearance; and Family Issues (CTR6), which includes elements such as
children, pets and number of people in the household.
As noted above, the transition from the collective cog-nitive map to the value tree was challenging, due to the different perspectives held by the panel members. How-ever, this allowed for a both lengthier and more in depth discussion of the criteria identified and the relationships between them. Having arrived at the tree of criteria, it be-came apparent that it allows for a more direct observation of the information contained in the map, thus facilitating the definition of evaluation scales and decision rules for each cluster and sub-cluster identified.
3.2. Defining evaluation scales and decision rules
According to the theoretical guidelines of the DEX ap-proach, the evaluation scales should be qualitative, dis-crete and ordered. In this study, after group discussion and negotiation, the scales were defined based on four performance levels: (1) Bad/Unacceptable; (2) Acceptable; (3) Good; and (4) Excellent. Figure 5 presents the semantic evaluation scales defined for each attribute.
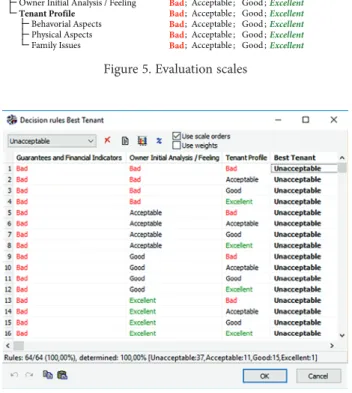
The next step was then to define the decision rules and consequent utility functions. This took place in a second group meeting and was grounded on the cognitive map and value tree previously validated by the panel members. Figure 6 exemplifies this, illustrating the decision rules de-fined for the Tenant Profile cluster.
In total, 64 decision rules were defined for each of the aggregated attributes (i.e. Tenant Profile and Best Tenant). Following Figure 6, the attributes Guarantees and
Finan-cial Indicators, Owner’s Initial Analysis/Feeling and Tenant Profile have four values each, and the number of rows (i.e. elementary decision rules) is 4^3=64. This means that each
row provides a value of Best Tenant for one combination of Guarantees and Financial Indicators, Owner’s Initial
Analysis/Feeling and Tenant Profile. The fourth row, for
instance, means the following (cf. formulation (2)):
If Guarantees and Financial Indicators=Bad,
Owner’s Initial Analysis/Feeling=Bad and Tenant Profile=Excellent, then Best Tenant=Unacceptable.
3.3. Classifying tenants: framework application and validation
Belton and Stewart (2002, p. 24) state that the evaluation phase involves “a search for consensus between possibly highly
divergent, and often highly emotive and intangible, interests, taking into consideration many uncertainties and judgmental imprecision”. To obtain this consensus, the next stage
con-sisted of testing the practical relevance of the framework. An apartment with specific characteristics was publicly announced for rental purposes, and seven actual potential
Figure 5. Evaluation scales
Figure 6. Utility function for Tenant Profile Best Tenant
Guarantees and Financial Indicators Owner’s Initial Analysis/Feeling Tenant Profile Behavioral Aspects Physical Aspects Family Issues Scales Attribute Scale
Best Tenant Unacceptable; Acceptable; Good ; Excellent
Guarantees and Financial Indicators Bad; Acceptable; Good ; Excellent
Owner Initial Analysis / Feeling Bad; Acceptable; Good ; Excellent
Tenant Profile Bad; Acceptable; Good ; Excellent
Behavorial Aspects Bad; Acceptable; Good ; Excellent
Physical Aspects Bad; Acceptable; Good ; Excellent
Family Issues Bad; Acceptable; Good ; Excellent
tenants were interviewed by the group. It is worth highlight-ing that the experts did not know these potential tenants be-forehand, meaning that the evaluation of each candidate was made spontaneously and according to the criteria defined in the cognitive map and value tree. The candidates (henceforth Alphas) were aged between 23 and 70 years old, had differ-ent professional statuses, and distinct incomes and household configurations. Figure 7 presents snapshots of the interviews conducted, which are important to exemplify the interaction established between the group members and the Alphas, pro-jecting the dynamics of the processes followed.
Following the interviews, a rating was obtained for each Alpha. Figure 8 presents the results obtained.
According to the panel members, the first three Alphas had a final score of Good; Alpha 4 and Alpha 5 were scored
Unacceptable, meaning that they would be immediately
re-jected; and Alpha 6 and Alpha 7 were considered
Accept-able. Figure 9 presents the Alphas’ overall evaluation.
After a careful analysis of the results, two major as-pects emerged from the group discussion. First, although Alpha 1, Alpha 2 and Alpha 3 were classified as Good tenants, Alpha 1 was considered, based on the criteria
Figure 7. Snapshots of the Alphas’ interviews
Figure 8. Evaluations of the Alphas [overall and per attribute] Evaluation results
Attribute Alpha 1 Alpha 2 Alpha 3 Alpha 4 Alpha 5
Best Tenant Good Good Good Unacceptable Unacceptable
Guarantees and Financial Indicators Good Good Good Bad Acceptable
Owner Initial Analysis / Feeling Good Good Good Bad Bad
Tenant Profile Acceptable Acceptable Acceptable Bad Acceptable
Behavorial Aspects Acceptable Acceptable Acceptable Acceptable Acceptable
Physical Aspects Good Good Good Acceptable Acceptable
Family Issues Good Good Acceptable Bad Good
Attribute Alpha 6 Alpha 7
Best Tenant Acceptable Acceptable
Guarantees and Financial Indicators Acceptable Acceptable
Owner Initial Analysis / Feeling Good Good
Tenant Profile Good Good
Behavorial Aspects Good Good
Physical Aspects Good Good
Family Issues Good Acceptable
Figure 9. Overall evaluation of the Alphas
Best Tenant Excellent Good Acceptable Unacceptable Alpha 7 Alpha 6 Alpha 5 Alpha 4 Alpha 3 Alpha 2 Alpha 1
presented in the value tree and cognitive map, the best tenant overall. Second, on the Owner’s Initial Analysis/
Feeling criteria, Alpha 5 was scored as “Excellent” and
“Good” by two panel members, but as “Bad” by the re-maining four. After discussion, it was possible to observe that the better scores were given by the youngest panel members, and as such might be related with their lack of experience when compared to the other four decision makers. Still, this phenomenon was important to support the conclusion that the framework developed in this study can be used by people with different opinions and beliefs, reinforcing its potential in practical terms.
Although the results obtained are encouraging, they are also idiosyncratic, meaning that generalizations and extrapolations to other contexts without the necessary ad-justments are not recommended. Still, a battery of “plus-minus-1” and dominance analyses were carried out to validate the results and check the stability of the evalua-tion system created. As an example, Figure 10 presents the “plus-minus-1” analysis carried out for Alpha 1 (a file con-taining all these analyses can be provided upon request).
According to the “plus-minus-1” analyses carried out for all the Alphas, one can assume that the evaluation sys-tem created in this study is little sensitive to +1 changes, which demonstrates that the decision makers, as a group, were quite cautious in the evaluations carried out. In fact, due to the decision rules defined by the group, the system is more sensitive when the Alphas’ local profiles are con-sidered Poor or Acceptable.
Because our framework should be seen as a learning tool able to provide well-focused improvement
sugges-tions, radar charts were additionally created to analyze each Alpha’s strengths and weaknesses. Figure 11 exem-plifies this exercise, revealing the performance profiles of Alpha 1 and Alpha 6.
As can be seen, these radar charts highlight the need for improvement in the Tenant Profile of Alpha 1, as well as in the Guarantees and Financial Indicators of Alpha 6. By focusing our attention on Alpha 1, we have two at-tributes with identical local performance level (i.e. Good), namely Guarantees and Financial Indicators, and Owner’s
Initial Analysis/Feeling. However, Alpha 1 scores only Ac-ceptable on the Tenant Profile dimension. In fact, none of
the Alphas presented a classification of Excellent. Theoreti-cally, this means that there is room for improvement in all attributes. However, in this case, priority should be given to the attribute that is at the lowest level.
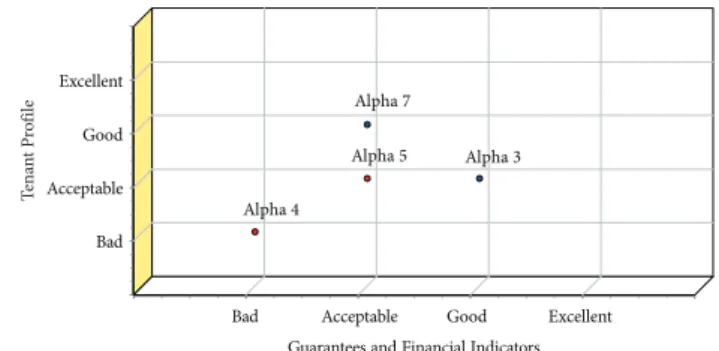
By displaying evaluation results according to two se-lected dimensions, a scatter chart provides the basis for dominance analyses. Figure 12 exemplifies this exercise, where the dimensions selected were Tenant Profile and
Guarantees and Financial Indicators.
As can be seen, when compared to Alpha 5 and Alpha 4, Alpha 3 and Alpha 7 are better options for the landlord. It should also be noted that, although they do not appear in the image, Alpha 6 occupies the same position as Alpha 7, and Alpha 1 and Alpha 2 are in the same position as Alpha 3, and so also constitute better options than Alpha 4
Figure 11. Examples of radar charts Figure 10. “Plus-minus-1” analysis for Alpha 1
Alpha 1
Owner Initial Analysis / Feeling
Guarantees and Financial Indicators Tenant Profile
Alpha 6 Owner Initial Analysis / Feeling
Guarantees and Financial Indicators Tenant Profile
Figure 12. Scatter/dominance chart
Guarantees and Financial Indicators Excellent Acceptable Bad Excellent Acceptable Bad Alpha 4 Alpha 7 Alpha 5 Alpha 3 Tena nt P ro file Good Good Attribute –1 Alpha 1 +1
Best Tenant Good
Guarantees and Financial Indicators Acceptable Good
Owner Initial Analysis / Feeling Acceptable Good
Behavorial Aspects Unacceptable Acceptable
Physical Aspects Good
and Alpha 5. These analyses were particularly important to promote additional discussion among the participants, allowing for the practical validation of the framework (for technical details on this type of analyses, see Bohanec et al., 2013; Ferreira et al., 2017c).
Conclusion and recommendations
This study acknowledges the importance of a correct clas-sification and selection of tenants, and the evaluation system created can serve as a decision support for the decision mak-ing of landlords and real estate agents in this regard. We have found no previous evidence of the combined use of cognitive mapping and DEX to address this decision problem.
The procedures followed and the classification results achieved were validated both by the expert panel members involved in this study and by the “plus-minus-1” and dom-inance analyses performed, allowing for greater transpar-ency in the classification and selection of tenants in the resi-dential rental market. In fact, transparency and simplicity in decision making are characteristics that became evident for the members of the expert panel in this study. Our proposal was furthermore reinforced by the direct involvement of the decision makers, who provided consistency, functionality and realism to the system developed. It is worth noting that despite its subjective nature, the framework developed is flexible enough to accommodate new information and be periodically updated. Indeed, as already pointed out in the literature, “there is less emphasis on outputs per se and more
focus on process” (Bell & Morse, 2013, p. 962).
Given the results obtained, it seems evident that the integrated use of cognitive mapping and DEX holds great potential, in methodological terms, for broadening our understanding of the factors behind the classification and selection of tenants in the residential rental market. Not-withstanding, the framework’s limitations with regard to the great amount of subjectivity still inherent in the evalu-ation process, as well as its idiosyncratic nature, should be borne in mind. In this sense, it is recommended that future research initiatives consider involving: (1) other decision makers with intrinsic characteristics different from those of the present study; and (2) other MCDA techniques to compare the results (for examples of these techniques, see Zavadskas & Turskis, 2011). Any improvement or update will be a welcome addition to this evolving research topic.
Acknowledgements
A previous and non-copyrighted version of this paper was presented at the 2017 BAI International Conference, held in Hiroshima, Japan. Records of the group meetings, including pictures and software outputs, and non-confidential infor-mation of the study can be obtained from the correspond-ing author upon request. The authors gratefully acknowl-edge the contribution and willingness of the expert panel members: Ana Lourenço, Miguel Correia, Fernando Santos, Pedro Brito Lima, Miguel Pimenta and José Fonseca.
References
Ackermann, F., & Eden, C. (2001). SODA – journey making and mapping in practice. In J. Rosenhead & J. Mingers (Eds.),
Ra-tional analysis for a problematic world revisited: problem struc-turing methods for complexity, uncertainty and conflict (pp.
43-60). (2nd ed.). Chichester: John Wiley & Sons.
Aickelin, U., & Dowsland, K. (2002). Enhanced direct and indi-rect genetic algorithm approaches for a mall layout and ten-ant selection problem. Journal of Heuristics, 8(5), 503-514.
https://doi.org/10.1023/A:1016536623961
Anikeeff, M. (1996). Shopping center tenant selection and mix: a re-view. In J. Benjamin (Ed.), Research issues in real estate: megatrends
in retail real estate (pp. 215-238). Dordrecht: Kluwer Academic
Publishers. https://doi.org/10.1007/978–94–009–1802–3_11
Baklouti, I. (2014). A psychological approach to microfinance credit scoring via a classification and regression tree.
Intel-ligent Systems in Accounting, Finance and Management, 21(4),
193-208. https://doi.org/10.1002/isaf.1355
Bana e Costa, C., Stewart, T., & Vansnick, J. (1997). Multicri-teria decision analysis: some thoughts based on the tutorial and discussions sessions of the ESIGMA meetings. European
Journal of Operational Research, 99(1), 28-37. https://doi.org/10.1016/S0377–2217(96)00380–3
Bell, S., & Morse, S. 2013. Groups and facilitators within prob-lem structuring processes. Journal of the Operational Research
Society, 64(7), 959-972. https://doi.org/10.1057/jors.2012.110
Belton, V., & Stewart, T. (2002). Multiple criteria decision
analy-sis: an integrated approach. Dordrecht: Kluwer Academic
Publishers. https://doi.org/10.1007/978–1-4615–1495–4
Bohanec, M. (2014). DEXi: program for multi-attribute decision
making user’s manual. Ljubljana University, Slovenia.
Bohanec, M., & Rajkovic, V. (1999). Multi-attribute decision mode-ling: Industrial applications of DEX. Informatica, 23(4), 487-491. Bohanec, M., Rajkovic, V., Zupan, B., & Bratko, I. (2013). DEX
methodology: three decades of qualitative multi-attribute modeling. Informatica, 37(1), 49-54.
Burnaz, S., & Topcu, I. 2011. A decision support on planning retail tenant mix in shopping malls. Procedia Social and
Be-havorial Sciences, 24(1), 317-324.
https://doi.org/10.1016/j.sbspro.2011.09.124
Carter, S. (2011). Housing tenure choice and the dual income household. Journal of Housing Economics, 20(3), 159-170.
https://doi.org/10.1016/j.jhe.2011.06.002
Case, B., Goetzmann, W., & Rouwenhorst, K. (2000). Global real
estate markets: cycles and fundamentals. National Bureau of
Economic Research Working Paper 7566. Cambridge. Cheng, P., Lin, Z., & Liu, Y. (2008). A model of time-on-market
and real estate price under sequential search with recall. Real
Estate Economics, 36(4), 813-843.
https://doi.org/10.1111/j.1540–6229.2008.00231.x
Chye, K., Chin, T., & Peng, G. (2004). Credit scoring using data mining techniques. Singapore Management Review, 26(2), 25-47. Cirman, A., Pahor, M., & Verbic, M. (2015). Determinants of time
on the market in a thin real estate market. Engineering
Econom-ics, 26(1), 4-11. https://doi.org/10.5755/j01.ee.26.1.3905
Eden, C. (1988). Cognitive mapping. European Journal of
Opera-tional Research, 36(1), 1-13.
https://doi.org/10.1016/0377–2217(88)90002–1
Eden, C. (2004). Analyzing cognitive maps to help structure issues or problems. European Journal of Operational Research, 159(3), 673-686. https://doi.org/10.1016/S0377–2217(03)00431–4
Eden, C., & Ackermann, F. (2001). SODA – The principles. In J. Rosenhead & J. Mingers (Eds.), Rational analysis for a
complexity, uncertainty and conflict (pp. 21-41). (2nd ed.).
Chichester: John Wiley & Sons.
Eden, C., & Ackermann, F. (2004). Cognitive mapping expert views for policy analysis in the public sector. European
Jour-nal of OperatioJour-nal Research, 152(3), 615-630. https://doi.org/10.1016/S0377–2217(03)00061–4
Ferreira, F. (2016). Are you pleased with your neighborhood? A fuzzy cognitive mapping-based approach for measuring residential neighborhood satisfaction in urban communities.
International Journal of Strategic Property Management, 20(2),
130-141. https://doi.org/10.3846/1648715X.2015.1121169
Ferreira, F., Jalali, M., Bento, P., Marques, C., & Ferreira, J. (2017a). Enhancing individual entrepreneurial orientation measure-ment using a metacognitive decision making-based frame-work. International Entrepreneurship and Management Journal,
13(2), 327-346. https://doi.org/10.1007/s11365–016–0388–5
Ferreira, F., Jalali, M., Meidutė-Kavaliauskienė, I., & Viana, B. (2015a). A metacognitive decision making based-approach to bank customer loyalty measurement and management.
Tech-nological and Economic Development of Economy, 21(2):
280-300. https://doi.org/10.3846/20294913.2014.981764
Ferreira, F., Jalali, M., Zavadskas, E., & Meidutė-Kavaliauskienė, I. (2017b). Assessing payment instrument alternatives using cognitive mapping and the Choquet integral. Transformations
in Business & Economics, 16(2|41), 170-187.
Ferreira, F., Marques, C., Bento, P., Ferreira, J., & Jalali, M. (2015b). Operationalizing and measuring individual entre-preneurial orientation using cognitive mapping and MCDA techniques. Journal of Business Research, 68(12), 2691-2702.
https://doi.org/10.1016/j.jbusres.2015.04.002
Ferreira, F., Santos, S., Rodrigues, P., & Spahr, R. (2014). Eval-uating retail banking service quality and convenience with MCDA techniques: A case study at the bank branch level.
Journal of Business Economics and Management, 15(1), 1-21. https://doi.org/10.3846/16111699.2012.673504
Ferreira, F., Spahr, R., Sunderman, M., Banaitis, A., & Ferreira, J. (2017c). A learning-oriented decision-making process for real estate brokerage service evaluation. Service Business, 11(3), 453-474. https://doi.org/10.1007/s11628–016–0315–4
Filipe, M., Ferreira, F., & Santos, S. (2015). A multiple criteria in-formation system for pedagogical evaluation and professional development of teachers. Journal of the Operational Research
Society, 66(11), 1769-1782. https://doi.org/10.1057/jors.2014.129
Furick, M. (2006). Using neural networks to develop a new model
to screen applicants for apartment rentals. PhD Thesis. Nova
Southeastern University. Fort Lauderdale, FL, USA.
Gbadegesin, J., & Oletubo, A. (2013). Analysis of tenant selection criteria in an emerging rental market. Global Journal of
Man-agement and Business Research Interdisciplinary, 13(7), 1-12.
Gonçalves, T., Ferreira, F., Jalali, M., & Meidutė-Kavaliauskienė, I. (2016). An idiosyncratic decision support system for credit risk analysis of small and medium-sized enterprises. Technological
and Economic Development of Economy, 22(4), 598-616.
Goodhart, C., & Hofmann, B. (2007). House prices and the
mac-roeconomy: implications for banking and price stability.
Ox-ford: Oxford University Press.
Hjalmarsson, E., & Hjalmarsson, R. (2009). Efficiency in housing markets: which home buyers know how to dis-count?. Journal of Banking & Finance, 33(11), 2150-2163.
https://doi.org/10.1016/j.jbankfin.2009.05.014
Jackson, J., Jones, C., & Balsmeir, P. (1986). An empirical analysis of tenant selection under federal rent supplement programs: a first step. Real Estate Economics, 14(1), 72-90.
https://doi.org/10.1111/1540–6229.00370
Jalali, M., Ferreira, F., Ferreira, J., & Meidutė-Kavaliauskienė, I. (2016). Integrating metacognitive and psychometric decision-making approaches for bank customer loyalty measurement.
International Journal of Information Technology & Decision Mak-ing, 15(4), 815-837. https://doi.org/10.1142/S0219622015500236
Ju, L., Wenbin, X., & Bei, Z. (2011). Construction of costumer classification model based on inconsistent decision table.
In-ternational Journal of e-Education, e-Business, e-Management and e-Learning, 1(3), 269-273.
Keeney, R. (1992). Value-focused thinking: a path to creative
deci-sionmaking. Harvard: Harvard University Press.
Keeney, R. (1996). Value-focused thinking: Identifying decision opportunities and creating alternatives. European Journal of
Operational Research, 92(3), 537-549. https://doi.org/10.1016/0377–2217(96)00004–5
Klein, J., & Cooper, D. (1982). Cognitive maps of decision-mak-ers in a complex game. Journal of the Operational Research
Society, 33(1), 63-71. https://doi.org/10.1057/jors.1982.7
Kwahk, K., & Kim, Y. (1999). Supporting business process rede-sign using cognitive maps. Decision Support Systems, 25(2), 155-178. https://doi.org/10.1016/S0167–9236(99)00003–2
Larsen, R., & Sommervoll, D. (2009). The impact on rent from tenant and landlord characteristics and interaction. Regional
Science and Urban Economics, 39(3), 316-322. https://doi.org/10.1016/j.regsciurbeco.2008.10.004
Lima, G. (2003). Interfaces entre a ciência da informação e a ciência cognitiva. Ciência da Informação, 32(1), 77-87.
https://doi.org/10.1590/S0100–19652003000100008
Lin, Z., & Liu, Y. (2008). Real estate returns and risk with het-erogeneous investors. Real Estate Economics, 36(4), 753-776.
https://doi.org/10.1111/j.1540–6229.2008.00229.x
Maier, G., & Herath, S. (2009). Real estate market efficiency: a
survey of literature. SRE Discussion Paper 2009–07, Wien.
Miceli, T., & Sirmans, C. (1999). Tenant turnover, rental con-tracts and self-selection. Journal of Housing Economics, 8(4), 301-311. https://doi.org/10.1006/jhec.1999.0253
Montibeller, G., Ackermann, F., Belton, V., & Ensslin, L. (2008). Reasoning maps for decision aid: an integrated approach for problem-structuring and multi-criteria evaluation. Journal of
Operational Research Society, 59(5), 575-589. https://doi.org/10.1057/palgrave.jors.2602347
Olawande, O. (2011). Harnessing real estate investment through proper tenant selection in Nigeria. Property Management,
29(4), 383-397. https://doi.org/10.1108/02637471111154827
Poterba, J., Weil, D., & Shiller, R. (1991). House price dynamics: the role of tax policy and demography. Brookings Papers on
Eco-nomic Activity, 22(2), 143-203. https://doi.org/10.2307/2534591
Shaw, D., Ackermann, F., & Eden, C. (2003). Approaches to shar-ing knowledge in group problem structurshar-ing. Journal of the
Operational Research Society, 54(9), 936-948. https://doi.org/10.1057/palgrave.jors.2601581
Taskova, K., Stojanova, D., Bohanec, M., & Dzerpski, S. (2007). A qualitative decision-support model for evaluating researchers.
Informatica, 31(4), 479-486.
Yau, C., & Davis, T. (1994). Using multi-criteria analysis for tenant selection. Decision Support Systems, 12(3), 233-244.
https://doi.org/10.1016/0167–9236(94)90007–8
Zavadskas, E., & Turskis, Z. (2011). Multiple criteria decision making (MCDM) methods in economics: an overview.
Tech-nological and Economic Development of Economy, 17(2),
397-427. https://doi.org/10.3846/20294913.2011.593291
Zu, Q., Wu, T., & Wang, H. (2010). A multi-factor customer classification evaluation model. Computing and Informatics,
![Figure 1. Example of a cognitive map [partial view]](https://thumb-eu.123doks.com/thumbv2/123dok_br/18216099.877076/4.871.112.744.88.446/figure-example-of-a-cognitive-map-partial-view.webp)

![Figure 8. Evaluations of the Alphas [overall and per attribute]](https://thumb-eu.123doks.com/thumbv2/123dok_br/18216099.877076/8.871.68.789.88.299/figure-evaluations-alphas-overall-attribute.webp)