http://br-ie.org/pub/index.php/rbie
Submission: 18/Mar/2018; 1st round notif.: 22/Jun/2018; New version: 04/Aug/2018; 2nd round notif.: 13/Sep/2018 Camera ready: 03/Oct/2018; Edition review: 12/Nov/2018; Available online: 20/Nov/2018; Published: 01/Jan/2019
Cite as: Nakamura, W. T., Marques, L. C., Rivero, L., Oliveira, E. H. T., Conte, T. (2019). Are scale-based techniques enough for learners to convey their UX when using a Learning Management System? Brazilian Journal of
Are scale-based techniques enough for learners to convey their
UX when using a Learning Management System?
Walter T. Nakamura
Institute of Computing - IComp Federal University of Amazonas - UFAM
walter@icomp.ufam.edu.br
Leonardo C. Marques
Institute of Computing - IComp Federal University of Amazonas - UFAM
lcm@icomp.ufam.edu.br
Luis Rivero
Institute of Computing - IComp Federal University of Amazonas - UFAM
luisrivero@icomp.ufam.edu.br
Elaine H. T. de Oliveira Institute of Computing - IComp Federal University of Amazonas - UFAM
elaine@icomp.ufam.edu.br
Tayana Conte
Institute of Computing - IComp Federal University of Amazonas - UFAM
tayana@icomp.ufam.edu.br
Abstract
As technology evolves, learning institutions have sought to invest in new learning technologies. Many universities have been adopting platforms designed to support the learning process, called Learning Management Systems (LMSs), to complement face-to-face learning, as well as to support distance learning. This widespread adoption of LMSs raises the need for evaluating them regarding aspects related to quality in use, such as User eXperience (UX). UX is very important in e-learning context, given that it may influence learner’s attitude towards the use of the LMS. Despite its importance, few studies evaluated the UX of LMSs. Moreover, researchers have been using generic techniques to evaluate them. In this context, there is no evidence of studies conducted to identify whether these techniques can fully capture the experience conveyed by these platforms. This paper presents an analysis of two UX evaluation techniques (User Experience Questionnaire, and Integrated Experience Acceptance Model) applied to an LMS called Edmodo. We carried out a study with 34 students, divided into two groups, to evaluate the UX of Edmodo and obtain their perceptions about the technique they used. We also gathered the difficulties faced by the students during the execution of the tasks on the platform, while correlating those difficulties with learning issues. In addition, we performed a qualitative analysis in order to better understand the results. Regarding Edmodo, the results showed that the students perceived its UX as positive. Regarding the techniques, both groups considered them easy to use and useful. However, around 41% of the students in both groups reported that they were not able to fully evaluate their UX using the techniques. The qualitative results allowed the identification of positive and negative aspects that researchers may consider during the improvement or development of new UX evaluation techniques.
1 Introduction
The widespread adoption of internet-based technology led educational institutions to the interest in investing in new learning technologies [Zaharias and Pappas 2016]. Powerful platforms, called Learning Management Systems (LMSs), have been adopted to support the teaching and learning processes. As the number of universities which use LMSs grows, research in terms of principles related to human computer interaction, such as User eXperience (UX), have attracted considerable interest [Harrati et al. 2016].
User eXperience (UX) has many definitions. ISO 9241-210 (2010), for instance, defines UX as “perceptions and responses of a person resulting from the use and/or anticipated use of a product, system or service”. Hassenzahl (2008), on the other hand, proposes an approach involving pragmatic (related to the accomplishment of tasks) and hedonic (related to emotions) aspects. In this way, hedonic aspects contribute directly to a positive experience, while pragmatic aspects facilitate the potential to achieve goals such as “being autonomous”, “being competent”, among others.
Given that most of the learning process occurs through learner’s interaction with the LMS, it is important that an LMS provides a positive UX while being usable and facilitating learning [Nakamura et al. 2017b]. Failure to comply with these quality aspects may result in dissatisfaction, misunderstanding or improper use of these platforms, generating several criticisms and low acceptance [Van Der Linden and Van De Leemput 2015].
Although there are several studies carried out to evaluate LMSs, most of them focused on aspects related to usability, e.g., task accomplishment, with little effort in evaluating learners’ UX when interacting with an LMS [Nakamura et al. 2017a]. Among those evaluating the UX, there was no evidence of techniques that consider the specificities for evaluating LMSs. Moreover, researchers have been using generic techniques to evaluate these platforms. Thus, there is a lack of evidence on whether these techniques are adequate to gather the UX in the context of LMSs.
This paper is an extended version of the work published in Nakamura et al. (2017b) and presents a study carried out with two UX evaluation techniques: User Experience Questionnaire (UEQ) [Laugwitz et al. 2008] and Integrated Experience Acceptance Model (IEAM) [Van Schaik and Ling 2011]. Our goal is to compare these two techniques to evaluate an LMS called Edmodo and verify whether they allow learners to fully convey their UX when using an LMS. With this work, we intend to provide researchers with information on these techniques, making it possible to improve them or create new techniques considering their strengths and weaknesses. Furthermore, the identified UX problems faced by the students may contribute to the improvement of Edmodo’s quality.
The remainder of this paper is organized as follows: Section 2 presents an overview of UX evaluation of LMSs. In Section 3, we present some related work. Section 4 presents the processes performed to carry out this study. In Section 5, we present the results of this study. Finally, Section 6 discusses the findings and concludes the paper.
2 User Experience in LMSs
As technology evolves and interactive environments become increasingly ubiquitous in all aspects of life, including education, users expect such environments to provide more than just ease of use [Petrie and Bevan 2009]. Hassenzahl et al. (2000) suggest that instead of making software merely usable, aspects such as pleasure and satisfaction should be the main goal of the
project. Being usable and at the same time interesting, the system would become much more attractive and consequently, it would improve the UX.
With technological innovations and new patterns of interaction, UX has been gaining importance and changing expectations and demands of users. In e-learning context, an LMS that does not provide a positive UX may influence learner’s attitude towards the use of the LMS, resulting in incomprehension or misuse of these platforms, also affecting the acceptance, satisfaction and efficiency of academic institutions [Van Der Linden and Van De Leemput 2015; Harrati et al. 2016].
One of the major challenges of the Human-Computer Interaction (HCI) area in e-learning context is "to develop software tools able to engage novice learners and to support their learning even at a distance" [Lanzilotti et al. 2006]. In this way, it is important that the LMS provides a positive UX for learners, improving the way they interact with the platform and increasing their engagement towards the learning process. By achieving this, it would be possible to make the interaction process as natural and intuitive as possible [Ardito et al. 2006].
Despite its importance, the UX evaluation has been neglected in e-learning field [Zaharias and Pappas 2016], which may explain the lack of specific techniques for evaluating the UX of LMSs [Nakamura et al. 2017a]. Many studies consider the importance of usability and human factors in the evaluation of LMSs, however, these works do not have a holistic vision oriented to UX, which reinforces the need for more empirical studies on the UX evaluation of LMSs and the development or improvement of UX evaluation techniques.
3 Related Work
The results of our systematic mapping [Nakamura et al. 2017a] revealed that many researchers carried out studies to evaluate LMSs. However, few evaluated the UX of these platforms. Moreover, generic techniques (i.e., techniques designed to evaluate the UX of products in general, not specific for evaluating LMSs) have been used to evaluate these platforms. We present some of these studies below.
Santoso et al. (2016) carried out a study to evaluate the UX of an LMS called SCELE (Student Centered E-Learning Environment), which is based on Moodle LMS. They applied the User Experience Questionnaire (UEQ) proposed by Laugwitz et al. (2008), detailed in Section 3.1, with some open-ended questions regarding usability, and conducted semi-structured interviews. The results indicated that SCELE provides a positive UX, except for Dependability dimension, which evaluates whether the user feels in control of the interaction. The authors indicate that the low value for this dimension may be because it does not play such an important role in the UX of an LMS or due to problems with the interpretation of the items of this dimension.
Debevc et al. (2007) evaluated Moodle LMS by using SUMI (Software Usability Measurement Inventory) developed by Kirakowski et al. (1993). The technique consists of a Likert-type questionnaire composed by 50 items evaluating six dimensions: efficiency, affect, helpfulness, control, learnability and global usability. The “affect” dimension evaluates the emotional reactions to a software. The results indicated a lower score for efficiency and control.
Although generic techniques have been applied to evaluate LMSs, we did not find evidence whether they are enough for learners to convey their UX when using an LMSs. The assumption about problems with the interpretation raised by Santoso et al. (2016), for instance, may indicate that the technique is not adequate to evaluate these platforms. Thus, it reinforces the
need for more empirical studies in order to evaluate the adequacy of these UX evaluation techniques in the context of LMSs.
4 Study
As mentioned before, this study aims to compare two generic UX evaluation techniques and verify whether learners can fully convey their UX when using LMSs. Our main motivation is that few studies were carried out to evaluate the UX of these platforms. Although LMSs have their specificities, researchers have been using generic techniques to evaluate them [Nakamura et al. 2017a]. Furthermore, there was no evidence of studies on the adequacy of these techniques to evaluate the UX of LMSs. Therefore, there is a need for empirical studies in order to verify whether generic techniques can fully capture the UX conveyed by LMSs or not. The next subsections detail the processes employed to conduct the study.
4.1 Technique Selection Process
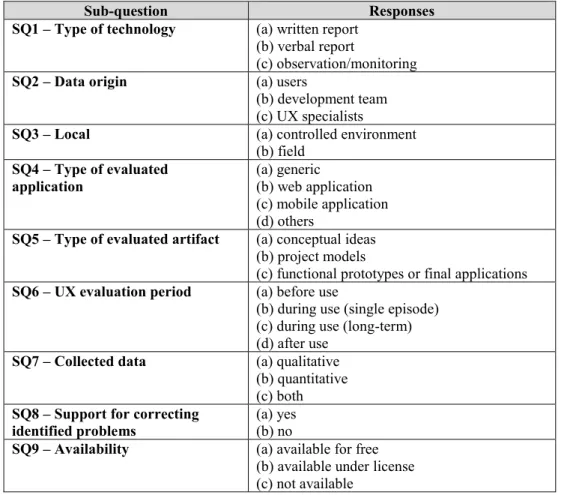
In Nakamura et al. (2017a), we carried out a systematic mapping to identify usability and UX evaluation techniques that have been applied to evaluate LMSs. Since we did not find specific techniques to evaluate the UX of LMSs, we performed a research to identify the techniques available from other contexts. To do so, we used the work by Rivero and Conte (2017) as a starting point. It contains a list of 227 publications returned from a systematic mapping conducted to identify methods, techniques and tools that have been proposed to evaluate the UX of software applications. The authors classified the publications according to a set of 9 research sub-questions and their responses (see Table 1).
Table 1: Research sub-questions from the work of Rivero and Conte (2017).
Sub-question Responses
SQ1 – Type of technology (a) written report (b) verbal report
(c) observation/monitoring
SQ2 – Data origin (a) users
(b) development team (c) UX specialists
SQ3 – Local (a) controlled environment
(b) field SQ4 – Type of evaluated
application (a) generic (b) web application (c) mobile application (d) others
SQ5 – Type of evaluated artifact (a) conceptual ideas (b) project models
(c) functional prototypes or final applications SQ6 – UX evaluation period (a) before use
(b) during use (single episode) (c) during use (long-term) (d) after use
SQ7 – Collected data (a) qualitative (b) quantitative (c) both SQ8 – Support for correcting
identified problems (a) yes (b) no
SQ9 – Availability (a) available for free (b) available under license (c) not available
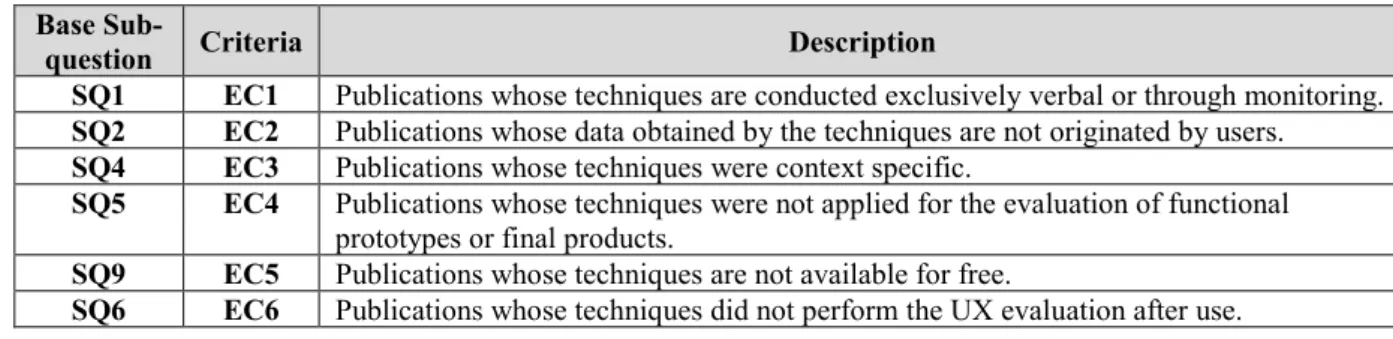
We formulated six Exclusion Criteria (EC) based on the 9 sub-questions defined in the work of Rivero and Conte (2017) according to the purposes of our study (see Table 2). Due to the large number of participants and the restricted time to carry out the evaluation, also considering that we wanted to identify techniques that are easy to apply and low cost, we did not consider techniques that need a moderator or some type of monitoring tool (EC1). Since the focus of our study is on the perceptions of the UX after the use of a functional LMS from users’ point of view, we did not consider techniques that do not obtain data from users (EC2), not evaluate functional prototypes or final applications (EC4) and not perform the UX evaluation after use (EC6). Finally, we did not consider publications which techniques are designed to a specific context (EC3), e.g., medical, journalism, etc. or were not available for consultation (EC5). We analyzed these techniques to verify whether we can apply them to evaluate an LMS or not.
Table 2: Exclusion criteria applied during the selection of publications. Base
Sub-question Criteria Description
SQ1 EC1 Publications whose techniques are conducted exclusively verbal or through monitoring. SQ2 EC2 Publications whose data obtained by the techniques are not originated by users. SQ4 EC3 Publications whose techniques were context specific.
SQ5 EC4 Publications whose techniques were not applied for the evaluation of functional prototypes or final products.
SQ9 EC5 Publications whose techniques are not available for free.
SQ6 EC6 Publications whose techniques did not perform the UX evaluation after use.
From the 227 initial publications, 170 were excluded based on the exclusion criteria, resulting in 57 accepted publications and a total of 50 unique techniques identified. We analyzed and evaluated these techniques regarding aspects such as feasibility and availability. Regarding feasibility, for example, some techniques were not applicable to our study, since they were specific to evaluate educational games or needed specific equipment to perform the evaluation. Regarding availability, some techniques did not provide the final applicable questionnaire. At the end of the analysis, we selected two techniques: UEQ and IEAM. The complete classification for each publication can be found in the Appendix.
Both techniques aim to assess the UX of products regarding Pragmatic Quality (PQ) (goal oriented) and Hedonic Quality (HQ) (pleasure oriented) dimensions. HQ dimension subdivides in Hedonic Identification (HQ/I) and Hedonic Stimulation (HQ/S). HQ/I dimension relates to how user identifies with the product, i.e., how the product allows the user to express himself to others [Hassenzahl 2003]. People, for instance, may prefer products that communicate advantageous identities to others, such as products that are in fashion or developed by famous brands. HQ/S, in turn, relates to how much the product stimulates the user with “novel, interesting or even exciting functionality, content, presentation or interaction style” [Hassenzahl 2003].
UEQ is a 7-point semantic differential scale where users mark the point that is closest to the adjective that better describes their UX. The technique uses 26 adjectives to evaluate six factors: (i) attractiveness, (ii) perspicuity, (iii) efficiency, (iv) dependability, (v) stimulation and (vi) novelty. Perspicuity, efficiency and dependability attributes evaluate the PQ dimension, while stimulation and novelty evaluate the HQ dimension. UEQ also evaluates Attractiveness (ATT) through attractiveness attribute, which relates to the general impression towards a product. The HQ dimension evaluated by UEQ relates only to HQ/S dimension.
IEAM is composed by two parts. The first part evaluates PQ, HQ/I and HQ/S dimensions, in addition to Beauty and Goodness of a product. Each dimension has pairs of adjectives and a 7-point semantic differential scale, similar to UEQ. The second part is based on Technology
Acceptance Model (TAM) developed by Davis et al. (1989) and is composed by a 7-point Likert scale that assesses participant’s level of accordance for each affirmative regarding: (i) Perceived Enjoyment (PE), (ii) Perceived Ease Of Use (PEOU) and (iii) Perceived Usefulness (PU).
One of the authors of this paper translated the techniques to Brazilian Portuguese and two other researchers reviewed it. The Cronbach Alpha indicated high internal consistency values for both translated techniques, with α > 0.7.
4.2 Definition of the Evaluated LMS
Edmodo is an educational platform founded in 2008 designed to fill the gap between students’ personal lives and school, enabling students and teachers to communicate with each other, connect and share ideas, problems and tips. The platform is accessed directly through a website, without the need to perform any local installation. Edmodo includes several functionalities, such as tasks definition, assessments, material distribution, note assignment and group creation. Each group has a unique code that makes it possible to restrict its access only to students who have that code. In addition, the platform presents features and aspects of a social network, such as posting messages, and options to follow, like and comment on a publication.
The choice for Edmodo LMS was due to the identification of difficulties by some students while submitting or performing activities through the platform in a class where one of the authors of this paper acted as an administrator of Edmodo. Some professors of the university where we carried out the study were also seeking to use this LMS, since it is free and does not need to be locally installed or configured. Thus, they suggested to address its feasibility. Furthermore, there was no evidence of studies regarding the evaluation of Edmodo in our systematic mapping [Nakamura et al. 2017a].
4.3 Participants and Materials
We carried out the study with 34 students (27 men and 7 women) from the Federal University of Amazonas (UFAM), enrolled in Human-Computer Interaction class during the first semester of 2017. The participants were undergraduates, masters and doctoral students from courses related to Computer Science. Most students had not used Edmodo before. On the other hand, most of them had experience with LMSs, using this type of platform many times a week. Regarding UX evaluation, the majority of the students had already heard about it, but not in depth.
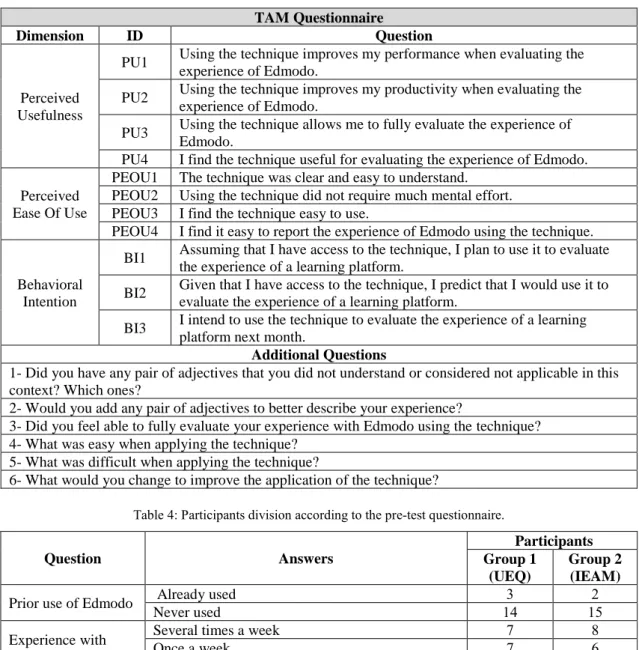
We used the following materials in this study: (i) an informed consent form, explaining the study, the participants’ voluntariness and the confidentiality of their identities; (ii) a script with a set of tasks to be performed on Edmodo; (iii) the UX evaluation techniques (UEQ and IEAM); (iv) the Technology Acceptance Model (TAM) questionnaire proposed by Davis et al. (1989) with additional questions; and (v) a preference questionnaire. The TAM questionnaire (see Table 3) consists of a set of items evaluated by a 7-point Likert scale to obtain participant’s perceptions regarding Perceived Ease Of Use (PEOU), Perceived Usefulness (PU) and Behavioral Intention (BI). The preference questionnaire is composed by a single-choice question, with three options: (i) UEQ, (ii) IEAM and (iii) none of them, in addition to a field where the participant should explain the reason for that choice.
4.4 Execution
Two days before the study, we provided a brief introduction about Edmodo to participants and informed them about the study. All participants signed the informed consent form. We divided them into two groups. Considering that the participants may have different backgrounds that may cause undesired effects on the results, we provided a pre-test questionnaire in order to characterize them (principle of balanced design). This questionnaire contains questions regarding: (i) prior use
of Edmodo, (ii) frequency of use of LMSs and (iii) knowledge level about usability/UX evaluations. We divided the participants in blocks according to their experience. From each block, we randomly assigned them to each group (see Table 4). Each group used only one technique.
Table 3: Evaluated items from TAM questionnaire and additional questions. TAM Questionnaire
Dimension ID Question
Perceived Usefulness
PU1 Using the technique improves my performance when evaluating the experience of Edmodo.
PU2 Using the technique improves my productivity when evaluating the experience of Edmodo.
PU3 Using the technique allows me to fully evaluate the experience of Edmodo.
PU4 I find the technique useful for evaluating the experience of Edmodo. Perceived
Ease Of Use
PEOU1 The technique was clear and easy to understand. PEOU2 Using the technique did not require much mental effort. PEOU3 I find the technique easy to use.
PEOU4 I find it easy to report the experience of Edmodo using the technique.
Behavioral Intention
BI1 Assuming that I have access to the technique, I plan to use it to evaluate the experience of a learning platform.
BI2 Given that I have access to the technique, I predict that I would use it to evaluate the experience of a learning platform.
BI3 I intend to use the technique to evaluate the experience of a learning platform next month.
Additional Questions
1- Did you have any pair of adjectives that you did not understand or considered not applicable in this context? Which ones?
2- Would you add any pair of adjectives to better describe your experience?
3- Did you feel able to fully evaluate your experience with Edmodo using the technique? 4- What was easy when applying the technique?
5- What was difficult when applying the technique?
6- What would you change to improve the application of the technique?
Table 4: Participants division according to the pre-test questionnaire.
Question Answers Participants Group 1 (UEQ) Group 2 (IEAM)
Prior use of Edmodo Already used 3 2
Never used 14 15
Experience with LMSs (frequency of use)
Several times a week 7 8
Once a week 7 6 Once a month 2 2 Never used an LMS 1 1 Knowledge about usability/UX evaluation
Already performed this type of evaluation 2 2
Already learned about it and did some class
exercises 2 2
Already read about it but not in depth 10 9
Never heard about it 3 4
Total of participants 17 17
A day before the study, participants received, by e-mail, a script with the set of tasks to be performed on Edmodo. Given that Edmodo is Internet dependent and that the internal network of the institution is instable due to the high number of users, we decided that each participant would carry out the activities in their own home in order to avoid connectivity problems that could
interfere on their experience of use. For this reason, we could not estimate the time spent by the participants during the accomplishment of the tasks.
The participants performed the following tasks: (i) register on the platform; (ii) join the group of the discipline through provided access code; (iii) change profile photo; (iv) download and read two available content; (v) perform tasks related to each content; (vi) perform an assessment activity. We selected these tasks since they reflect the main activities performed by learners in Edmodo. The last question in the assessment activity was an open-ended question where participants could describe their difficulties when performing the tasks in Edmodo, given that the selected techniques do not identify these difficulties. UEQ, for instance, aims to obtain “feelings, impressions, and attitudes that arise when experiencing the product” [Laugwitz et al. 2008], while IEAM aims to gather user’s interaction experience and technology acceptance [Van Shaik and Ling 2011]. None of them evaluates the accomplishment of the tasks.
On the study day, the participants went to a room according to the group they were assigned. Each group evaluated Edmodo using only one technique. We recorded the time spent by each participant in the evaluation process in order to measure the average time necessary to apply the techniques. After the evaluation, the participants received the TAM questionnaire.
A day after the study, we applied the preference questionnaire. The goal was to identify which technique the participants would prefer and the reasons for this preference. We decided to apply this questionnaire a day after the evaluation in order to allow the participants to better think about the technique they used. First, we performed a brief presentation about both techniques, in addition to explaining to the participants that we divided them into two groups, each group using only one technique. After, we provided them the techniques. The group that used UEQ received IEAM and vice versa. The participants analyzed the technique for a while and then answered the preference questionnaire.
5 Results
In this section, we present the results of this study. Questionnaires composed by open-ended questions were analyzed qualitatively in order to better interpret the results. One researcher analyzed the data and other researcher reviewed it. We performed an open coding [Corbin and Strauss 2014] by analyzing participants’ answers sentence by sentence and creating codes that represent the concepts identified in their answers. For example, participant P28 stated the following about Edmodo: “The interface of the platform is a little confusing, I did not find the link to access the course group easily”. Participant P33 also reported: “I had difficulty using Edmodo, in my opinion, it seems unorganized and with this it took me a while to see where the task was and where to click on and such”. We analyzed the participants quotations and identified the words that represent the main idea of each sentence (highlighted in bold). These words are key points identified in these sentences which we used to start coding and understand the phenomena. Since we wanted to identify what affected the UX of the participants when using Edmodo, we analyzed these key points and created codes that address issues related to UX. In this example, we assigned the code “confusing interface” for the first quotation. For the second quotation, we assigned two codes: “low ease of use” and “lack of interface organization”. After coding the sentences, we grouped those that represent the same idea, creating a broader code that addresses the concepts identified in these sentences. Given that these key points relate to the interface of Edmodo, which made it difficult for the participants to find what they were looking for, we grouped them into the “confusing interface” code.
In order to better understand the results, we divided them into two subsections: (i) evaluation of Edmodo, and (ii) evaluation of the techniques.
5.1 Results of the Evaluation of Edmodo
In this subsection, we will describe the results of the evaluation of Edmodo. Since the techniques evaluate some different aspects from each other, firstly we will present the results related to commonly evaluated aspects by both techniques: Pragmatic Quality (PQ) and Hedonic Quality Stimulation (HQ/S).
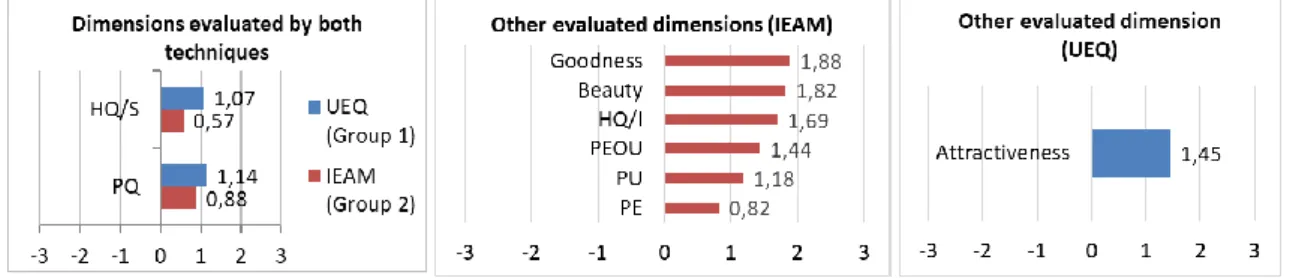
Figure 1 illustrates the mean values of the dimensions evaluated by: (i) both techniques, (ii) IEAM only, and (iii) UEQ only. Since the dimensions of each technique are composed by a different number of items that captures a single concept (the dimension itself), we calculated the mean score of these items for each evaluated dimension in order to make the comparison between the techniques possible [Sullivan and Artino Jr 2013; DiStefano 2009]. The result is a number ranging from -3 (the most negative result) to 3 (the most positive). Scores smaller than -1 indicate a negative perception of the participants regarding this dimension. Scores between -1 and +1 indicate that the perception was neither positive nor negative. Finally, scores higher than +1 indicate a positive perception of the participants. We also performed a statistical analysis on the values of the dimensions evaluated by both techniques with IBM SPSS1 software in order to
identify whether there is a significant difference between the perception of the participants regarding HQ/S and PQ. Firstly, we performed a Shapiro-Wilk statistical analysis to verify whether the data distribution of the means of these dimensions per technique is normal or not. Results showed that HQ/S and PQ dimensions were normally distributed for both UEQ (p-value = 0.291, p < 0.05 and p-value = 0.280, p < 0.05) and IEAM (p-value = 0.542, p < 0.05 and p-value = 0.423, p < 0.05). Thus, we performed the Student’s t-test.
Figure 1: Results from each evaluated dimension of the techniques.
Results of the dimensions evaluated by both techniques indicate that, in general, Group 1 evaluated the UX of Edmodo slightly better. Regarding HQ/S, Group 2 showed neutral, while Group 1 perceived it as positive. These neutral-positive scores may indicate that Edmodo fulfills the participants’ needs regarding this dimension. However, there is room for improvements, for example, by developing more interesting or exciting resources/functionalities in order to increase the stimulation provided by the platform. The t-test showed no significant difference on HQ/S (p-value = 0.101, p < 0.05).
The results of PQ were similar to HQ/S. Group 2 showed neutral, while Group 1 perceived it as positive. It may indicate that, in general, participants found Edmodo relatively easy to use. Results are in accordance with the additional questions, in which, within the 34 participants, 19 (around 56%) did not face any difficulty with Edmodo. However, 15 participants complained about one or more issues, which may indicate that there are opportunities to improve the platform. The t-test also showed no significant difference on PQ (p-value = 0.507, p < 0.05).
Regarding the remaining dimensions evaluated by IEAM technique (Group 2), results showed that the participants did not perceive Edmodo as either enjoyable or unenjoyable (PE = 0,82), which reflects the results from HQ/S dimension. On the other hand, they had a positive identification with the platform (HQ/I = 1,69). Despite their difficulties in performing some tasks, they found Edmodo easy to use (PEOU = 1,44) and useful (PU = 1,18). Additionally, the platform was also rated as good (Goodness = 1,88) and beautiful (Beauty = 1,82). Regarding the other dimension evaluated by UEQ, the Attractiveness (ATT) was perceived as positive (ATT = 1,45). It means that although participants faced some difficulties, the platform was, in general, attractive to them.
With respect to the open-ended question in the assessment activity provided in Edmodo, the results revealed that, within the 34 participants, 15 faced some difficulties during the execution of the tasks on Edmodo, giving a total of 12 unique difficulties. We identified five codes during the qualitative analysis: (1) lack of instructions to perform the matching task; (2) not intuitive navigation; (3) confusing interface; (4) lack of proper feedback; and (5) confusing language.
The first code indicates that Edmodo does not provide sufficient instructions to
perform the matching task. This issue was indicated by 8 out of the 15 participants that reported
difficulties. The matching task consisted in dragging the options on the right column to order them according to the content of the left column. Among the 8 participants that reported difficulties, 4 stated that they wasted too much time trying to perform the matching task, but after some attempts they could accomplish it. Participant P1, for instance, stated “I did not understand at first how to match the concepts, whether I had to pull one line out of the box and connect it to the other, or whether I had to click on both boxes that corresponded to the exact correlation. I only discovered that I had to change the position of the boxes by chance and thus finished the activity”. However, the other 4 stated that they did not know how to perform it and submitted the quiz without finishing the task. Participant P22, for instance, stated, “I could not match the answers from the first column in the second column, it does not explain how it should be done, I tried everything and I could not do it, so I submitted it without answering the question”. In fact, the 4 participants that accomplished the matching task of the quiz answered it correctly. However, 3 from the 4 participants that submitted the quiz without finishing it answered incorrectly.
The second code relates to the difficulty in going to some pages, indicating that the
navigation of Edmodo is not intuitive enough. Some participants had to navigate through
different pages until they get to the desired page. Participant P1, for instance, stated, “I had difficulty to go back to the home page of the group to look for the next tasks […] I had to click on the ‘home’ icon to go back to the home page of Edmodo, access the group of the course and look for the tasks I needed to accomplish”.
The third code relates to participants’ difficulty in finding resources in the platform, e.g., course materials and activities, indicating that the interface of Edmodo is confusing. Regarding course materials, for example, 8 participants reported difficulty in finding these materials, making them waste time during the tasks. Participant P15, for instance, stated: “It took me a long time to figure out where was the material to perform the tasks”.
There were also some comments related to the lack of adequate feedback from the platform (fourth code), indicating that Edmodo does not provide sufficient feedback to learners. Participant P12, for instance, stated, “In tasks 1 and 2, I was not sure whether the attached document was really delivered to the professor, since the task of one of the students was visible to me right below the wording of the task, and mine was not”. Indeed, participant P19 attached the task files in the comment field of tasks 1 and 2. However, this participant did not report any difficulty when performing the tasks, i.e., he did not know that he did not submit the task in the right place.
Finally, some participants complained about the language used in the platform (fifth category), indicating that the language used in Edmodo confuses learners. Participant P24 commented, “Edmodo mixes Portuguese with English and ends up confusing the user”. Indeed, there are some words and sentences not translated to Brazilian Portuguese, which may cause difficulties for users who are not familiar with English language in finding or understanding information.
5.2 Results of the evaluation of the techniques
In this subsection, we present the results of the evaluation of the techniques used in this study. We divided the results into two subsections: (i) TAM questionnaire; and (ii) preference questionnaire. 5.2.1 Results of the TAM questionnaire and additional questions
This section presents the results from the TAM questionnaire [Davis et al. 1989], which aims to evaluate the level of acceptance of a given technology through attributes such as Perceived Ease Of Use (PEOU), Perceived Usefulness (PU) and Behavioral Intention (BI). We applied this questionnaire in order to evaluate the participants’ level of acceptance regarding the technique they used. We also added some questions in order to gather qualitative data about the techniques. We decided to apply this questionnaire with students given that they are the final users of LMSs and, consequently, will be the ones that will use the UX evaluation techniques to report their perceptions.
We analyzed the median of each item from the TAM questionnaire in order to better understand their perceptions about the technique they used (Figure 2a). We also carried out statistical analyses on the median of the scores given by the participants for each dimension (PEOU, PU and BI) per group in order to verify whether there is a significant difference between their perceptions or not. The Shapiro-Wilk test showed that PU data were not normally distributed in both UEQ (p-value = 0.001, p < 0.05) and IEAM (p-value = 0.024, p < 0.05) groups. Regarding PEOU, the data from both UEQ (p-value = 0.393, p < 0.05) and IEAM (and p-value = 0.568, p < 0.05) groups were normally distributed. Finally, the BI data from IEAM group were normally distributed (p-value = 0.613, p < 0.05), while from UEQ group were not (p-value = 0.037, p < 0.05). The PU data, on the other hand, were not normal in both UEQ and IEAM groups (p-value = 0.001, p < 0.05 and p-value = 0.034, p < 0.05 respectively). Therefore, we performed the Student’s t-test to PEOU, and the Mann-Whitney statistical test to PU and BI.
Regarding Perceived Usefulness (PU), participants considered that both techniques improve their performance a little when evaluating the UX of Edmodo (PU1). As for productivity (PU2), participants who used IEAM technique considered that it increases their productivity more than participants who used UEQ technique. On the other hand, participants using IEAM perceived it as neutral to fully evaluate the experience with Edmodo (PU3), while participants using UEQ perceived it as a little useful. Regarding overall usefulness to evaluate the UX of Edmodo (PU4), participants of both techniques perceived them as useful. The test-test showed no significant difference on PU between the techniques (p-value = 0.073, p < 0.05).
(a) (b) (c) (d) Figure 2: Results of TAM questionnaire and additional open-ended questions.
Regarding Perceived Ease Of Use (PEOU), both techniques were considered clear and easy to understand (PEOU1), with UEQ being perceived as clearer and easier than IEAM. The participants’ responses also indicated that both techniques did not require much mental effort (PEOU2) and were very easy to use (PEOU3). Participants of both groups also perceived them as easy to report the experience with Edmodo (PEOU4). The results from the Mann-Whitney statistical test showed, however, no significant difference on PEOU between the techniques (p-value = 0.97, p < 0.05).
Regarding Behavioral Intention (BI), participants who used UEQ showed more intention to use it (BI1), while demonstrating a higher probability of using it (BI2) to evaluate the UX of an LMS than participants who used IEAM. However, participants from both groups did not express any intention to use the techniques so soon (BI3). The results from the Mann-Whitney statistical test showed no significant difference on BI (p-value = 0.138, p < 0.05).
Regarding the additional questions attached in TAM questionnaire (see Table 1), the results for question 1 (Figure 2b - “Did you have any pair of adjectives that you did not understand or considered not applicable in this context?”) revealed that 9 participants from IEAM and 10 participants from UEQ answered yes. With regards to IEAM, most participants complained that the pair “good/bad” is not applicable. Regarding UEQ, most participants complained about the similarity of some adjectives, e.g. “inventive-conventional” and “conservative-innovative”, while other participants did not understand the meaning of “leading edge” adjective.
The results for question 2 (Figure 2c - “Would you add any pair of adjectives to better describe your experience?”), revealed that few participants would add more adjectives to the techniques. Three participants using IEAM and two using UEQ suggested the addition of pairs of adjectives. Regarding IEAM, the participants suggested adding: “easy to navigate/difficult to navigate”, “intuitive/not intuitive” and “interactive/not interactive”. Regarding UEQ, participants suggested adding: “intuitive/not intuitive” and “recommendable/not recommendable”.
The results for question 3 (Figure 2d - “Did you feel able to fully evaluate your experience with Edmodo using the technique?”) revealed that most of the participants was able to fully evaluate their UX. On the other hand, around 41% of the participants in both groups reported not being able to fully report their UX by using the techniques, indicating opportunities for improvements.
In order to better understand the reasons why some participants were able to fully report their UX and others not, in addition to identify their perceptions about the techniques (questions 3, 4, 5 and 6), we performed a qualitative analysis. We present the results of this analysis below.
Regarding participants’ perceptions about UEQ technique, we identified the following codes: (1) quick and easy; (2) adjectives convey the UX; (3) limited UX reporting; and (4) confusing adjectives.
The first code indicates that the semantic differential scale of UEQ makes the UX evaluation process quick and easy. Given this, participant P4 commented, “applying rating on a scale eases reporting the emotion that I felt when using Edmodo”. Moreover, participant P14 stated, “it was easy to choose the option of adjective and also, in the case of feeling neutral to a given pair of adjectives, there was an option for it”.
The second code reveals that the adjectives used by UEQ allowed participants to report their UX, covering the main feelings aroused in them when using Edmodo. Participant P12, for instance, stated, “the adjectives reveal the feelings present during the use of the platform very well”. Participant P14 also highlighted that “the pairs of adjectives address the most important features of the application, such as: ease of use, learnability, understanding, etc.”
Although the above-mentioned codes reveal positive aspects of UEQ, there have also been some negative comments about the technique. Regarding third code, we identified that the UX evaluation of UEQ is limited due to the lack of a field for comments. Participant P8, for instance, stated, “I could not describe clearly which tasks I had difficulty when using Edmodo”. Participant P5 also highlighted that “[the technique does not allow me to describe] the reason for giving that answer. It is not possible to get the real cause for that answer”. Moreover, participant P13 commented, “[the evaluation] seemed too broad; some functionalities were confusing, while others were not, for example”.
Finally, the fourth code reveals that some adjectives used by UEQ confuse learners during the evaluation. Participant P9 stated that he had difficulty with “adjectives that he did not know the meaning (e.g. leading edge) […] [having to] try to infer [its meaning] by the opposite adjective”. Moreover, participant P12 commented, “four pairs of adjectives [not understandable; unpredictable; usual; conservative] seemed to not fit very well in the context of use of the platform”.
Regarding participants’ perceptions about IEAM technique, we identified the following codes: (1) quick and easy; (2) adjectives convey the UX; (3) covers the main topics; (4) difficulty in quantifying using scales; and (5) limited UX reporting.
The first code indicates that the scale-type approach used by IEAM makes the evaluation process quick and easy. Participant P28, for instance, stated, “the adjectives used to evaluate the platform were already there, only needing to score each feature. The technique avoids the intellectual effort of having to think of a criterion to evaluate”.
The second code reveals that the adjectives used by IEAM allowed participants to express their UX. Participant P27, for instance, commented “the adjectives, except those cited previously [Gaudy/Classy and Bad/Good], allowed me to immerse in the experience of use. While reading, I was able to associate them with my actions in Edmodo”.
In the third code, we identified that participants considered that IEAM covers the main topics about the UX evaluation of Edmodo. Participant P21 commented, “[the technique] presented the main features of Edmodo [for being evaluated]”. Moreover, participant P30 stated, “the questions were well elaborated and allowed me to evaluate the UX of the platform”.
Although some participants considered easy to evaluate the UX by using scales, others considered that quantifying the UX by using scales is difficult in IEAM (fourth code). Participant P30 commented, “there are many divisions for the levels of satisfaction. There should be few levels and it would be interesting to express more right to the point opinions, such as ‘liked’ and
‘disliked’, objective opinions”. There were also some participants having difficulty in differentiating “somewhat agree” from “agree”. Participant P33, for instance, stated, “it was difficult to decide between ‘agree’ and ‘somewhat agree’, both leaves a gap to detail the answer, have little difference [between them] and turned [the evaluation] difficult”.
The fifth code indicates that the UX evaluation of IEAM is limited due to the lack of a field for comments and the lack of questions more specific about the platform. Regarding the lack of a field for comments, participant P26 stated, “Multiple choice questions without a field for descriptions leave out many things”. Participant P34 also highlighted, “[I had difficulty in] evaluating an adjective in a broad way, since it can be applied to a given area and not in others, not allowing me to be specific”. Regarding the lack of specific questions about the platform, participant P19 stated, “It could present more specific questions about the platform, questions that makes the experience of use clearer in this perspective”.
Regarding participants’ suggestions for improving the techniques, the results were as follows. Suggestions from IEAM group: (i) reduce the scale to 5-point in order to avoid confusion within the terms “agree” and “strongly agree”; (ii) add a field to allow them to describe their difficulties and make comments; (iii) specify which feature is being evaluated by each adjective; (iv) split the neutral into “I do not want to answer” and “I do not know how to answer” options. Regarding UEQ, in general, participants suggested: (i) removing adjectives that are confusing or not suited for the context; (ii) removing similar adjectives; (iii) add a field for observations and comments.
Finally, in addition to these questions, we calculated the mean time needed to apply the techniques. The results indicated that the UX evaluation can be carried out very quickly through both techniques. However, participants using UEQ performed the evaluation faster (4 minutes) compared to participants using IEAM (7 minutes). It may be due to the second part of IEAM, which requires the participants to read the statements in order to answer the questions.
5.2.2 Results of the preference questionnaire
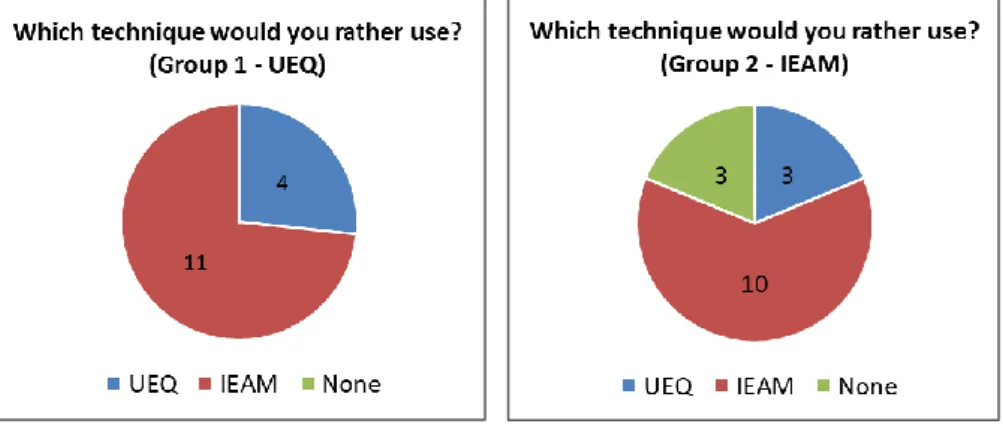
The preference questionnaire allowed us to identify which technique the participants would prefer to evaluate the UX of an LMS. Given that we applied it a day after the evaluation, not all the participants were present. Thus, two participants using UEQ and one participant using IEAM did not answer this questionnaire.
The results were as follows (Figure 3). Among the 15 participants who used UEQ, 4 stated that they would prefer to keep using UEQ to evaluate an LMS, while 11 demonstrated a preference to use IEAM. Regarding the group who used IEAM, among the 16 participants, 10 declared that they would prefer to keep using IEAM, 3 demonstrated their preference for UEQ, and 3 stated that they did not prefer any of the techniques.
We identified the following reasons for choosing UEQ: (1) UEQ better qualifies the object being evaluated; (2) the highest number of adjectives in UEQ allows participants to better express their UX; (3) UEQ is more straightforward, practical and easy to understand. In order to exemplify these reasons, we present some quotations from the participants. For the first reason, participant P4 stated, “IEAM is more succinct, but UEQ evaluates other aspects that IEAM does not address”. For the second reason, participant P6 commented, “I think that the higher number of adjectives helps to better express the opinion”. Finally, the quotation from participant P13 exemplifies the third reason: “In addition to being quick and practical, the additional pairs of adjectives make up the second part of IEAM”.
We identified the following reasons for choosing IEAM: (1) IEAM has a fewer number of adjectives; (2) IEAM is clearer and more objective; (3) the questions of IEAM evaluates the
UX better. The following quotations exemplify these reasons. For the first reason, participant P1 commented, “Straight away, it does not have excessive pairs of adjectives. In addition, it has specific questions related to application use”. For the second reason, we have the quotation from participant P11, “IEAM is simpler and I consider that it allows me to answer what is needed (is more precise)”. Finally, for the third reason, participant P15 commented, “the second section seems to better evaluate my experience and the first section has enough adjectives. UEQ extrapolates in adjectives”.
Figure 3: Results from the preference questionnaire per group.
Among the participants, three did not choose any of the techniques. Participant P30 stated that “both are unpleasant” but did not specify why. Participant P33 commented that “both have too much information”. Finally, participant P34 highlighted, “both do not allow me to be specific in what exactly I am applying such an adjective, since it may be valid for one element [e.g. functionalities, resources, tasks, etc.] and not for another”.
6 Discussion
In this section we discuss the results of this study. In order to make the discussion more comprehensive, we divided it in two subsections: (i) UX Evaluation of Edmodo, and (ii) Evaluation of the Techniques.
6.1 UX Evaluation of Edmodo
The results from the UX evaluation of Edmodo revealed a neutral-positive score from the groups. This indicates that the platform fulfills the students’ needs, but there is room for improvements. The lowest rating received by Hedonic Quality Stimulation (HQ/S) dimension, for example, reveals that Edmodo does not motivate students very much. Since “motivation and engagement are perhaps the most important elements of every form of learning experience” [Zaharias and Pappas 2016], there is a need to provide more interesting features in order to stimulate users and make it possible to increase their engagement towards learning. The neutral-positive score in the Pragmatic Quality (PQ) dimension also indicates possibilities for improvements in its functionalities.
The qualitative analysis on the open-ended question regarding the difficulties faced by the participants when performing the tasks on Edmodo allowed us to address the main problems faced by the participants in this platform. As mentioned before, these problems may impair the teaching and learning process through the LMS. We discuss each difficulty below.
Eight students stated that they spent too much time searching for the learning materials, from which 3 did not even find these materials. According to Kalyuga (2007), students, when
interacting with complex environment, could have difficulties in maintaining goals, getting lost in the search for solution moves. As a result, it could consume resources that would not be available for constructing relevant knowledge structures [Kalyuga 2007], since students may spend more time trying to understand how to use the LMS rather than learning the educational content [Ardito et al. 2006]. Thus, this difficulty may cause cognitive load to students. Moreover, learners may look for alternative content on the Internet and find wrong or inaccurate information. In order to overcome this problem, we suggest an instructional design solution, i.e., the “act of combining elements of content and display to effectively present the instructional content in a way that promotes learning through organized instructional resources and a user interface that is not confusing, dissatisfying or cognitively taxing” [Mehlenbacher et al. 2005]. In this context, the solution may include the adjustment of the layout of the platform, positioning the files in locations that are more visible to the group. This lack of visibility decreases the usability of the platform in terms of speed and efficiency [Oztekin et al. 2010], while violating an e-learning usability evaluation criterion, that defines that objects, actions and options should be visible to the learner [Reeves et al. 2002; Ssemugabi and De Villiers 2007; Mehlenbacher et al. 2005]. It is important that the screen layout of the LMS be structured in such a way that allows students to find information easily and effectively, positioning important information in places that attract students’ attention [Shiratuddin et al. 2003; Zaharias, 2009; Stoney and Wild 1998], since the screen layout has a particular and important impact on cognitive load [Stoney and Wild, 1998].
Many students also complained about the matching task in the quiz. The unintuitive approach used in Edmodo in this task and its lack of instructions may also affect the teaching and learning process, since students may not get proper feedback from the LMS according to their answers, not allowing them to reflect on their choices. Teachers may also not know whether the student had difficulty with the question itself or with the LMS. This lack of clear instructions violates usability and e-learning usability criteria, such as “Recognition Rather Than Recall” from Nielsen’s usability heuristics [Nielsen 1994a; Nielsen 1994b], in which the concept is in making the options more salient/intuitive, and the “Navigation Support” heuristic from Reeves et al. (2002), which states that instructions must be visible and user-friendly hints should be provided to the learner. We suggest providing clear instructions to learners by, for example, using videos or illustrations indicating how to arrange and match the answers properly.
Some students reported difficulty in the navigation of Edmodo, having to navigate through many pages until they achieve their goals. This problem also violates an e-learning usability evaluation criterion, that indicate that the navigational structure should be simple, showing where learners are and where they can go next by using, for example, breadcrumbs and sitemaps [Ssemugabi and De Villiers 2007], while allowing them to return to the initial stage with a single selection after navigating for some pages [Mehlenbacher et al. 2005]. We suggest including breadcrumbs in Edmodo in order to allow learners to easily go back, for example, to the course main page.
Another problem in Edmodo was identified when a student delivered a task by attaching the file using the comments field of this task, instead of clicking in “Turn In” option. This may indicate that Edmodo does not provide adequate feedback/instruction about the tasks. Learners may complain to the teacher, stating that they accomplished the task, when, actually, they attached it in the wrong place. It is noteworthy that this situation has already occurred previously outside the context of this study, in a discipline where one of the authors of this work acted as manager of the Edmodo. This lack of instructions relates to a usability/e-learning usability criterion that defines that the platform should prevent the learner to make errors in the first place [Mehlenbacher et al. 2005; Reeves et al. 2002; Ssemugabi and De Villiers, 2007; Oztekin et al. 2010; Nielsen 1994a; Mtebe and Kissaka, 2015]. We suggest, for example, to provide a warning informing that in order to accomplish the assignment, the learner should click on “Turn In” option.
Finally, the lack of proper language translation, mixing English and Portuguese also violates a usability/e-learning usability criterion called “Match between the system and the real world”. This criterion defines that the language usage, such phrases, terms, symbols and concepts should be familiar to the learner [Mehlenbacher et al. 2005; Reeves et al. 2002; Ssemugabi and De Villiers, 2007; Nielsen 1994a; Mtebe and Kissaka, 2015]. We suggest translating all interface elements of Edmodo according to the languages supported by it.
6.2 Evaluation of the Techniques
The statistical analysis of the results from the TAM questionnaire indicated that there was no significant difference regarding their Perceived Ease Of Use (PEOU), Perceived Usefulness (PU) and Behavioral Intention to use (BI). With regards to PU, both groups considered that the techniques are useful for reporting their UX, while improving their productivity in the evaluation process (PU4 and PU2 questions respectively). It is in accordance to the results from the open-ended questions, where many participants stated that the adjectives from the techniques convey their UX, in addition to being fast and simple to be answered. On the other hand, the low score on PU1 and PU3 questions indicate that the participants did not consider that the techniques improve their performance too much and did not allow them to fully evaluate the UX of the platform. In fact, some participants reported difficulty in understanding the meaning of some adjectives, while others had difficulty in judging using scales, which may have affected their perception about their performance in the evaluation. The additional questions also revealed that 41% of the participants in both techniques were not able to fully evaluate the UX of Edmodo. The most complained issue in both techniques was the lack of a field for comments. Participants commented that only using scales, without a field for comments, limits them reporting the UX. This limitation may be applicable to all evaluation techniques that use only scales as measurement instruments. They also reported that the techniques’ evaluation is too broad, not allowing them to specify which features of the platform they are evaluating. On the other hand, the overall score for PEOU reveals that the participants perceived both techniques as easy and fast to perform the evaluation, specially the semantic differential scale. Finally, regarding BI, in general, participants using UEQ showed more intention to use the technique in the future than participants using IEAM, which may be a reflect of the scores given to the PU and PEOU attributes. According to Davis et al. (1989), PU and PEOU influences BI. In fact, the group that used UEQ evaluated these two attributes slightly better than the group that used IEAM, which may explain their slightly higher intention to use the technique in the future.
When asked what technique they prefer, most participants chose IEAM. These participants stated that IEAM is more objective, has fewer adjectives and evaluates the UX better. This choice may be mostly due to the reduced number of adjectives and the second part of the technique, which is composed by questions about the use of the platform, providing a more focused evaluation. On the other hand, some participants considered the evaluation method of UEQ easier and simpler, while providing a broader range of adjectives to express their UX.
7 Conclusion and Future Works
This paper presented an UX evaluation of an LMS called Edmodo in order to evaluate the adequacy of two generic UX evaluation techniques (UEQ and IEAM), chosen after a selection process. Our goal was to identify whether these techniques allows learners to fully evaluate their UX when using an LMS. We identified the participants’ difficulties when performing the tasks in Edmodo, in addition to applying the TAM questionnaire with additional questions and the preference questionnaire in order to gather their perceptions on the techniques they used. We also
performed a qualitative analysis to better understand the results of the open-ended questions. According to the results, we identified some issues that researchers may consider when developing or improving UX evaluation techniques:
• Let learners detail their experiences: learners want to describe what they felt when using a product and what difficulties they had. Provide a field where participants can detail their experience;
• Evaluate aspects related to the platform: provide questions that focus on aspects related to the platform, for example, the level of instruction that the platform provides to learners during the tasks. Additionally, when using a semantic differential scale, provide more adjectives that relates to the use of the LMS, such as “interactive/not interactive”, “intuitive/not intuitive”;
• Be specific or let learners specify: when using semantic differential scales, specify which aspects are being evaluated by the adjectives or let learners explain their evaluation, since the LMS has many different features and an adjective may fit one, but not another;
• Keep the evaluation quick and easy: learners do not like to waste time. Use quick and straightforward evaluation methods, such as semantic differential scales;
Although the limitations of UEQ and IEAM may be applied to all evaluation techniques that use only scales as measurement instruments, some issues, such as the adequacy of the adjectives, may vary according to the tasks and the LMS evaluated. Further studies may be carried out by evaluating other LMSs with different functionalities and resources in order to verify whether the results are consistent with our findings.
We hope that our findings contribute to the improvement of Edmodo and the techniques evaluated, as well as to the development of new UX evaluation techniques in the context of LMSs. We also expect to encourage researchers in carrying out more empirical studies to evaluate these techniques and improve them. Thus, by developing better techniques, it will be possible to perform better evaluations, and consequently, improve the quality of LMSs.
Acknowledgements
We would like to thank the financial support granted by UFAM, FAPEAM through Edital 009/2017, CNPq through processes 423149/2016-4 and 311494/2017-0, and CAPES through process number 175956/2013.
References
Ardito, C., Costabile, M. F., De Marsico, M., Lanzilotti, R., Levialdi, S., Roselli, T., & Rossano, V. (2006). An approach to usability evaluation of e-learning applications. Universal access in the information society, 4(3), 270-283. doi: 10.1007/s10209-005-0008-6. [GS Search] Corbin, J., & Strauss, A. (2014). Basics of qualitative research. Sage. [GS Search]
Davis, F. D., Bagozzi, R. P., & Warshaw, P. R. (1989). User acceptance of computer technology: a comparison of two theoretical models. Management science, 35(8), 982-1003. [GS Search] DiStefano, C., Zhu, M., & Mindrila, D. (2009). Understanding and using factor scores: Considerations for the applied researcher. Practical Assessment, Research & Evaluation, 14(20), 1-11. [GS Search]
Debevc, M., Stjepanovič, Z., Povalej, P., Verlič, M., & Kokol, P. (2007, July). Accessible and adaptive e-learning materials: considerations for design and development. In International Conference on Universal Access in Human-Computer Interaction (pp. 549-558). Springer, Berlin, Heidelberg. doi: 10.1007/978-3-540-73283-9_61. [GS Search]
Harrati, N., Bouchrika, I., Tari, A., & Ladjailia, A. (2016). Exploring user satisfaction for e-learning systems via usage-based metrics and system usability scale analysis. Computers in Human Behavior, 61, 463-471. doi: 10.1016/j.chb.2016.03.051. [GS Search]
Hassenzahl, M. (2003). The thing and I: understanding the relationship between user and product. In Funology (pp. 31-42). Springer Netherlands. doi: 10.1007/1-4020-2967-5_4. [GS Search] ISO 9241-210 (2010). Ergonomics of human-system interaction - Part 210: Human-centred design for interactive systems. Available at https://www.iso.org/obp/ui/#iso:std:iso:9241:-210:ed-1:v1:en.
Kalyuga, S. (2007). Enhancing instructional efficiency of interactive e-learning environments: A cognitive load perspective. Educational Psychology Review, 19(3), 387-399. doi: 10.1007/s10648-007-9051-6. [GS Search]
Kirakowski, J., & Corbett, M. (1993). SUMI: The software usability measurement inventory. British journal of educational technology, 24(3), 210-212. doi: 10.1111/j.1467-8535.1993.tb00076.x. [GS Search]
Laugwitz, B., Held, T., & Schrepp, M. (2008, November). Construction and evaluation of a user experience questionnaire. In Symposium of the Austrian HCI and Usability Engineering Group (pp. 63-76). Springer, Berlin, Heidelberg. doi: 10.1007/978-3-540-89350-9_6. [GS Search]
Mehlenbacher, B., Bennett, L., Bird, T., Ivey, M., Lucas, J., Morton, J., & Whitman, L. (2005, July). Usable e-learning: A conceptual model for evaluation and design. In Proceedings of HCI International (Vol. 2005, p. 11th). [GS Search]
Mtebe, J. S., & Kissaka, M. M. (2015, May). Heuristics for evaluating usability of learning management systems in Africa. In IST-Africa Conference, 2015 (pp. 1-13). IEEE. doi:
10.1109/ISTAFRICA.2015.7190521. [GS Search]
Nakamura, W. T., de Oliveira, E. H. T., & Conte, T. (2017). Usability and User Experience Evaluation of Learning Management Systems – A Systematic Mapping Study. In Proceedings of the 19th International Conference on Enterprise Information Systems (ICEIS 2017), 97-108. doi: 10.5220/0006363100970108. [GS Search]
Nakamura, W., Marques, L., Rivero, L., Oliveira, E., & Conte, T. (2017, October). Are Generic UX Evaluation Techniques Enough? A study on the UX Evaluation of the Edmodo Learning Management System. In Brazilian Symposium on Computers in Education (SBIE), 28(1), 1007-1016. doi: 10.5753/cbie.sbie.2017.1007. [GS Search]
Nielsen, J. (1994a). Heuristic evaluation. In Nielsen, J., and Mack, R. L. (Eds.), Usability Inspection Methods, John Wiley & Sons, New York, 25-64.
Nielsen, J. (1994b). Enhancing the explanatory power of usability heuristics. In Proceedings of the SIGCHI conference on Human Factors in Computing Systems (pp. 152-158). ACM. doi: 10.1145/191666.191729. [GS Search]
Oztekin, A., Kong, Z. J., & Uysal, O. (2010). UseLearn: A novel checklist and usability evaluation method for eLearning systems by criticality metric analysis. International Journal of Industrial Ergonomics, 40(4), 455-469. doi: 10.1016/j.ergon.2010.04.001. [GS Search]
Rivero, L., & Conte, T. (2017, October). A systematic mapping study on research contributions on UX evaluation technologies. In Proceedings of the XVI Brazilian Symposium on Human Factors in Computing Systems (p. 5). ACM. doi: 10.1145/3160504.3160512. [GS Search] Reeves, T. C., Benson, L., Elliott, D., Grant, M., Holschuh, D., Kim, B., ... & Loh, S. (2002).
Usability and instructional design heuristics for e-learning evaluation. In EdMedia: World Conference on Educational Media and Technology (pp. 1615-1621). Association for the Advancement of Computing in Education (AACE). [GS Search]
Santoso, H. B., Schrepp, M., Isal, R., Utomo, A. Y., & Priyogi, B. (2016). Measuring User Experience of the Student-Centered e-Learning Environment. Journal of Educators Online, 13(1), 58-79. [GS Search]
Shiratuddin, N., Hassan, S. & Landoni, M. (2003). A Usability Study for Promoting eContent in Higher Education. Journal of Educational Technology & Society, 6(4), 112-124. [GS Search] Ssemugabi, S., & De Villiers, R. (2007, October). A comparative study of two usability evaluation methods using a web-based e-learning application. In Proceedings of the 2007 annual research conference of the South African institute of computer scientists and information technologists on IT research in developing countries (pp. 132-142). ACM. doi: 10.1145/1292491.1292507. [GS Search]
Stoney, S., & Wild, M. (1998). Motivation and interface design: maximising learning opportunities. Journal of Computer Assisted Learning, 14(1), 40-50. doi: 10.1046/j.1365-2729.1998.1410040.x. [GS Search]
Sullivan, G. M., & Artino Jr, A. R. (2013). Analyzing and interpreting data from Likert-type scales. Journal of graduate medical education, 5(4), 541-542. doi: 10.4300/JGME-5-4-18. [GS Search]
Van Der Linden, J., & Van De Leemput, C. (2015). Observatory of students’ uses of computer-based tools. Psychologie française, 60(2), 145-157. doi: 10.1016/j.psfr.2015.02.002. [GS Search]
Van Schaik, P., & Ling, J. (2010). An integrated model of interaction experience for information retrieval in a Web-based encyclopaedia. Interacting with Computers, 23(1), 18-32. doi: 10.1016/j.intcom.2010.07.002. [GS Search]
Zaharias, P., & Pappas, C. (2016). Quality Management of Learning Management Systems: A User Experience Perspective. Current Issues in Emerging eLearning, 3(1), 5. [GS Search] Zaharias, P. (2009). Usability in the context of e-learning: A framework augmenting
‘traditional'usability constructs with instructional design and motivation to learn. International Journal of Technology and Human Interaction (IJTHI), 5(4), 37-59. doi: 10.4018/jthi.2009062503. [GS Search]