Diogo Miguel Ferreira Taveira Gomes
Modeling and Experimental Performance
Analysis of ZigBee/IEEE 802.15.4 for Wireless
Body Area Networks
Diogo Miguel Ferreira Taveira Gomes
2
Modeling and Exper
iment al P er for mance Anal ysis of ZigBee/IEEE 802. 1 5.4 f or W ir eless Body Ar ea Ne tw or ks
Tese de Mestrado
Ciclo de Estudos Integrados Conducentes ao
Grau de Mestre em Engenharia de Comunicações
Trabalho efetuado sob a orientação do
Professor Doutor José Augusto Afonso
Diogo Miguel Ferreira Taveira Gomes
Modeling and Experimental Performance
Analysis of ZigBee/IEEE 802.15.4 for Wireless
Body Area Networks
Acknowledgments
Firstly, I would like to express my deepest gratitude to my parents. Without their love and support, all of this would not possible.
I would like to thank my supervisor, Professor José Augusto Afonso, for the help, patience and guidance, which was essential for the accomplishment of this thesis.
I would also like to thank all my friends that, in one way or another, contributed for this work to be accomplished.
Abstract
The emerging field of wireless body area networks (WBAN) has the potential to play an important role in everyday life, and there are many industries such as health, sports and entertainment that can take advantage of these networks. The wireless monitoring of users’ physical state, in indoor or outdoor environments, can bring benefits in several application scenarios; for example, it can increase patients’ general well-being and reduce caregivers’ workload by allowing continuous monitoring.
This dissertation identifies and analyzes key performance aspects of using the ZigBee and IEEE 802.15.4 protocols in WBAN applications. The main reason behind this work is because these protocols were designed primarily for wireless sensor networks (WSNs) but are also being used in WBAN applications, particularly in the healthcare area. The differences between WSN and WBANs are explained and are used to discuss the usage of the ZigBee and the IEEE 802.15.4 standards in WBANs.
The analysis performed in this work consists mainly in the execution of experimental tests with non-beacon enabled ZigBee/IEEE 802.15.4 networks, using widespread hardware and software platforms from Texas Instruments, regarding relevant quality of service (QoS) metrics (maximum throughput, delivery ratio and network delay), as well as the effects of multiple constraints, such as hidden nodes, clock drift and body interference in the network performance.
A clock drift model was proposed to estimate when two nodes will interfere with each other. This model was conceived due to the lack of support from the ZigBee to overcome this issue. A solution to overcome the clock drift and the hidden node problems was then designed. A parametric software delay model of ZigBee network devices was also defined and introduced into a simulator so that more accurate simulation results could be obtained. The proposed models were deemed valid since they were thoroughly tested and the predicted results were obtained.
Resumo
As redes de sensores sem fios de área corporal (WBAN) têm o potencial de desempenhar um papel importante no dia-a-dia. Hoje em dia há muitas indústrias, tais como na área da saúde, do desporto e do entretenimento, que podem tirar proveito dessas redes. A monitorização sem fios de sinais fisiológicos, tanto em ambientes fechados como ao ar livre, pode trazer benefícios em vários cenários de aplicação, tais como, aumentar o bem-estar de pacientes que são monitorizados e reduzir a carga de trabalho de médicos, permitindo a monitorização contínua.
Esta dissertação identifica e analisa aspetos chave do desempenho das redes ZigBee e IEEE 802.15.4, quando usadas em aplicações típicas das WBAN. A principal motivação para a realização deste trabalho reside no facto de que, apesar de terem sido projetados principalmente para redes de sensores sem fio (WSN), estes protocolos estão também a ser utilizados em aplicações características das WBAN, particularmente na área da saúde. As diferenças entre as WSN e as WBAN são destacadas e usadas para discutir o uso dos protocolos ZigBee e IEEE 802.15.4 nas WBAN.
A análise realizada neste trabalho consiste, principalmente, na execução de testes experimentais de redes ZigBee/IEEE 802.15.4 a funcionar no modo non-beacon enabled, usando as plataformas de hardware e software da Texas Instruments. A análise leva em consideração métricas relevantes (o máximo goodput, a taxa de entrega e o atraso da rede) de qualidade de serviço (QoS) e os efeitos de várias condicionantes, como os nós escondidos, o
clock drift e a interferência do corpo humano no desempenho da rede.
Um modelo para o clock drift foi proposto para estimar quando dois dispositivos irão interferir um com o outro devido a este fenómeno. Este modelo foi concebido devido à falta de capacidade para o ZigBee superar este problema. Posteriormente foi concebida uma solução para ultrapassar os problemas associados ao clock drift e aos nós escondidos. Um modelo paramétrico de atrasos de software em dispositivos de redes ZigBee foi também definido e introduzido num simulador, de modo a que resultados de simulações mais precisos possam ser obtidos. Os modelos propostos foram considerados válidos dado que foram testados e os resultados previstos foram obtidos.
Contents
Acknowledgments ... iii
Abstract ... v
Resumo ... vii
Contents ... ix
List of Figures ... xiii
List of Tables ... xvii
Acronyms and Abbreviations ... xix
1 Introduction ... 1
1.1 Context ... 1
1.2 Motivations and Objectives ... 3
1.3 Contributions ... 4
1.4 Thesis Organization ... 5
2 Wireless Monitoring Overview ... 7
2.1 Wireless Communications ... 7
2.2 Wireless Body Area Networks ... 12
2.2.1 Definition and Applications ... 12
2.2.2 Body Sensor Network ... 14
2.2.2.1 BSN Characteristics ... 16
2.2.2.2 BSN Devices ... 17
2.2.2.3 Physiological Signals ... 19
2.2.2.4 BSN Physical Considerations and Radio Technologies ... 20
2.2.2.5 BSN Communication Architectures ... 22
2.2.3 Quality of Service ... 24
2.3.1 Definition and Applications ... 25
2.3.2 The IEEE 802.15.4 Protocol ... 26
2.3.2.1 IEEE 802.15.4 Protocol Overview ... 26
2.3.2.2 Physical Layer ... 31
2.3.2.3 Medium Access Control Layer ... 33
2.3.3 The ZigBee Protocol ... 35
2.3.3.1 ZigBee Protocol Overview ... 36
2.3.3.2 Network Layer ... 37
2.3.3.3 Application Layer ... 38
2.3.3.4 ZigBee Versions Comparison ... 41
2.4 Summary ... 42
3 Evaluation Setup and Models ... 43
3.1 Experimental Evaluation Platform ... 44
3.1.1 Texas Instruments CC2530 Development Kit ... 44
3.1.2 Texas Instruments Programming Environment ... 46
3.2 QoS Metrics Analysis ... 51
3.2.1 Maximum Goodput Analysis ... 53
3.2.1.1 Maximum Goodput Model ... 53
3.2.1.2 Experimental Evaluation Setup ... 55
3.2.2 Network Delivery Ratio and Delay Analysis ... 56
3.2.2.1 Delivery Ratio Analysis ... 57
3.2.2.2 Delay Analysis ... 58
3.2.2.3 Experimental Evaluation Setup ... 61
3.3 Clock Drift Analysis ... 62
3.3.1 Clock Drift Evaluation ... 63
3.3.1.1 Clock Drift Measurement Setup ... 64
3.3.2 Clock Drift Model ... 65
3.3.2.1 Clock Drift Model Validation Setup ... 68
3.4 Hidden Node Analysis ... 69
3.4.1 Hidden Node Evaluation ... 70
3.4.1.1 Experimental Evaluation Setup ... 71
3.4.2 The HNPAvoidance Protocol ... 72
3.5 Analysis of Body Interference in RF Communications ... 78
3.5.1 Body Interference Experimental Setup ... 80
3.6 ZigBee Software Delay Parametric Model ... 82
3.6.1 The IEEE 802.15.4 Unslotted CSMA-CA Simulator ... 84
3.6.1.1 IEEE 802.15.4 Unslotted CSMA-CA Simulator Evaluation ... 86
3.6.2 Software Delay Parametric Model ... 87
3.6.2.1 Delay Measurements Setup ... 91
3.6.2.2 Model Validation ... 93
3.7 Summary ... 94
4 Experimental Results and Models Validation ... 97
4.1 QoS Metrics Results ... 97
4.1.1 Maximum Goodput Results ... 97
4.1.2 Delivery Ratio and Delay Results ... 99
4.1.2.1 Delivery Ratio ... 100
4.1.2.2 Network Delay ... 104
4.2 Clock Drift Results ... 106
4.2.1 Clock Drift Measurements ... 106
4.2.2 Clock Drift Model Validation ... 107
4.3 Hidden Nodes Results ... 110
4.3.1 Hidden Node Scenario Results ... 110
4.3.2 HNPAvoidance Protocol Evaluation Results ... 112
4.4 Results of Body Interference in RF Communications ... 112
4.5 Software Delay Results and Model Validation ... 115
4.5.1 Software Delay Results ... 115
4.5.2 Model Validation ... 116
4.5.2.1 Maximum Goodput Simulation Results ... 116
4.5.2.2 Delivery Ratio Simulation Results ... 117
4.5.2.3 Delay Simulation Results ... 119
4.6 Summary ... 121
5 Conclusion ... 125
List of Figures
Figure 2.1 - Stack model of a wireless device. ... 9
Figure 2.2 – Wireless sensor device typical architecture (main components) ... 10
Figure 2.3 - Hidden-node (a) and exposed-node (b) scenarios. ... 12
Figure 2.4 - Multi-tiered BSN architecture (adapted from [Ramli11]). ... 13
Figure 2.5 - Example of a BSN. ... 15
Figure 2.6 – Posture Monitoring System overview. ... 23
Figure 2.7 - Star and Peer-to-Peer topologies. ... 27
Figure 2.8 - Cluster tree network topology. ... 27
Figure 2.9 - IEEE 802.15.4 stack model. ... 28
Figure 2.10 - IEEE 802.15.4 superframe structure. ... 28
Figure 2.11 - IEEE 802.15.4 data transfer models in beacon enabled (a) and non-beacon enabled (b) networks. ... 30
Figure 2.12 - IEEE 802.15.4 unslotted CSMA-CA [IEEE4-06]. ... 34
Figure 2.13 - IEEE 802.15.4 slotted CSMA-CA [IEEE4-06]. ... 35
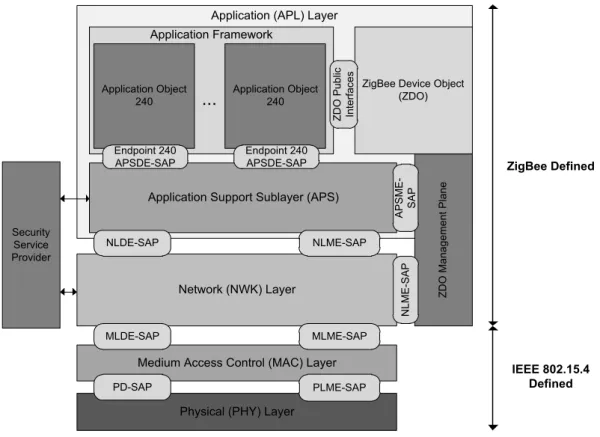
Figure 2.14 – ZigBee model [ZigBee07]. ... 36
Figure 2.15 - Profile definition. ... 40
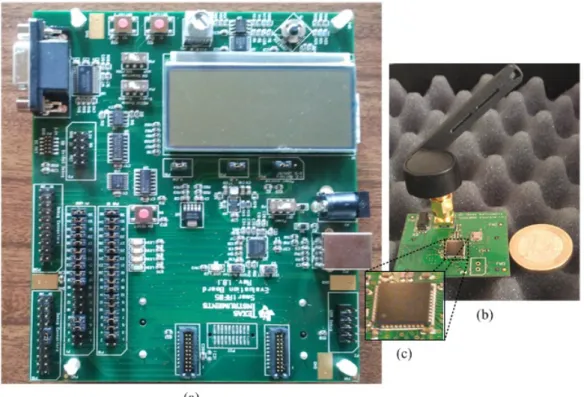
Figure 3.1 – Texas Instruments SmartRF05EB board (a), the CC2330EM module (b) and the SoC CC2530 unit (c). ... 45
Figure 3.2- Z-Stack (a) and TIMAC (b) architectures. ... 47
Figure 3.3- OSAL scheduler algorithm. ... 48
Figure 3.4- IEEE 802.15.4 associated times. ... 53
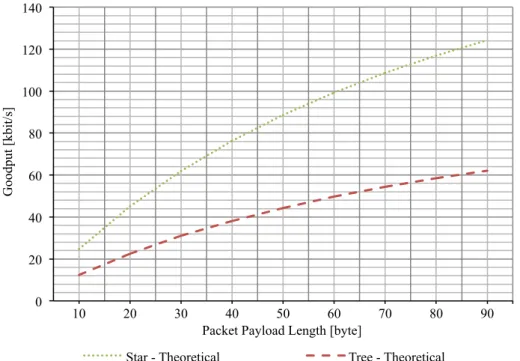
Figure 3.5- Maximum theoretical goodput for star and tree network topologies. ... 55
Figure 3.6 – Star and 2-hop tree experimental topologies. ... 56
Figure 3.7 – Ideal normalized throughput for an increasing number of sensor nodes transmitting in modes A and B, in star and 2-hop tree topologies. ... 58
Figure 3.8 – Experimental configuration to measure the network delivery ratio and the delay in star and 2-hop tree topologies. ... 62
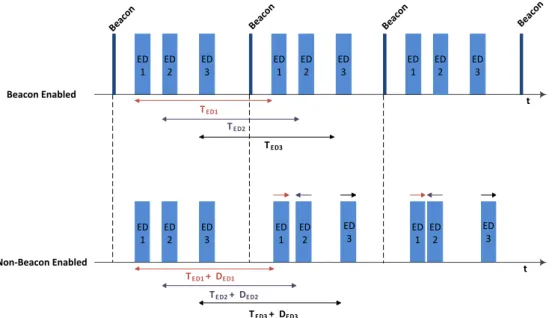
Figure 3.9 - Clock drift effects for periodic packet transmissions in beacon enabled and non-beacon enabled networks. ... 63
Figure 3.10 - Vulnerability window. ... 66
Figure 3.12 - Clock drift experiment test-bed in an anechoic chamber. ... 69
Figure 3.13 - Non-acknowledge IEEE 802.15.4 associated times (a) and its minimum and maximum time boundaries (b). ... 70
Figure 3.14 - Hidden-node experiment test-bed in an anechoic chamber ... 72
Figure 3.15 – HNPAvoidance application level virtual superframe structure. ... 74
Figure 3.16 – HNPAvoidance application algorithm in the network coordinator. ... 75
Figure 3.17 - HNPAvoidance application algorithm in a network end device. ... 76
Figure 3.18 - VTS assignment sequence in the HNPAvoidance protocol. ... 76
Figure 3.19- The sensor module and the communications module of a PMS device. ... 79
Figure 3.20 - Body interference experimental setup in an anechoic chamber. ... 81
Figure 3.21 - Body interference experimental setup in a classroom. ... 82
Figure 3.22 – System Module and the Device model structures implemented with OMNeT++. ... 85
Figure 3.23 – Maximum theoretical and simulated goodput. ... 87
Figure 3.24 – Delay components involved in packet transmission, in a packet relaying and in a packet reception. ... 88
Figure 4.1 – Maximum goodput for star and 2-hop tree topologies. ... 98
Figure 4.2 - Delivery ratio measured with Z-Stack for an increasing number of sensor nodes transmitting in mode A. ... 100
Figure 4.3 - Delivery ratio measured with Z-Stack for an increasing number of sensor nodes transmitting in mode B. ... 101
Figure 4.4 – Transmission model for tree topologies with Z-Stack. ... 102
Figure 4.5 - Delivery ratio measured with TIMAC for an increasing number of sensor nodes transmitting in mode A. ... 103
Figure 4.6 - Delivery ratio measured with TIMAC for an increasing number of sensor nodes transmitting in mode B. ... 103
Figure 4.7 - Average delay as a function of the number of sensor nodes transmitting in mode A for both Z-Stack and TIMAC. ... 104
Figure 4.8 - Maximum delay as a function of the number of sensor nodes transmitting in mode A for both Z-Stack and TIMAC ... 105
Figure 4.9 - Maximum delay as a function of the number of sensor nodes transmitting in mode B for both Z-Stack and TIMAC. ... 106
Figure 4.10 - Delivery ratio using a 60 message window in a two hidden-nodes start topology in an anechoic chamber. ... 108
Figure 4.11 - Record of received packets in the hidden-node experiment in mode star_without_ack. ... 111 Figure 4.12 - Delivery ratio using a 60 message length window with two hidden nodes in a star topology. ... 112 Figure 4.13 –Goodput measured and simulated for star and 2-hop tree topologies in mode 2. ... 117 Figure 4.14 - Delivery ratio measured and simulated for an increasing number of sensor nodes transmitting in mode A. ... 118 Figure 4.15 - Average delay measured and simulated for an increasing number of sensor nodes transmitting in mode A ... 120 Figure 4.16 - Maximum delay measured and simulated for an increasing number of sensor nodes transmitting in mode A. ... 120
List of Tables
Table 2.1 - ISM bands. ... 8
Table 2.2 - BSN healthcare applications [Baraka12]. ... 15
Table 2.3 - Characteristics of various energy sources available in the environment and the harvested power [Fiorini08]. ... 19
Table 2.4 – Vital signals electrical characteristics [Gama09]. ... 19
Table 2.5 – Posture Monitoring System parameters. ... 23
Table 2.6 - IEEE 802.15.4 2006 [IEEE4-06] PHY configurations. ... 31
Table 2.7 - PHY PIB attributes. ... 32
Table 2.8 - CSMA-CA attributes and constants [IEEE4-06]. ... 33
Table 2.9 – ZigBee versions compared. ... 41
Table 3.1- Parameters common to all experimental tests. ... 52
Table 3.2 – Mean backoff interval in the CSMA-CA. ... 54
Table 3.3 - Traffic operation modes used in the delivery ration and delay experiments ... 57
Table 3.4 - Network operation modes considered in the delivery ration and delay experiments ... 57
Table 3.5 - Minimum delay experienced by a packet transmitted in mode A and mode B in a non-beacon enabled star network. ... 59
Table 3.6 – Maximum delay experienced by a packet transmitted in mode A and mode B in a non-beacon enabled star network. ... 60
Table 3.7 – Notation used in the parametric delay model. ... 91
Table 3.8 – Minimum and maximum values for the TRTT parameter. ... 93
Table 4.1 - Measured and calculated differential clock drifts in ppm. ... 107
Table 4.2 – Interference and interference repetition periods. ... 108
Table 4.3 – PER and RSSI values obtained inside an anechoic chamber. ... 114
Table 4.4 - PER and RSSI values collected in an indoor environment. ... 115
Acronyms and Abbreviations
ACK Acknowledgment
AODV Ad-hoc On-Demand Distance Vector API Application Programming Interface APL Application Layer
APS Application Support Sublayer APSDE APS Data Entity
APSME APS Management Entity BCU Body Control Unit BE Backoff Exponent BI Beacon Interval BO Beacon Order BS Base Station
BSN Body Sensor Network CAP Contention Access Period CCA Clear Channel Assessment CDMA Code Division Multiple Access CFP Contention Free Period
CRC Cyclic Redundancy Check CSMA Carrier Sense Multiple Access
CSMA-CA Carrier Sense Multiple Access with Collision Avoidance CSP Command Strobe Processor
CW Contention Window DR Delivery Ratio
ECG Electrocardiography, Electrocardiogram
EEG Electroencephalography, Electroencephalogram EMG Electromyography, Electromyogram
FDMA Frequency Division Multiple Access FFD Full Function Device
FIFO First In First Out
GT Guard Time
HAL Hardware Abstraction Layer HNP Hidden Node Problem IC Integrated Circuit
IEEE Institute of Electrical and Electronics Engineers ISM Industrial, Scientific, and Medical
ITU International Telecommunications Union ITU-R ITU - Radiocommunication Sector
LQI Link Quality Indicatior MAC Medium Access Control MCPS MAC Common Part Sublayer MLME MAC Layer Management Entity NPDU NWK PDU
MT Monitor and Test NB Number of Backoffs NWK Network
OMNeT Objective Modular Network Testbed OSAL Operating System Abstraction Layer OSI Open Systems Interconnection PAN Personal Area Network
PC Personal Computer PD Personal Device
PDA Personal Digital Assistant PDU Packet Data Unit
PER Packet Error Ratio PHY Physical
PIB PAN Information Base
PLME PHY Layer Management Layer PPDU PHY Packet Data Unit
PSDU PHY Service Data Unit QoS Quality of Service RF Radio Frequency
RFD Reduced Function Device
RSSI Received Signal Strength Indicator
SAP Service Access Point SD Superframe Duration SO Superframe Order SoC System on Chip
TDMA Time Division Multiple Access
TX Transmit
UART Universal Asynchronous Receiver/Transmitter UBP Unit Backoff Period
WAN Wide Area Network
WBAN Wireless Body Area Network WLAN Wireless Local Area Network WPAN Wireless Personal Area Network WSN Wireless Sensor Network
ZC ZigBee Coordinator ZCL ZigBee Cluster Library ZDO ZigBee Device Object ZDP ZigBee Device Profile ZED ZigBee End Device ZR ZigBee Route
Chapter 1
1 Introduction
1.1 Context
Recent advances in the development of wireless communication and sensors for monitoring physiological signals are instigating the research in the field of Wireless Body Area Networks (WBAN), also commonly known as Body Sensor Networks (BSN). A BSN consists of a group of sensor devices distributed over the human body using a wireless network to support communications. New sensors have been developed to monitor many kinds of physiological parameters with great value for healthcare, performance evaluations of sport athletes or even in the entertainment business. In healthcare monitoring systems, BSNs can be used to collect and send signals obtained from the electroencephalogram (EEG), electrocardiogram (ECG), electromyogram (EMG), oximetry and other physiological parameters such as temperature or blood pressure. BSN-based monitoring can provide benefits in the diagnosis and treatment of patients without constraining their normal activities. It allows the patient to move freely inside or outside the hospital environment while providing continuous monitoring, which can be very useful when an extended period of monitoring is required. For example, many cardiac diseases are associated with episodic abnormalities such as transient surges in blood pressure or arrhythmias [Lo05]. These transient abnormalities cannot always be detected using conventional monitoring equipment. BSNs have the potential to provide early detection and prevention of pathologies, replacing expensive therapies later on. BSNs may be used in the sports sector to monitor the respiration rate or the athlete’s movements to optimize their performances. For example, swimming athletes synchronize
their movements and respiration rate, which can be improved by analysing the data to correct imprecisions. BSNs are also being extensively used in the entertainment industry where users interact with video games using their movements, which are acquired through kinetic sensors.
Every WBAN application usually has specific requirements and, due to this heterogeneity, a standard specification for the WBANs has not yet been published because to derive an all-in-one solution is very complex. The IEEE 802, an organization for the standardization of communication network protocols that proposed worldwide successful specifications such as the IEEE 802.11 standards, established the Task Group IEEE 802.15.6, or IEEE 802.15 TG6, for the standardization of WBANs. The main objective of the IEEE 802.15.6 is to define new Physical (PHY) and Medium Access Control (MAC) layers for WBAN. This standard aims to include a network solution for both medical/healthcare and other non-medical applications with different requirements by supporting short range, low-cost, ultra-low power, high reliability and the coexistence of several applications into the same BSN for wireless communications in and around the body [IEEE6-08].
The MAC is the core protocol of any shared medium communication network. Thus, a suitable MAC layer is fundamental to fulfill WBAN requirements. In the Open Systems Interconnection (OSI) model, the MAC belongs to the first layer above the PHY layer and is used to coordinate the access of the nodes to the network communication medium. Its fundamental task is to avoid collisions, which have negative impact to the network performance. For WBAN systems, it has also the important task of providing Quality of Service (QoS) support to the applications, by controlling metrics like throughput efficiency, latency, communication reliability and energy efficiency. The MAC is one of the key layers regarding energy consumption in a WBAN because, since it acts upon the PHY layer, it can set the state of the nodes radio transceiver, which usually is the component that has the highest energy consumption rate in a low power sensor device. To reduce the energy consumption, the transceiver’s state may be switched to sleeping mode, reducing the amount of energy wasted during idle periods. Typically, wireless MAC protocols are divided in two groups: contention-based or random access; and contention-free or scheduled access protocols. In contention-based MAC protocols such as Carrier Sense Multiple Access-Collision Avoidance (CSMA-CA), the nodes perform the Clear Channel Assessment (CCA) function to sense the channel before transmitting the data, in order to prevent collisions. Contention-free MAC protocols usually use techniques such as Time Division Multiple Access (TDMA) where packets may be transmitted into a time slot allocated to a particular
sensor node. Other medium access techniques like Code Division Multiple Access (CDMA) or Frequency Division Multiple Access (FDMA) are not suitable in the context of the wireless sensor networks (WSN) due to limitations in frequency spectrum availability and computation capability [Gopalan10].
The IEEE 802.15.4 standard [IEEE4-03], particularly combined with the ZigBee protocol stack, is a widely adopted protocol in WSN applications, and is being used as an alternative for health care applications [Li09][López11]. The standard defines the PHY and MAC layers for low data rate, low power and low complexity short range radio frequency (RF) transmissions in a Wireless Personal Area Network (WPAN). The IEEE 802.15.4 was originally designed for WSN, in which, usually, most of the supported applications generate low traffic loads to the network. Typically, WSN applications generate traffic only when triggered by external events, e.g., an out of range event detected through sensors (e.g. temperature or humidity). On the other hand, some BSN applications are data-intensive, generating a considerable amount of traffic due to high sampling rate requirements from some sensors.
1.2 Motivations and Objectives
The IEEE 802.15.6 WBAN standard is still in a development phase, where it is receiving several contributions from different manufactures in order to define the new specification. Meanwhile, the ZigBee/IEEE 802.15.4 protocols already present several products in the market from multiple manufacturers and are currently being used in WBAN applications. Since the ZigBee/IEEE 802.15.4 standards were not originally developed taking into consideration the specificities of WBAN applications, further analysis and revisions of these protocols are necessary, making this the main motivation for the development of the dissertation.
The main objectives in this work are:
• To analyze the performance of non-beacon enabled ZigBee/IEEE 802.15.4 networks in the context of WBAN applications, through experimental and simulation evaluations of relevant QoS metrics (maximum throughput, network delivery ratio (DR) and data delay), and the effects of multiple constraints, namely, hidden-nodes, clock drift effects and body interference;
• To propose a solution to mitigate the hidden-node problem and clock drift effect in data-intensive WBANs with periodic traffic;
• To measure the software processing delay introduced by ZigBee/IEEE 802.15.4 devices and to define and integrate a parametric model that takes into account this delay into a simulator.
The experimental platform used to produce the results presented in this work was developed and tested using the ZigBee 2007 [ZigBee07] and IEEE 802.15.4-2006 implementations provided by Texas Instruments: the Z-Stack and the TIMAC, respectively. The hardware test platform is based on the CC2530 [TICC2530-10] System on Chip (SoC) integrated circuit (IC), which is also provided by Texas Instruments. This SoC includes a microcontroller and a transceiver compatible with the IEEE 802.15.4 standard, thus enabling the development of smaller sensor devices. The platform used in the simulations was the OMNeT++, which provides a simulation development environment based on discrete time events. It was used a software simulation model of the unslotted CSMA-CA of the IEEE 802.15.4 protocol implemented by Pedro Macedo in his master´s degree thesis [Macedo10].
1.3 Contributions
The main contributions of this work are:
• Experimental evaluation of the performance of ZigBee/IEEE 802.15.4 networks in the context of WBAN applications. Results for the maximum throughput in a ZigBee sensor device; and the DR and delay for networks composed by up to 5 sensor devices transmitting to the coordinator in star and 2-hop tree topologies; are provided.
• Experimental evaluation based on the Packet Error Ratio (PER) and Received Signal Strength Indicator (RSSI) using a fully wireless WBAN system, regarding the interference of the human body in the radio communications;
• The definition of a model to predict the effect of the clock drift in the performance of data-intensive WBANs with periodic traffic;
• The proposal and implementation of an application level algorithm to solve the hidden-node problem (HNP): the HNP Avoidance protocol;
• The definition of a parametric model to characterize the ZigBee/IEEE 802.15.4 software processing delay and its integration into a simulator in order to obtain more accurate simulation results.
1.4 Thesis Organization
This thesis is divided into five chapters, which are described as follows:
Chapter 2 provides an overview of WBANs regarding the communication architectures and technologies that were used, as well as a description of WSNs based on the ZigBee/IEEE 802.15.4 protocol, which includes these two protocols and other protocols of particular interest. This chapter also describes a kinetic monitoring system whose traffic parameters are used on the performance evaluations presented in this work.
Chapter 3 describes the configurations adopted in the experimental tests that were executed to evaluate the performance of ZigBee networks when supporting data-intensive BSN applications. An introduction to the hardware that was used and a brief explanation of the programming environment are given. A number of QoS metrics are considered, and a connection from a theoretical standpoint to a more practical analysis is established. A model for software delay is proposed, and the simulator where it was implemented is described. The clock drift effect and a method to measure it are explained. The hidden node problem is discussed alongside with a protocol developed to solve this issue. Finally, the evaluation setup to a set of experiments regarding the body interference in the radio communications is provided.
Chapter 4 presents the results obtained from the experimental component of this work, using the experimental evaluation scenarios and the proposed models detailed in the previous chapter. A series of graphs and tables are used to demonstrate the results from these experiments, which are commented and discussed
Finally, chapter 5 presents the conclusions and indicates possible lines of future work for this research topic.
Chapter 2
2 Wireless Monitoring Overview
This chapter provides some useful background information related to the topic presented in this work. An overview of wireless communications is given, covering body sensor networks, wireless sensor networks, and some protocols of particular interest, namely the IEEE 802.15.4 and the ZigBee protocols. This chapter also presents a body sensor network applied to motion capture, the posture monitoring system (PMS), whose traffic parameters were used to acquire the results presented in this work.
2.1 Wireless Communications
Wireless communications started in the late 19th century when the wireless telegraph was created. Since then, wireless communications have evolved drastically; however, the foundation for most communication systems is still present, where radio waves are used for the transmission of information. The radio spectrum and wireless systems standardization are managed worldwide by the International Telecommunications Union (ITU) Radiocommunication Sector (ITU-R). Additionally, different national and regional agencies may be responsible for further regulations. Radio spectrum has several licensed frequency bands allocated to different communication technologies, e.g., radionavigation or terrestrial mobile communications. A group of license free bands were assigned to industrial, scientific and medical (ISM) applications [Akyildiz02]. These bands, known as ISM bands, are listed in Table 2.1. The main advantage of using the ISM bands is that they are license free, unlike the other bands that are allocated to particular paid communication services. On the other hand,
many wireless technologies use the ISM bands, e.g., systems based on the IEEE 802.11 and IEEE 802.15.4 standards, Bluetooth and other private or research technologies. This may have a negative impact because, if several network technologies share the same physical medium and frequency band, the level of interference may increase significantly, which may cause the degradation in the performance of these networks. The IEEE 802.15.4 standard was the foundation for the development of this work and the 2.4 GHz frequency band is used, but unfortunately is also used by IEEE 802.11-based Wireless Local Area Networks (WLANs), making these networks susceptible to interference.
Table 2.1 - ISM bands.
Frequency range Centre frequency
6.765 MHz - 6.795 MHz 6.780 MHz 13.553 MHz - 13.567 MHz 13.560 MHz 26.957 MHz - 27.283 MHz 27.120 MHz 40.660 MHz - 40.700 MHz 40.680 MHz 433.050 MHz - 434.790 MHz 433.920 MHz 902.000 MHz - 928.000 MHz 915.000 MHz 2.400 GHz - 2.500 GHz 2.450 GHz 5.725 GHz - 5.875 GHz 5.800 GHz 24.000 GHz - 24.250 GHz 24.125 GHz 61.000 GHz - 61.500 GHz 61.250 GHz 122.000 GHz - 123.000 GHz 122.500 GHz 244.000 GHz - 246.000 GHz 245.000 GHz
In order to communicate, wireless devices must agree on a communication protocol, which allows the exchange of messages by defining their meaning and structure. A communication protocol is usually very complex to implement, hence, it is organized in layers where each layer is designed to accomplish different functions. Through the service access points (SAPs), each layer uses services provided by lower layers and offers a set of services to the layers above it. Figure 2.1 represents the stack structure of the protocol used in this work. Vertical arrows symbolize the communication between layers on the same device, while each arrow connecting the same layer of different devices represent that layer’s logical communication.
The physical layer (PHY) is responsible for the management of the radio hardware, e.g., to transmit and receive data and the signal modulation. The medium access control (MAC) layer manages the access of the network devices to the medium. The network (NWK) layer is introduced for routing frames through the network and, among other tasks, to create and maintain the network or to discover new routes. The application (APP) layer provides, for
instance, support for a multitude of applications in the device [ZigBee07]. Application (APP) Layer Network (NWK) Layer Medium Access Control (MAC) Layer
Physical (PHY) Layer Wireless Channel
Wireless Device 1 Application (APP) Layer Network (NWK) Layer
Medium Access Control (MAC) Layer
Physical (PHY) Layer Wireless Device 2
Figure 2.1 - Stack model of a wireless device.
Wireless communications are highly susceptible to interference due to the channel propagation characteristics, caused by phenomena such as large-scale fading and small-scale fading, and co-channel interference, which is caused by undesired transmissions on the same frequency channel by neighbor networks [Trigui09]. Large-scale fading is a consequence of the obstacles that affect the propagation of the radio waves, e.g., the walls in the interior of a building that may be separating network devices. Small-scale fading is caused by surfaces that reflect the radio waves. When these reflections occur, multiple copies of the transmitted signal may reach the receiver, which may result in a constructive or destructive interference because these copies of the signal experience different attenuation, delay and phase shift which, consequently, may cause unpredictable results. Other different sources of noise, for instance, radiofrequency interference generated by electric power transmission lines, may also introduce interference to the communications system [Mattos96].
The quality of service (QoS) is an important aspect in the context of the wireless communications. Several applications have different QoS requirements that must be assured by the wireless network. For instance, medical monitoring applications usually have low bandwidth requirements but are usually intolerant to high delays and data loss. On the other hand, file transfer applications can tolerate relatively high packet delays but are intolerant to data loss [Soomro06]. Different metrics are used to evaluate the QoS provided by the network, which is the case of the network delivery ratio (DR), the delay or the jitter. The
delivery ratio represents the percentage of successfully delivered packets in relation to the number of generated packets. The delay, or latency, represents the time period between the instants of generation and delivery of each packet. The jitter represents the variation of the delay and may me caused, for example, by an alternative route taken by a packet to reach its destination. Since the QoS must be guaranteed by the protocols used to support the network, every layer that constitutes the stack may have influence in the network response to the application requirements. For instance, in the lower layers, the modulation and codification techniques used may enhance the overall robustness against interferences of the transmitted signals, optimizing the QoS experienced in the applications. In the upper layers, MAC protocols, retransmissions and other error correction mechanisms may also influence the QoS provided to the applications.
Figure 2.2 shows the architecture of a wireless sensor device. The typical main components of wireless sensor devices are as follows: the memory, the microcontroller, sensors and/or actuators, the radio transceiver (and the respective antenna), the energy source (usually battery powered) and the interfaces between the components. The battery is one of the most important components and it has to be carefully chosen because it can affect the design and longevity of the device, in which the maximization of the latter is commonly desired [Vieira07]. Figure 2.2 illustrates a general architecture for wireless sensor devices because, usually, vendors may choose to implement their own architectures. At the implementation level, in system-in-package (SiP) wireless devices, the main components are available separately. On the contrary, in system-on-chip (SoC) devices memory, radio transceiver and the microcontroller components are integrated onto the same chip. SoC architectures tends to be the mostly accepted among vendors, aiming for the miniaturization of their wireless sensor devices [TICC2530-10] [Jennic10].
Figure 2.2 – Wireless sensor device typical architecture (main components) Microcontroller Memory Sensors/ Actuators Radio Battery
In general, wireless sensor devices use crystal oscillators to derive time. Each device has its own oscillator, which means that different devices have different clock frequencies. The deviation of the real clock frequency with relation to the nominal clock rate is referred as clock drift. Clock drift is often expressed in parts per million (ppm), which means that after a million nominal frequency oscillations the real clock would have n ppm additional or missing oscillations. Air pressure, temperature or the electric supply voltage may cause short-term variations in the oscillator frequency, and the equipment’s aging may cause long-term variations [Brzozowski09].
The hidden node and exposed node are inherent problems to carrier CSMA-based wireless network protocols. In carrier sense-based mechanism, before a device transmits a packet, it must always sense the wireless channel in order to avoid collisions with transmission from other devices in the network. This procedure is executed by the CSMA-CA mechanism of the IEEE 802.15.4 standard, one of the protocols under evaluation in this work. Figure 2.3 (a) illustrates a hidden node scenario in an IEEE 802.15.4 network between nodes A and C, where a circumference around the transmitting nodes represents their signal range r. These nodes are unable to sense each other’s transmissions if they are separated by a distance
d > r. Consider that a node B, in the range of both A and C, is receiving the transmission of A.
If C wants to transmit a packet using a CSMA-CA protocol, the carrier sense procedure fails, since A is hidden from C. Therefore, C will start its transmission, causing a collision with the packet that is being transmitted by A at the receiver (B), which makes both packets to be lost. We refer to this situation as hidden-node problem (HNP), due to the degradation that may be introduced in the network performance when packets keep colliding due to the failure of the carrier sense mechanism. The exposed node problem is shown in Figure 2.3 (b) where the CSMA-CA algorithm in the device E, which wants to transmit data to D, reports a busy channel because the device F is transmitting to G. In this case, G cannot hear E and D cannot hear F, hence, the transmissions will never collide, and nevertheless, the CSMA-CA algorithm will block the transmission of device E.
Figure 2.3 - Hidden-node (a) and exposed-node (b) scenarios.
The hidden node and the exposed node situation illustrated in Figure 2.3 are based on the limitation in the nodes radio signal range, which is caused by the free space path loss. However, there are other factors related to the spatial configuration and the propagation effects on the place where the nodes are located, such as fading or shadowing, which can also cause these situations.
2.2 Wireless Body Area Networks
2.2.1 Definition and Applications
A wireless body area network (WBAN) is a set of one or more body sensor networks (BSNs) used to monitor several parameters on, in or around the human body. WBAN applications include healthcare systems, athletic training, workspace safety, consumer electronics, secured authentication systems and safeguarding of uniformed personnel. A BSN consists in a group of sensors distributed over the human body, which are used to monitor several physiological signals and actions, with a wireless network to support communication. These monitored parameters may be stored in a personal device, e.g., a personal digital assistant (PDA) or smartphone, which collects the data from the sensor nodes and then transmit it to a personal computer (PC) or a datacenter for storage and for further analysis. The BSN topic is discussed in more detail in section 2.2.2.
In comparison to wired systems, WBAN healthcare monitoring systems aims to improve the way patients are cared for, providing a better quality of life and care for the patients. WBAN healthcare monitoring systems allows patients to move freely inside or outside the hospital environment without limiting their normal day-to-day activities while providing
r r d A C B (a) E D F G (b)
continuous monitoring. This can be extremely useful as preventive care when a long period of monitoring is required for the detection of a particular disease as preventive care.
WBANs architectures may be classified into two categories: flat and multi-tier [Chin12]. In flat architectures, a BSN is composed of a single data-gathering unit that transmits the information to a PC or a personal server application running on a PDA. In multi-tier architectures, the BSN define the first tier (Tier-1-Comm). At a second tier (Tier-2-Comm), WBANs can be connected to Local Area Networks (LANs) and Wide Area Networks (WANs) through various wired and wireless communication technologies. At the last tier (Tier-3-Comm), the BSN may be accessed through computing devices, such as a PC or a PDA, by healthcare workers or the patient. Figure 2.4 shows the position of the WBANs in the realm of the wired/wireless communication networks and the multi-tiered BSN architecture. PDA BS Temperature Sensor Light Sensor Data Server PC BSN WB AN
WPAN LAN/WLAN
MAN/WMAN WAN
Intra-BSN comm (Tier-1-Comm)
Inter-BSN comm (Tier-2-Comm)
Beyond-BSN communication (Tier-3-Comm)
Wired/Wireless Link Wireless Link
BSN Wired/Wireless Link
Figure 2.4 - Multi-tiered BSN architecture (adapted from [Ramli11]).
WBANs emerged from the existent wireless personal area networks (WPAN) technologies, which are used for short-range communications between wireless devices (≤ 10 m) [Ramli11]. Devices from a WPAN may vary in their capabilities, but typically have low processing and storage capabilities, and can be battery or mains-powered. WPANs may be used to obtain more information about a patient’s living space through the measurement of several environment properties, such as luminosity, humidity, temperature or movement. This
may provide more specific information about the spatial context in which a patient is being monitored. The data in a WPAN are usually transmitted to a base station (BS), which may also be used to collect the data from a WBAN.
A WBAN may vary on the communication system architecture because it usually depends on particular contexts, more specifically, the location or the environment where the patients are being monitored. The data generated by the BSNs may be collected by a BS, which may interface with different communication infrastructures, such as private (e.g., Wi-Fi networks), public (e.g., the Internet or a mobile communication network) or ad-hoc networks. The following points describe three possible WBAN system architectures using different network communication infrastructures:
• A patient may be monitored in a hospital and a BS may collect the data generated by the BSN. The BS connects the BSN to the LAN implemented in the hospital, which connects devices such as PCs, PDAs or data servers. A PDA may also gather the BSN data and then transmit it directly to a PC or a data sever through the LAN. Finally, patients and physicians may access the information via PCs or PDAs in the LAN. • A patient may be monitored at home or in an ambulance and the BSN uses a PDA or a
BS to communicate with remote servers or physicians using a public network infrastructure such as the Internet, cellular communication networks or satellite communications.
• An ad-hoc WBAN may be created in the case of a major catastrophic event where a set of BSNs may be created to monitor injured people in an outdoor incident area. This ad-hoc network may use short-range devices that transmit and relay data among patient devices until reaching a caregiver’s device.
2.2.2 Body Sensor Network
As we previously defined, a BSN is a group of sensor devices distributed in, on or around the human body that are used to monitor several physiological parameters and are capable of establishing a wireless communication network. Figure 2.5 shows an example of a BSN composed by several heterogeneous sensor devices strategically positioned in the human body transmitting the monitored information to a PDA using a wireless link. BSNs have gained much interest and have become an emerging technology in healthcare services. These services are used to monitor patients’ vital signs while taking advantage of wireless
monitoring, which can provide some benefits in the diagnosis and treatment of patients without constraining their normal activities. Continuous monitoring is possible and can be of vital importance due to the ability to monitor for extended periods of time, making it possible to detect health abnormalities within a bigger time frame compared to periodic monitoring.
PDA Pulse Monitor EEG ECG Motion Temperature Figure 2.5 - Example of a BSN.
A set of possibilities for medical diagnosis and treatment applications, sensors and the role of the BSNs are described in Table 2.2.
Table 2.2 - BSN healthcare applications [Baraka12].
Field of
Application Sensors Role of the BSN
Cardiovascular diseases
Pulse oximeter, heart rate sensor, and ECG sensor.
An internist can prepare treatment in advance as he receives the patient’s monitored information related to the heart behavior. Cancer Nitric Oxide sensor.
A sensor can be placed in a cancer suspected area and an internist may start a proper treatment as soon the cancer is detected. Diabetes Biosensor gyroscope, insulin actuator.
If the sensor monitors a sudden drop of glucose, a signal can be sent to the insulin actuator in order to start the injection of insulin.
Post-operation care
Temperature sensor, blood pressure sensor, heart rate sensor, ECG.
A patient may be continuously monitored without restraining them to the bed, which improves the patient’s quality of life.
Every BSN application usually has specific requirements and, due to this heterogeneity, a standard specification for the WBANs has not yet been published because deriving an
all-in-one solution is very complex. The task of developing a standard protocol for energy-efficient devices and WBAN applications is assigned to the Task Group IEEE 802.15.6. The IEEE 802.15.6 standard is discussed in section 2.2.2.4.
2.2.2.1 BSN Characteristics
As we previously mentioned, WBANs and BSNs emerged from WPANs, which are related to wireless sensor networks (WSNs). In spite of this relation, there are some differences between BSNs and WSNs, which are related to the applications requirements and characteristics. Protocols and algorithms designed for conventional WSNs may not be suitable for the BSNs due to these differences. Next, we describe some BSN requirements and characteristics:
• As seen in the last section, BSNs, unlike WSNs, are typically used in multi-tier systems.
• Sensor devices in WSNs usually have homogeneous requirements in terms of the data rate, power consumption and reliability of the network. On the other hand, sensor devices requirements in the realm of the BSNs often have heterogeneous network requirements.
• Sensor devices in BSNs are placed in strategic locations in the human body in order to correctly monitor a desired parameter and, consequently, provide an efficient way to capture data. Unlike BSNs, sensor devices of the WSNs may be randomly spread in an area to be monitored.
• The transmission power is an essential parameter in BSNs due to aspects related to the proximity of the sensor devices in the human body. These aspects include user health concerns, the interference between BSNs caused by the high transmission power and the human body as a propagation medium with great losses, which considerably attenuate the transmitted radio waves until they reach the receiver. In WSNs, there is a concern for reducing the transmission power for providing an extended lifetime for these sensor devices, thus saving one of the most precious resources in these networks: energy.
• Depending on the applications requirements, BSNs may be highly sensitive to the network latency because some latency-critical BSNs may generate alarm events that need an emergency response from the healthcare provider. On the other hand, conventional WSN applications do not usually have concerns regarding
critical-latency requirements and, because of this, mechanisms to save energy are used, where sensor devices may enter sleep mode and transmit data only when awake, even if a transmission event were set during the sleep mode.
• In order to monitor users’ vital signs, BSN applications usually generate periodic traffic to the network due to the monitored signals characteristics, which are discussed in section 0. On the other hand, conventional WSN applications usually generate traffic when triggered by a particular event. This distinct behavior accentuates the difference between the data rates required by these two types of networks.
• The energy source is an important aspect both in BSNs and WSNs, where the sensor devices should operate for months or even years. Unlike WSNs, the battery replacement in the sensor devices may be more difficult in BSNs and a greater issue when they are implanted inside the human body.
• A BSN uses a reduced number of sensor devices when compared with the WSNs, due to the smaller coverage area. Conventional WSNs are used to monitor huge areas while BSNs only cover the area around the human body.
• BSNs sensor devices may move freely according the user movements, so the relative position between devices may change frequently. Thus, BSNs should be robust against the changes in the physical topology. On the other hand, in WSNs, sensor devices are usually static.
• BSN critical health applications are usually intolerant to data loss caused by a network failure, so the network reliability is of great importance, unlike in the conventional WSNs where a failure on a sensor device may be compensated by another sensor device.
• Security is of utmost importance in the BSNs. BSNs information must be protected from unauthorized users while being transferred and stored. Security requirements must comply with several needs such as confidentiality, integrity, availability and access control.
The previous discussed characteristics show that BSNs have unique requirements compared to the conventional WSNs, which are also discussed in section 2.3.
2.2.2.2 BSN Devices
In [Barakah12], three types of devices for the BSNs are considered: the sensor device, the actuator device and the personal device (PD).
The sensor device is a device that gathers the physiological data, processes it, if required, and reports it through a (wireless) communication system. Every BSN has at least one sensor device. The (wireless) sensor device is constituted by the sensor hardware, a power unit, a processor, memory and a transceiver, and typically has very limited computational and energy resources.
The actuator is a device carried by a patient and acts according to the information collected by the deployed sensor devices, where a proper treatment may be administrated to the patients immediately after the sensor devices detect some problem or when triggered by a doctor that has analyzed the collected data. An actuator device node can consist of a receiver or transceiver, a power unit, a processor and memory, where main component is the actuator hardware. For example, when a patient is being monitored for diabetes and a sensor detects a sudden drop of glucose, a signal can be sent to the actuator device in order to start an injection of insulin.
The PD is also known as body control unit (BCU), body gateway or a sink. The PD can be a dedicated unit or, in some implementations, a PDA or a smartphone. The PD’s main function is to collect all the BSN information and relay it to the user or to an internist via an external gateway. The core components of this device are a power unit, a large processor, a large memory and a transceiver; hence computing and energy resources are considerably higher than in sensor and actuator nodes.
Another type of device, the base station (BS), is also considered in other systems [Shnayder05][Silva11]. This is a stationary device that collects the data packets directly from the sensor devices and transmits the information to a PC through a wired connection. Then, the PC may show the gathered information or relay it through an external gateway.
Energy Scavenging/Harvesting
Energy scavenging, or energy harvesting, refers to methods for sensor and actuator devices to obtain energy from their surrounding environment, since these devices have limited battery power. If a device can obtain energy from the environment where it is placed, it can become more autonomous or at least reduce human intervention. There are many different sources that can be used to obtain energy, for example: the sun, the wind, thermal sources and vibration. Regarding BSNs, the most convenient energy sources may be those provided by the human body, such as body heat and body vibration. However, current scavenging technics are only able to extract small amounts of energy from a source, where the scavenged energy is
proportional to the size of the scavenging device. Table 2.3 summarizes the power that could be harvested from different environmental sources.
Table 2.3 - Characteristics of various energy sources available in the environment and the harvested power [Fiorini08].
Energy Source Source Characteristics Harvested Power
Ambient Light Indoor 0.1 mW/cm2 10 µW/cm2 Outdoor 100 mW/cm2 10 mW/cm2 Vibration/Motion Human 0.5m@1Hz 1m/s2@50Hz 4 µW/cm2 Industrial 1m@5Hz 10m/s2@1kHz 100 µW/cm2 Thermal Energy Human 20 mW/cm2 30 µW/cm2 Industrial 100 mW/cm2 1 - 10 mW/cm2
The sources characteristics vary with size, which is the case of the ambient light and thermal energy sources, or are based on movements and accelerations patterns, which can be mathematically approximated by sinusoidal functions of vibratory or motion sources. Considering a 1 cm2 area for the harvesting device which is responsible to take the energy from the source and convert it to electrical power, the energy obtained may be used in systems with power consumption in the range of 10 µW – 10 mW [Fiorini08] for ambient light, vibrations/motion and thermal energy sources.
2.2.2.3 Physiological Signals
In a BSN, different physiological signals may be monitored simultaneously and these signals usually have heterogeneous network requirements. This is the case of a BSN monitoring different vital signs from postoperative patients, which may include ECG, blood pressure, heart rate and temperature. Table 2.4 shows the electrical characteristics of the vital signs usually monitored in emergency medical care.
Table 2.4 – Vital signals electrical characteristics [Gama09].
Vital Signal Frequency Range (Hz) Sampling rate (Hz) Resolution (bit) Data Rate (Kbit/s)
ECG (per lead) 0.01 … 60-250 120 - 500 16 4
Temperature 0 … 0.1-1 0.2 - 2 12 0.024
Oximetry 0 … 30 60 12 0.72
Blood Pressure 0 … 60 120 12 1.44
Respiration Rate 0.1 … 10 20 12 0.24
The information obtained from these signals is sent in data packets to the base station in burst or in single packets, which is the case where there is no medical emergency monitoring situation. In urgent medical situations, where the patient’s life is in danger, data packets should be transmitted continuously and in real-time [Gama09].
2.2.2.4 BSN Physical Considerations and Radio Technologies
BSNs’ characteristics impose a series of challenges in the development of a suitable physical layer to support communications, thus, the following considerations must be taken:
• The level of transmission power for radio transceivers, as well as the reduction of the patients exposure to RF energy and the decrease of interference among adjacent BSNs;
• The BSN power consumption, which is highly related to the transmission power and the MAC protocol;
• The application data rate, radio-frequency modulation and wireless channel quality. • The influence of the human body on the RF communication channel, which may affect
the reliability of the communications and, consequently, the power consumption.
Human Body Interference on RF Communications
The path loss in a wireless channel is commonly represented through the empirical log-normal shadowing path loss model presented in equation 2.1, which is the received power in dB at a distance d. Pr(d0) is the path loss at the reference distance d0 in dB and Xσ,dB is a
zero-mean Gaussian random variable with standard deviation σ dB. For the wireless wave propagation, there is attenuation in transmission power at the rate dη, where η is the path loss
exponent, which is equal to two in free space and tends to be higher in indoor environments.
!! ! = !! !! + 10 ! !"#!"
!
!! + !!,!" (2.1)
Since most of the BSN sensors are attached to the human body, several studies have been made in order to evaluate the interference of the human body on wireless communications. These studies include the analysis of static and dynamic BSNs with communication between line of sight (LOS) and non-line of sight (NLOS) sensor devices.
In [Uddin11], for communications between LOS transmitter and receiver devices attached in different body segments (arms, legs, torso, backs), it was found that η is between
three and four, but for communications between two NLOS devices, one placed in the torso and the other in the human back, it was found a η ranging from five to six. For device dynamic BSNs, it was also concluded that the path loss increases up to 5 dB for LOS and around 15-20 dB for NLOS in relation to static BSNs.
Human Body Communications
Human body communications (HBC) is a prospective communication technology that explores the possibility of using the human body as a signal propagation medium. At the moment, there are two solutions for HBC: electromagnetic coupling and electric field coupling (also known as body capacitive coupling - BCC). In the electromagnetic coupling solution, the human body is treated as a waveguide where the RF signal propagates through the body. In the electric field coupling solution, devices are placed on or near the body and the data is transmitted across the devices by near electric fields.
BCC is appellative for BSNs because, in contrast with electromagnetic coupling, BCC transceivers generate weak but still detectable electric fields that only extends outwardly a couple of centimeters from the surface of the skin, allowing the transmission of small amounts of information and enabling communications without interfering with other adjacent BSNs [Falck07].
IEEE 802.15.4
The IEEE 802.15.4 is focused in the work presented in this document and is discussed with detail in section 2.3.2.
IEEE 802.15.6
The IEEE 802.15.6 is the standard protocol that is being developed to address the specific requirement for the BSNs. This standard aims to develop the medium access control and physical layers for BSN. It focuses on functioning at relatively low frequencies (below one megahertz), aims for sort-range use, low cost, reliable wireless communications and especially ultra-low power [Bradai11].
The current IEEE 802.15.6 standard defines three physical layers: narrowband, UWB, and HBC layers. The selection of each PHY layer depends on the application requirements. In narrowband, it may operate in different bands, including the 2.4 GHz ISM band at 971.4 kb/s. In UWB, data rates range approximately from 0.4 Mbit/s up to 12.6 Mbit/s. HBC uses capacitive coupling and data rates may scale up to 2 Mbit/s [Batra11].
2.2.2.5 BSN Communication Architectures
Three different communication architectures may be defined for a BSN: wired, wireless and hybrid [Chen11].
Wired architectures are used to avoid the challenges of wirelessly interconnecting sensor devices. Existing schemes, such as MITHril [Pentland04] and SMART [Curtis08], use wired links to connect the sensor devices directly to a personal server (PS), i.e., a PDA. The PS will then relay the information wirelessly to a BS. However, wired systems compromise patient quality of life because they may be obligated to wear special suits or to live with wires attached to the body.
In wireless architectures, sensor devices may transmit the information following two different approaches: sensor devices communicate directly with BSs without a PS (e.g., CodeBlue [Shnayder05]); or, alternatively, sensors may communicate to a PS that then relays the information to a BS (e.g., WiMoCa [Farella08]).
In [Chen11], a different architecture is also considered, in which the BSN is divided in two levels. At the first level, sensor devices communicate through wires (hybrid approach) or wirelessly (forming a cluster) to a central processor device, in order to reduce the amount of raw data through the data fusion and to ultimately save energy. At the second level, the PS will then relay the information wirelessly to a BS.
The Posture Monitoring System
The evaluation scenarios proposed in this work uses traffic parameters extracted from a real implementation of a multi-user motion capture application that is based on several wireless sensor devices, each one containing multiple inertial and magnetic sensors: the wireless Posture Monitoring System (PMS). When one of these sensor devices is attached to an object, its orientation in 3D space can be obtained. Likewise, when several modules are attached to different segments of a user’s body, the movements of the user can be tracked. The PMS is composed of three main components: the PC, the base station and multiple sensor devices that collect movement data, as represented in Figure 2.6. The PC is responsible to receive the data from sensors and compute the angles of the body segments being monitored, which are sent to a 3D model that displays the users’ movements. It also provides a user interface to enable the configurations of several parameters of the BSN. The base station acts as the network coordinator and the sensor devices are the responsible for collecting posture
data from the respective body segments [Silva11].
Base Station
RS232
Sensor Devices
Figure 2.6 – Posture Monitoring System overview.
Table 2.5 presents a summary of the parameters used by the PMS. Each sensor device includes a set of six sensors, which enables the application on the PC to process the data and obtain the position of the body segment that is being monitored. These sensors are constituted by three accelerometers and three magnetometers, each of which generates 12 bits per sample. The set of data collected from these six sensors generate 72 bits of information for each body segment, which corresponds to 9 bytes. Each data packet generated by a sensor device contains at least one sample of each sensor and it also includes 2 bytes with information of the status of the battery.
Table 2.5 – Posture Monitoring System parameters.
Parameter Designation Value
Number of sensors per device. Ns 6
Sensor accuracy. Qs 12 bit
Battery Accuracy. QB 12 bit
Sampling Rate. fs 30 Hz
For the movement captured by the monitoring system to be smooth, a sampling rate of 30 Hz was chosen, because many motion capture applications typically require a frame rate of 30 fps. Other applications may require even higher sampling rates in order to track faster movements.
![Table 2.3 - Characteristics of various energy sources available in the environment and the harvested power [Fiorini08]](https://thumb-eu.123doks.com/thumbv2/123dok_br/17778296.837785/43.892.193.741.243.433/table-characteristics-various-sources-available-environment-harvested-fiorini.webp)