www.scielo.br/rbg
EVALUATION OF PORE SYSTEM PROPERTIES OF COQUINAS
FROM MORRO DO CHAVES FORMATION BY MEANS OF X-RAY MICROTOMOGRAPHY
João Pedro T. Zielinski
1, Alexandre C. Vidal
2, Guilherme F. Chinelatto
2,
Leandro Coser
3and Celso Peres Fernandes
3ABSTRACT.The recent increase in the use of X-ray microtomography (µ-CT) for reservoir rock characterization can be explained by numerous factors, such as its
non-destructive nature, higher spatial resolution and 3D pore space visualization, which were explored in this work to evaluate the pore system of coquinas, a potential reservoir rock mainly composed of shells and their fragments. However, most of the recent studies have not considered an association between petrophysical parameters extracted viaµ-CT and coquina facies. For this reason, this work had the goal to characterize the pore types, quantify total porosity, obtain the porosity profile, analyze
the pore and pore-throat size distribution, as well as to extract additional petrophysical parameters of different taphofacies from Morro do Chaves Formation coquinas, Sergipe-Alagoas basin. The results haven shown that taphofacies from shallow sub-environment under normal conditions (group T2) and deeper sub-environment under storm influence (group T5) are better in terms of reservoir quality. Nevertheless, rocks from storm influence, deeper sub-environments are more likely to represent a good reservoir, since its pore system is predominantly dominated by moldic pores, which are originated during eogenetic phase, while rocks from shallow normal conditions have pores dominantly generated during telogenesis. Additionally,µ-CT derived data such as coordination number and pore and pore-throat sizes could
also be used to explain differences in absolute permeability in the studied rocks. Nevertheless, our data suggests that coquinas have a multiscale pore system and finer imaging scales are indispensable for more accurate petrophysical characterization.
Keywords: coquinas,µ-CT, petrophysics.
RESUMO.A crescente utilização da microtomografia de raios-X (µ-CT) visando a caracterização das rochas reservatório pode ser explicada por diversos fatores,
como sua natureza não-destrutiva, alta resolução espacial e visualização 3D do espaço poroso, que são propriedades exploradas nesse trabalho para avaliar o sistema poroso de coquinas, uma potencial rocha reservatório composta principalmente por conchas e seus respectivos fragmentos. Entretanto, a maioria dos estudos recentes não tem associado os parâmetros petrofísicos com as fácies de coquinas. Por essa razão, esse trabalho buscou realizar a caracterização dos tipos de poros, quantificar a porosidade total, obter o perfil de porosidade, analisar a distribuição do tamanho de poros e gargantas, assim como extrair parâmetros adicionais de diferentes tafofácies das coquinas da Fm. Morro do Chaves, Bacia de Sergipe-Alagoas. Os resultados mostraram que as tafofácies dos subambientes rasos sob condições normais de deposição (grupo T2) e dos subambientes profundos sob influência de tempestades (grupo T5) são melhores em termos de qualidade de reservatório. No entanto, as rochas de subambientes profundos sob influência de tempestades são mais prováveis de representarem bons reservatórios, pois seu sistema poroso é predominantemente dominado por poros móldicos, que são originados durante a fase eogenética, enquanto que as rochas depositadas no subambiente raso em condições normais possuem poros gerados durante a telogênese. Adicionalmente, dados derivados daµ-CT, como número de coordenação e tamanho de poros e
gargantas, também poderiam ser usados para explicar as diferenças em permeabilidade absoluta nas rochas estudadas. Entretanto, nossos dados sugerem que as coquinas possuem um sistema poroso multiescalar e o imageamento em escalas mais finas para uma caracterização petrofísica mais acurada é indispensável.
Palavras-chave: coquinas,µ-CT, petrofísica.
1Pontifícia Universidade Católica do Rio Grande do Sul (PUC-RS), Instituto do Petróleo e dos Recursos Naturais (IPR). Av. Ipiranga, 6681, Prédio 96J. 90619-900. Porto Alegre, RS, Brazil- E-mail: [email protected]
2Universidade Estadual de Campinas (UNICAMP), Departamento de Geologia e Recursos Naturais. Rua Carlos Gomes, 250, 13083-855 Campinas, SP, Brazil - E-mails: [email protected]; [email protected]
3Universidade Federal de Santa Catarina (UFSC), Programa de Pós-Graduação em Ciência e Engenharia de Materiais (PGMAT). Campus Universitário – Trindade. 88040-900. Florianópolis, SC, Brazil - E-mails: [email protected]; [email protected]
INTRODUCTION
The use of X-ray Microtomography (µ-CT) to characterize reservoir rocks has been constantly gaining attention over the last years (Arns et al., 2005; Silin & Patzek, 2006; Appoloni et al., 2007; Reis Neto et al., 2011; Andrä et al., 2013). This can be explained by the advantages of this technique, such as: 1st) it is a non-destructive imaging technique – despite the necessity to remove the sample from an outcrop or a core – so we can use the same scanned sample to reproduce an experimental study, image it at a better resolution, or repeat the analysis in case of undesirable effects; 2nd) this method can produce high quality images, which allows samples to be imaged at a higher spatial resolution (sometimes smaller than 1µm); and 3rd) with the µ-CT images we can build a 3D model of the scanned samples and quantitatively investigate the porous media in a three-dimensional way.
All these aforementioned qualities are especially useful when dealing with complex reservoir rocks (e.g. carbonate rocks), which are those whose petrophysical properties are completely heterogeneous and extremely difficult to be analyzed by conventional optical microscopy or experimental methods. Therefore, microtomographic images are extremely useful because they allow the spatial visualization of pores and quantification of key parameters (mainly porosity, pore and pore-thorat sizes and connectivity) used in characterization and simulation of fluid flow in carbonate reservoir rocks (Arns et al., 2005; Al-Kharusi, 2007; Mantovani, 2013; Bernabé & Maineult, 2015).
Nevertheless, most of the research usingµ-CT is usually restricted to the characterization of reservoir rocks, highlighting different methods and procedures applied to the quantification and classification of petrophysical parameters, as well as their limitations (Arns et al., 2005; Al-Kharusi, 2007; Cnudde & Boone, 2013; Machado et al., 2014; Schmitt et al., 2016), whereas some authors applied the characterization method to different rocks in order to quantify petrophysical properties or even to visualize features and relevant structures to complement the description of reservoir rocks (Appoloni et al., 2007; Reis Neto et al., 2011; Oliveira et al., 2012; Mantovani, 2013; Schmitt, 2014; Jia et al., 2014; Voorn et al., 2015). Additionally, very few studies have associated petrophysical properties extracted viaµ-CT with carbonate facies in a way that could make the integration of petrophysical and geologic information possible.
For these reasons, we have investigated the use ofµ-CT images to characterize the pore types, to quantify total porosity, to
obtain the porosity profile, pore and pore-throat size distribution, together with the coordination number and average pore and pore-throat size of different taphofacies of coquinas from Morro do Chaves Formation, Sergipe-Alagoas basin, northeastern Brazil. These taphofacies have been recently defined by Tavares et al. (2015) and Chinelatto et al. (2018) using taphonomic, compositional and stratigraphic criteria, which are parameters that influence the distribution of petrophysical-related elements (fragmentation degree and spatial orientation of shells, matrix type and content, etc.).
BRIEF GEOLOGICAL CONTEXT
The Sergipe-Alagoas basin, one of the Brazilian Eastern Margin basins, is located in the northeastern part of the country and has both onshore and offshore segments. Covering an area of approximately 35,000 km2 (Lana, 1990), it is limited to the north by the Maragogi High, which marks its division with the Pernambuco-Paraíba basin, and to the southwest by the Jacuípe basin, where the fault system of Guarajuba or Itapuã could mark its limit as suggested by Souza-Lima et al. (2002), even though this assumption is not entirely accepted (Campos Neto et al., 2007).
In plan view the basin has an elongated form oriented N45E, characterizing an asymmetric half-graben, and strata dipping northwestwards. This tectonic setting is associated with the Gondwana rifting process, which started in the Early Cretaceous (Campos Neto et al., 2007). The stratigraphic framework is divided in five intervals representing different phases of the tectono-stratigraphic evolution. The first one is a remnant of the Paleozoic sedimentation, considered to be the record of the sag stage (Permian-Carboniferous), which is then followed by pre-rift (Jurassic-Early Cretaceous), rift (Early Cretaceous), post-rift (Early Cretaceous, Upper Alagoas local stage) and drift rocks (Meso-Cenozoic) related to the continental break-up (Cainelli & Mohriak, 1998; Campos Neto et al., 2007). The coquinas of the Morro do Chaves Formation were deposited in a shallow lacustrine, high energy paleoenvironment (Azambuja Filho et al., 1998; Muniz, 2013) of the rift phase (Figueiredo, 1981), and it is composed mainly of mollusc shells (bivalves and gastropods), ostracods and few others bioclasts (Schaller, 1969; Figueiredo, 1981; Kinoshita, 2010; Thompson et al., 2015; Tavares et al., 2015). The depositional cyclicity is well observed in the stratigraphic record and demonstrates that the coquinas are interbedded with organic-rich, fossil-bearing shales, thought to have been deposited in the center of the lake (Figueiredo, 1981).
Siliciclastic rock fragments and minerals are also present, even as a matrix component.
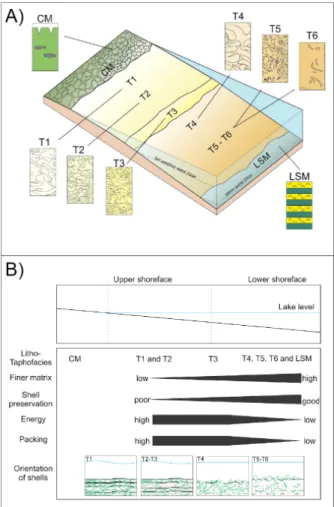
Figure 1 – A) Taphofacies model showing the two broad sub-environments
(shallower and deeper, from upper to lower shoreface) and distribution of coquina taphofacies (T1 to T6). B) Key characteristic features used to classify coquinas based on presence of fine particles in the matrix, shell preservation, water energy, packing and shell orientation. Adapted from Chinelatto et al. (2018).
Despite being apparently simple, these rocks have a variety of facies which are attributed to its depositional environment and advanced diagenetic stage. Recent models and flume experiments (Tavares et al., 2015; Chinelatto et al., 2018) suggest that these rocks were deposited under the influence of storms events that results in different textural patterns associated with the facies distribution in a carbonate ramp. These rocks can be classified according to taphonomic, compositional and stratigraphic criteria. As reported by Tavares et al. (2015) and Chinelatto et al. (2018) coquinas can be broadly divided in two sub-environments (Fig. 1): 1st) those deposited in shallower
conditions, under the influence of constant reworking by normal waves/currents. As a result, these rocks have fragmented and disarticulated bioclasts, and its matrix is basically composed of fragmented shells. Additionally, in this sub-environment they can also be sporadically affected by storm-influenced waves; and 2nd) those deposited in deeper portions, only reworked during storm events and, for this reason, are moderately fragmented. Besides, clay matrix is abundant and it is possible to observe articulated valves.
In shallower conditions, taphofacies T1 to T3 occur and they are described as grainstones and rudstones deposited under high-energy environment. Their valves are oriented parallel to the bedding with a high packing, absent of finer matrix and poorly shell preservation where T1 is more shallow than T2 and T3. The deeper deposits are represented by taphofacies T4 to T6. Taphofacies T4 is interpreted as grainstones and rudstones storm winnowing deposits without oriented valves. Their shells are moderately preserved and densely packed, whereas T5 and T6 represent most distal packstones and wackestones storm deposits with more preserved and loosely packed shells with random orientation (Chinelatto et al., 2018). The geologic record reveals that the stratigraphic distribution is cyclic, related to shallowing and deepening-upward sequences (Kinoshita, 2010; Chinelatto et al., 2018). According to Tavares et al. (2015), there are a number of diagenetic stages that led to dissolution, neomorphism, cementation and physical and chemical compaction of the coquinas, which will not be further analyzed in this paper. For further reference regarding the taphofacies model and other characteristic features of the coquina samples studied in this work see Chinelatto et al. (2018).
MATERIALS AND METHODS Samples
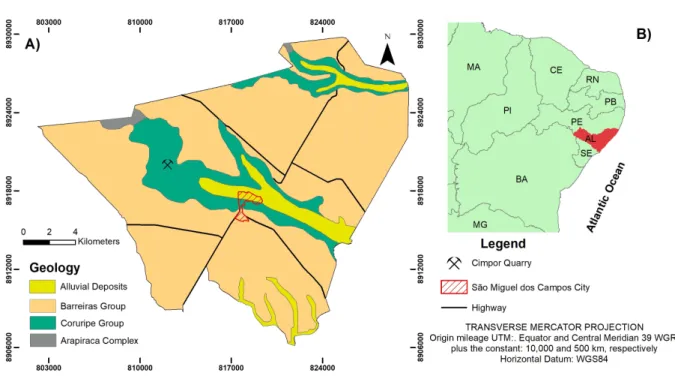
Six coquina samples from Morro do Chaves were selected in order to represent some of the main facies occurring in the CIMPOR quarry outcrop, which is situated in São Miguel dos Campos, Alagoas, Brazil (Fig. 2). These samples were collected during fieldwork activities and used in thin-section preparation. A 1-inch plug from each rock sample was extracted to implement petrophysical experiments (porosity and permeability) and to acquireµ-CT images.
The investigated coquinas are a good example of extremely heterogeneous reservoir rocks, mainly due to its depositional characteristics and diagenetic history (Figueiredo, 1981; Kinoshita, 2010; Thompson et al., 2015), being considered
Figure 2 – A) Simplified geological map showing the location of the samples collection site at the CIMPOR quarry, near São Miguel dos Campos, Alagoas state. B)
Regional map of northeastern Brazil highlighting the Alagoas state and its position near the Atlantic Ocean. Adapted from Chinelatto et al. (2018).
geological analogues to many oil-producing reservoirs in the South Atlantic margins.
Samples Coq 8 and Coq 9 (taphofacies T2 to T3) are interpreted as being deposited in shallow conditions, under storm-influenced and normal circumstances, respectively. Samples Coq 18 (taphofacies T4) and Coq 7, Coq 10B and A-16 (taphofacies T5), on the other hand, are representative of the storm-influenced deeper coquinas, deposited during high-energy events in deeper portions of the lake. Samples from groups T2 and T3 were deposited under the influence of a high-energy environment, being constantly reworked by normal and storm-influenced waves and currents. Therefore, these rocks are composed of disarticulated and fragmented bioclasts (mainly bivalve molluscs) with preferred concave-down oriented valves and their matrix is basically formed by small fragments of broken shells. The micrite or clay mineral content gradually increases from groups T2 and T3, as the rocks from group T3 were deposited in deeper portions. Samples from groups T4 and T5 had occasionally experimented the influence of storm events and, due to this condition, their bioclasts are generally less fragmented and displays a chaotic distribution of shells and their fragments. In T4 the coquinas show a dense accumulation of valves and the
matrix is composed of shell fragments whereas T5 shows micrite or clay mineral in the matrix.
µ-CT and image data
MicroCT images were acquired using a ZEISS XRadia Versa XRM-500 scanner at the Laboratory of Porous Media and Thermophysical Properties (LMPT), Universidade Federal de Santa Catarina. The 5-cm long, 1-inch core plugs used in this study yielded a set of more than 2,000 two-dimensional slices with 1004x1024 pixels. However, the Volume of Interest (VOI), which is the region where all the measurements were taken, was reduced to a rectangular cube with 500x500x1600 voxels, in which pre-processing filters were applied before segmenting and quantifying all petrophysical parameters.
Image resolution of this 1-inch plugs were: 28.3µm (Coq 18), 28µm (Coq 9, Coq 7, Coq 8 and Coq 10B) and 27.8µm (A-16). Moreover, all rock samples were vertically positioned inside the equipment and, for this reason, the Z-axis of each plug corresponds to an orthogonal direction to all generated slices. Axis X and Y are parallel to the basal plane of the samples, thus planes XZ and YZ symbolize 2D planes virtually cutting the samples along the length of the sample.
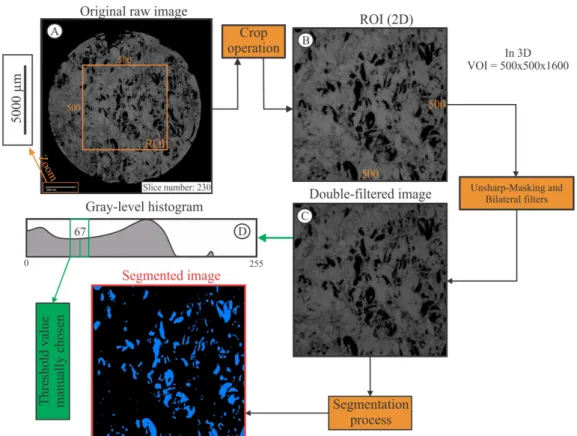
Figure 3 – Steps followed to segment theµ-CT images used in this work: (A) Region of Interest (ROI, in 2D) extraction from the raw
gray-level image; (B) ROI after the crop operation evidencing the region (500x500x1600, in 3D) where filters were applied; (C) Double-filtered image (Unsharp-Masking + Bilateral) in which segmentation was processed; and (D) Gray-level histogram showing the distribution of gray levels and the resulting segmented image.
Image processing and segmentation
Before extracting any quantitative information from the µ-CT images, it was necessary to apply two filters. The first one, named Unsharp-Masking, has the capacity to enhance the contrast between the pores and the mineral phase (shells, matrix and cement), enabling the delineation of the actual pore shape and the recognition of the small pores. The second one, called Bilateral filter, was applied to the resulting image with the objective of smoothing the image, reducing any effects possibly generated by the pixilation of some features during the application of the first filter.
To segment the image into two different phases (pores and non-pores), a gray-level histogram was used. Even though other methods have been tested, this one proved to be more faithful to the original raw image, producing an accurate binarization, despite the fact that some very small pores were left behind. Figure 3 shows the steps used in this study to obtain a segmented µ-CT image.
Pore characterization and petrophysical quantification
Thin-section andµ-CT images were used to define the pore types and to classify the pore system in two different approaches. To characterize the pore types we adopted the genetic classification of Choquette & Pray (1970) because of the possibility of a direct association between the pore shape and the rock framework using both images. The description of pore types is summarized in Table 1. Furthermore, we also used Lucia (1983, 1995) pore system classification, which, by integrating pore types and petrophysical data, considered only three types of porosity: i) interparticle; ii) touching-vug; and iii) separate-vug.
Porosity (φµ-CT) was measured on the basis of the numbers of pixels attributed to the porous and non-porous (mineral) phase. For this, only the phases inside the VOI (500x500x1600) were considered and the external areas discarded. To compute the pore and pore-throat size distribution, a Maximal Ball Algorithm (MBA) was applied. This code, initially developed by Silin & Patzek (2006) and later enhanced by Al-Kharusi (2007) and Dong
(2008), conceives a topological network that is equivalent to the real pore network. This is done by hierarchying the maximal spheres fitted to pores of the rock, which results in a separation of pores and pore-throats. The inscribed maximal spheres have the same volume as the real pores and, to quantify the size of the pore and pore-throat, the radius of the equivalent sphere is used. For more details about how the algorithm works and its validation, see Cunha (2012) and Silva (2012).
To evaluate the connectivity of the pore system elements, coordination number (CN) was the parameter chosen to assess the local communication between pores and pore-throats (Ahr, 2011), while the pore/pore-throat ratio was the adopted index to analyze the differences concerning the dimension of pores and pore-throats. In this study, both parameters were assessed according to their average. Thus, the CN represents the average number of pore-throats that connect to a single pore, while the pore/pore-throat ratio is calculated by dividing the average pore size to the average pore-throat size in all samples.
Porosity and permeability experimental analysis
The analysis were carried out at the Laboratory of Miscible Methods of Recovery (LMMR), CEPETRO/UNICAMP. To measure the porosity, an UltraPoreTM 300, which applies helium or nitrogen as the fluid phase, was used. For permeability, an UltraPermTM500 using nitrogen as the fluid phase was applied. Since these two techniques are well-known routine methods in the oil and gas industry, and are considered excellent to acquire absolute values, we decided to use the data produced by these two equipments to compare with those extracted viaµ-CT images.
It is important to note that the fluids displaced by these two methods during the analysis only penetrates the connected pores, excluding the isolated ones. Besides, the fluids used in this experiment have the ability to be injected into smaller pores by means of the pressure that is applied, meaning that both measured porosity and permeability are normally higher than those calculated by image analysis techniques. This limitation is mainly related to the spatial resolution of µ-CT images (∼ 28µm).
RESULTS AND DISCUSSION Pore types
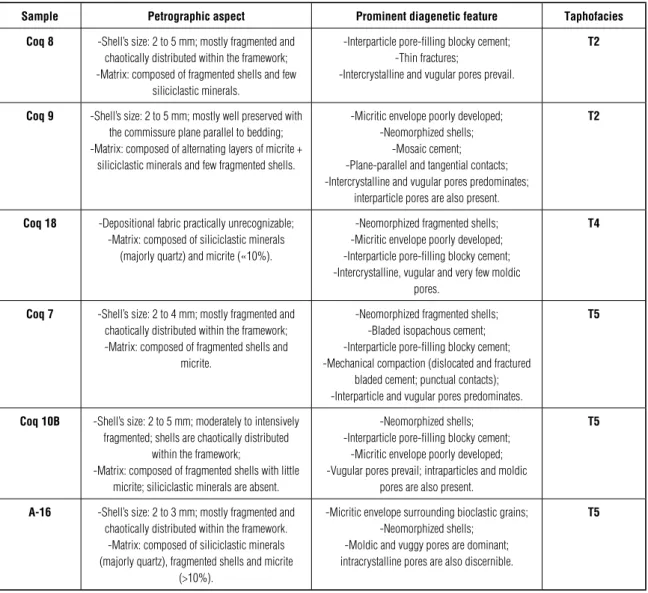
Table 1 shows the main petrographic aspects and most prominent diagenetic features of the samples used in this study together with its taphofacies classification. Pore types described in these rocks are in accordance with the nomenclature proposed by Choquette
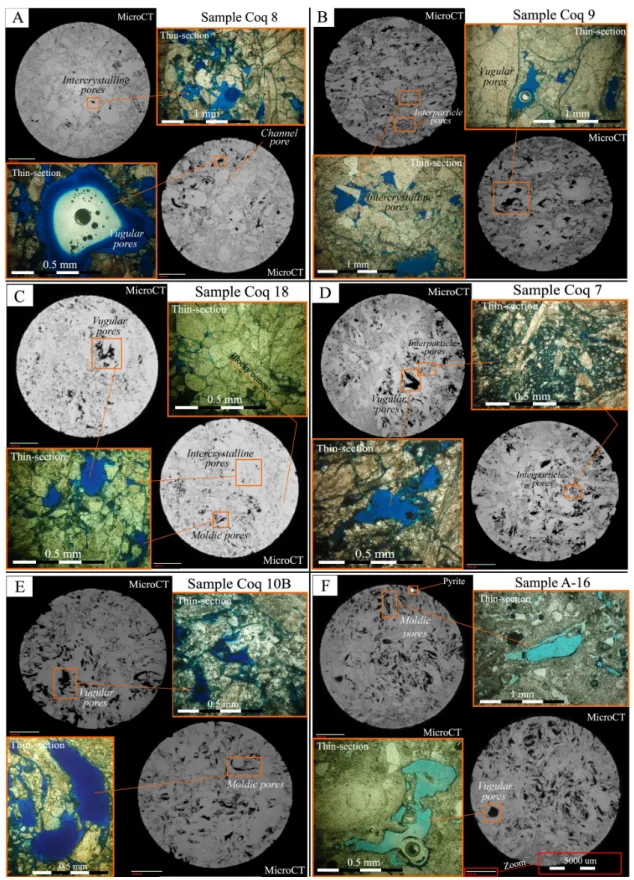
& Pray (1970). As can be seen in Figure 4A, sample Coq 8 represents an advanced stage of cementation, confirmed during the analysis of the thin-section, in which the pore-filling blocky calcite cement was observed.µ-CT image of this sample also confirms this fact, considering the occurrence of a uniform bright gray tone, indicating the presence of crystalline calcite. Thus, intercrystalline and vugular pores are more frequent. In theµ-CT images, it is also possible to note the appearance of channel pores, very likely to be related to chemical dissolution during compaction.
In Coq 9 (Fig. 4B), although vugular and intercrystalline pores are also predominant, interparticle pores, which are less frequent, contribute to the increase of porosity. Furthermore, it is also possible to observe in the dark-gray portions of theµ-CT images that there are small pores that, although not adequately defined in this resolution, are likely related to micropores and, for this reason, also contribute to the increase of total porosity. These micropores are believed to be associated with the deposition (or precipitation) of micrite/siliciclastic clay minerals.
Sample Coq 18 is mainly dominated by vugular and intercrystalline pores, while moldic pores are rare. Due to its intense and pervasive cementation degree, predominantly caused by the introduction of the pore-filling blocky calcite cement, many pores were obliterated. The larger pores are represented by dissolution features, such as vugs. The fragmentation degree of the shells, which is quite high, may have facilitated the generation of the cement, as well as its percolation throughout the rock framework (Fig. 4C).
Samples Coq 7 and Coq 10B, despite being representative of the same taphofacies (T5), exhibit distinct pore types. In sample Coq 7, interparticle and vugular pores dominates (Fig. 4D). Due to the fragmentation degree of the shells, which are intensively broken, along with the blocky calcite cement and isopach bladed cement, the interparticle pore is partially preserved. This situation does not occur in sample Coq 10B, where vugular pores prevail, but moldic pores are also common. Analyzing Figure 4E, it is possible to observe that despite the predominantly uniform gray tone in µ-CT images, there are some dark-gray portions between the shells and their fragments, suggesting the presence of micrite or siliciclastic clay minerals, uncommon in the other rocks representative of this same taphofacies. Intraparticle pores also occur, but are rare and sparsely distributed. Finally, A-16 is majorly composed of moldic pores and sparse vugular pores. The variety of gray tones in theµ-CT images suggests the occurrence of micrite or siliciclastic clay minerals (dark-gray portions), shells
Table 1 – Main petrographic aspects, most prominent diagenetic features and taphofacies groups.
Sample Petrographic aspect Prominent diagenetic feature Taphofacies Coq 8 -Shell’s size: 2 to 5 mm; mostly fragmented and
chaotically distributed within the framework; -Matrix: composed of fragmented shells and few
siliciclastic minerals.
-Interparticle pore-filling blocky cement; -Thin fractures;
-Intercrystalline and vugular pores prevail.
T2
Coq 9 -Shell’s size: 2 to 5 mm; mostly well preserved with the commissure plane parallel to bedding; -Matrix: composed of alternating layers of micrite +
siliciclastic minerals and few fragmented shells.
-Micritic envelope poorly developed; -Neomorphized shells;
-Mosaic cement; -Plane-parallel and tangential contacts; -Intercrystalline and vugular pores predominates;
interparticle pores are also present.
T2
Coq 18 -Depositional fabric practically unrecognizable; -Matrix: composed of siliciclastic minerals
(majorly quartz) and micrite («10%).
-Neomorphized fragmented shells; -Micritic envelope poorly developed; -Interparticle pore-filling blocky cement; -Intercrystalline, vugular and very few moldic
pores.
T4
Coq 7 -Shell’s size: 2 to 4 mm; mostly fragmented and chaotically distributed within the framework; -Matrix: composed of fragmented shells and
micrite.
-Neomorphized fragmented shells; -Bladed isopachous cement; -Interparticle pore-filling blocky cement; -Mechanical compaction (dislocated and fractured
bladed cement; punctual contacts); -Interparticle and vugular pores predominates.
T5
Coq 10B -Shell’s size: 2 to 5 mm; moderately to intensively fragmented; shells are chaotically distributed
within the framework;
-Matrix: composed of fragmented shells with little micrite; siliciclastic minerals are absent.
-Neomorphized shells; -Interparticle pore-filling blocky cement;
-Micritic envelope poorly developed; -Vugular pores prevail; intraparticles and moldic
pores are also present.
T5
A-16 -Shell’s size: 2 to 3 mm; mostly fragmented and chaotically distributed within the framework.
-Matrix: composed of siliciclastic minerals (majorly quartz), fragmented shells and micrite
(>10%).
-Micritic envelope surrounding bioclastic grains; -Neomorphized shells;
-Moldic and vuggy pores are dominant; intracrystalline pores are also discernible.
T5
formed by calcite (pale gray regions), confirmed by thin-section analysis, and some pyrite mineral (bright spots), according to Figure 4F.
Regardless of the limitations imposed by the spatial resolution of the µ-CT images, it was possible to define if the pore network is dominated by interparticle, separate-vug or touching-vug porosity, following the Lucia (1983, 1995) classification. Since there was no coquina with interparticle porosity, this classification was not utilized. Therefore, by visual inspection of thin sections and µ-CT images, as well as by their quantitative information, the pore space of these rocks is classified as separate-vug, once the vugs present in the samples do not form an interconnected framework. This means that, to define a connected network, the larger pores (moldic and vugular
pores) depend on the smaller pores (interparticle, intercrystalline, microporosity present in the micrite or clay minerals, etc.).
Additionally, it is important to mention that, since most pore types of carbonate rocks are diagenetic and, more importantly, generated in different diagenetic stages, like the vugular ones, thought to have its origin during telogenesis, according to Tavares (2014), the assumption that the pore types of Morro do Chaves coquinas (nowadays exposed to atmospheric conditions) should be the same as those in the rocks currently buried is erroneous. However, all other pore types (expect the vugular pores) of the coquinas of this study are generated during the eogenetic and mesogenetic stages (Tavares, 2014). Besides, as shown in Figure 4, shallow coquinas (group T2 – Coq 8 and Coq 9) have a larger concentration of primary and vugular pores when compared with
Figure 4 – Pore types observed in thin sections andµ-CT images, following the Choquette & Pray (1970) nomenclature: (A) Coq 8 (facies T2); (B) Coq
deeper coquinas (groups T4 and T5 – Coq 18 to A-16), where samples tend to exhibit more moldic pores.
Experimental petrophysical data
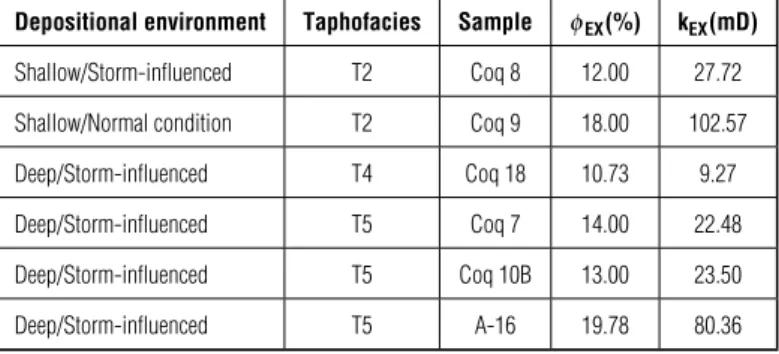
As demonstrated in Table 2, which shows the porosity and permeability values obtained experimentally, the porosity (φEX) varies from 10.73% to 19.78%, while permeability (kEX) fluctuates between 9.27 mD and 102.57 mD, demonstrating the heterogeneous characteristic of these parameters, even amongst the same taphofacies group.
According to Tiab & Donaldson (2015), the porosity of these coquinas can be defined, in terms of reservoir quality, as fair (10-15%) to good (15-20%), and permeability, in milidarcys, as fair (1<k<10), moderate (10<k<50) to good (50<k<250).
Segmented porosity and porosity profile
Porosity and its variations along the slices have been computed to all samples, as can be seen in Table 3, which depicts the minimum, maximum and total porosity considering all 1600 slices of each rock sample.
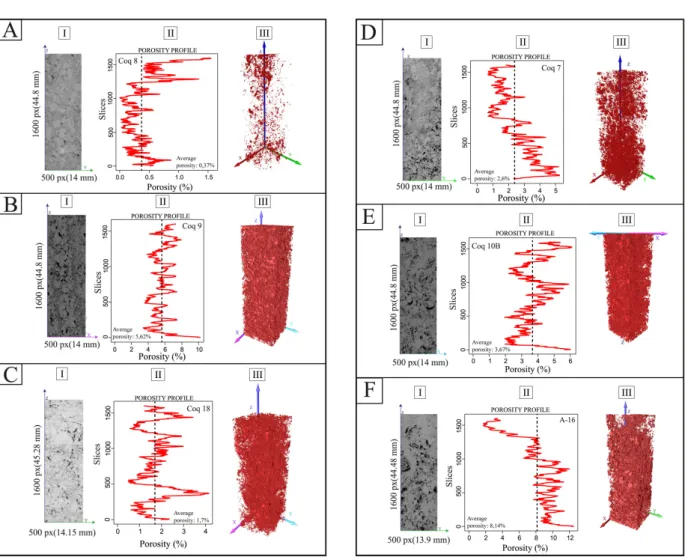
Samples representative of the shallow environment have very different porosities. Sample Coq 8 is the most cemented of all, as can be seen in Figure 5A. Total porosity is 0.37% and, despite varying from zero to 1.55%, as demonstrated by the graph (Fig. 5A-II), the image on the left side and the pore network on the right side of Figure 5A illustrates that cementation is pervasive and significantly affects the pore system of the rock. Another sample, illustrating the shallow portion of the facies model, has a different pattern. Sample Coq 9 presents a thin lamination, which in Figure 5B-I is shown to be parallel to the Z axis of the sample, coinciding with the stratigraphic plane. In general, the slice-by-slice porosity oscillates near the average that is 5.62%, showing a minimum of 3.4% and a maximum of 10.17%. Figure 5B-II illustrates the porosity profile following a lateral variation, if we consider the stratigraphic orientation.
Regarding the samples typical of a deeper, storm-influenced environment (T4 and T5), porosities were expected to yield a much lower value but showed and erratic behavior. Sample Coq 18 has a very low total porosity (1.7%), probably because the cementation degree resulted from the fragmentation of the shells, favoring dissolution reaction and consequent cement percolation. In Figure 5C-I, it is possible to note the widespread brighter gray tone, indicating the cement phase/neomophized shells, which is a characteristic that repeats throughout the sample, as can be noted in the graph shown in Figure 5C-II. At the base of
the sample, porosity is approximately near the average but it increases towards the top, following a pattern that shows cyclic increments, which can be explained by a varied cementation degree.
As sample Coq 7 illustrates, the total porosity is 2.6% – even though the porosity at the base of the sample reaches its highest value (5.47%) – gradually decreasing towards the top of the sample, which is oriented according to its real stratigraphic position. This pattern is not only evident in Figure 5D-I, but also in the pore network image (Fig. 5D-III). Sample Coq 10B has a total porosity of 3.67% and shows a variation that is similar to sample Coq 18, depicting cyclic porosity increases along the Z-axis, possibly associated with the discrepancy of the cementation degree. Despite varying from 1.95 to 6.10%, and being majorly composed by vugular pores, its pore network is relatively dense and spatially well distributed (Fig. 5E-III).
Finally, sample A-16 is the one that not only has the highest total porosity (8.14%), but also represents the major variation in the slice-by-slice porosity (from 1.72 to 12.48%). Figure 5F-II shows that the porosity is high at base and center of the sample, significantly decreasing until it reaches its minimum, already at the top of the sample, following a stratigraphic orientation. This pattern results from the number of moldic pores, as can be seen in the microtomographic image (Fig. 5F-I) and the pore network (Fig. 5F-III).
In comparison with the data obtained by experimental methods (Tab. 3), the porosity extracted viaµ-CT is expressively different. On average, the porosity values calculated by porosimetry are 10.9% higher than those found by using microtomographic images. Besides, in theµ-CT images of this resolution, it was not possible to simulate permeability, which according to the experimental test varies from 9.27 to 102.57 mD.
These data corroborates with the fact that the resolution of µ-CT images is not sufficient to contemplate all pores present in the coquinas, which makes their petrophysical characterization difficult. However, since it is almost impossible to know a priori if a certain pore system of a rock is multiscale, the experimental values are good to compare the results. Besides, by integrating petrophysical data derived from experiments to petrophysical data obtained viaµ-CT images, it is possible to prove that the pore system of these coquinas can be classified, according to Lucia (1983, 1995) and considering only this single-resolution (∼ 28 µm), as separate-vug. This explanation is supported by the fact the vugular pores do not form an interconnected pore network that
Table 2 – Experimental petrohysical values for porosity and permeability. Depositional environment Taphofacies Sample φEX(%) kEX(mD)
Shallow/Storm-influenced T2 Coq 8 12.00 27.72 Shallow/Normal condition T2 Coq 9 18.00 102.57 Deep/Storm-influenced T4 Coq 18 10.73 9.27 Deep/Storm-influenced T5 Coq 7 14.00 22.48 Deep/Storm-influenced T5 Coq 10B 13.00 23.50 Deep/Storm-influenced T5 A-16 19.78 80.36
Table 3 – Minimum, maximum and total porosity of each sample. These data were calculated based on the amount of pixels of each phase
(porous and mineral) of all slices, that is, the whole VOI.
Depositional environment Taphofacies Sample Min. porosity (%) Max. porosity (%) Total porosity (%)
Shallow/Storm-influenced T2 Coq 8 0.00 1.55 0.37
Shallow/Normal condition T2 Coq 9 3.40 10.17 5.62
Deep/Storm-influenced T4 Coq 18 0.49 4.15 1.70
Deep/Storm-influenced T5 Coq 7 0.89 5.47 2.60
Deep/Storm-influenced T5 Coq 10B 1.95 6.10 3.67
Deep/Storm-influenced T5 A-16 1.72 12.48 8.14
allow permeability to exist. Thus, the permeability connecting the vugs comes from the microporosity.
Pore size and pore-throat size distribution
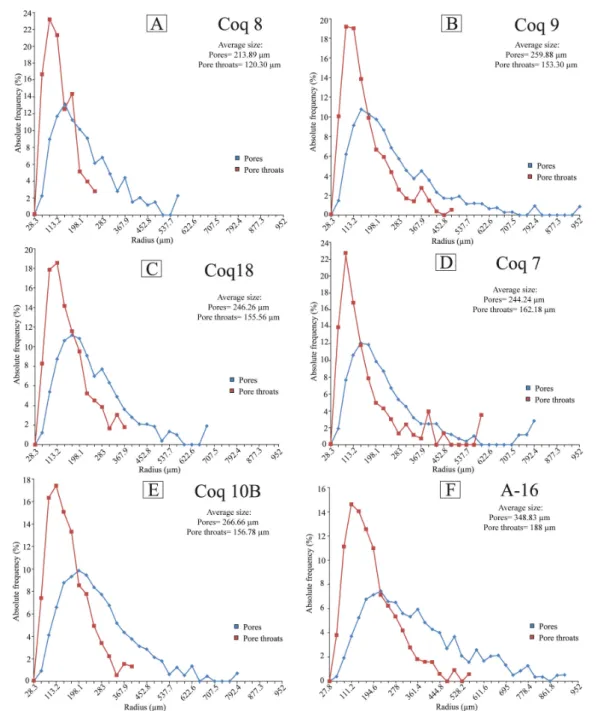
Through the hierarquization of the elements of the pore system according to the MBA algorithm, it was possible to analyze the pore and pore-throat size distribution of the samples of this study. The interval of pore sizes for sample Coq 8 varies from 28 to 560 µm however its pore-throat size distribution is narrower, varying from 28 to 252µm. Indeed, as Figure 6A shows, approximately one fourth of the pore-throats are 84 µm in size. The range of pore distribution is greater for sample Coq 9 (28 to 952µm) and its pore-throats are also larger, varying from 28 to 476µm (Fig. 6B). For Coq 18, pore sizes vary from 28.3 to 679.2µm and pore-throats from 28.3 to 367.9µm (Fig. 6C).
The range of pore sizes for sample Coq 7 and Coq 10B are very similar, from 28 to 784µm, but their pore-throat sizes are not. Pore-throats for Coq 7, for example, are from 28 to 588µm in size, which is greater than those representatives of groups T2 and T4 (Fig. 6D). As for Coq 10B (Fig. 6E), pore-throats vary from 38 to 392 µm. Sample A-16, similarly to sample Coq 9,
has a wide range of pore size distribution, with pores varying from 27.8 to 917.4µm. Pore-throats are equally large, between 27.8 to 556µm (Fig. 6F). Comparing these data withµ-CT and thin-section images, it is possible to observe that the cementation deeply affects the pore and pore-throat size distributions, since samples Coq 8, Coq 7 and Coq 18 have the narrowest pore and pore-throat size ranges, showing the significance of the diagenetic effect on porosity obliteration. Samples Coq 18 and Coq 7, even though representatives of a similar environment, have very different pore and pore-throat size distribution. This example demonstrates that diagenesis acted in two different ways, since it has partially obliterated the porous space of sample Coq 18, but helped enlarge the pores of sample Coq 7.
Finally, sample A-16 yields an unexpected pattern because, even though representative of a deeper environment, where small pore sizes are more common, it has large pores and pore-throats. This fact is explained due to the diagenetic processes responsible for the formation of vugs and moldic pores, associated with the dissolution of relatively big shells. The formation of moldic pores is related to the dissolution of aragonite during neomorphism, as appointed by Tavares (2014).
Figure 5 – Representation of the porosity variation slice by slice: (I) Raw (not segmented) image showing pores (in black) and mineral phase (in gray); (II) Porosity
profile exhibiting the oscillation of the porosity, slice by slice, referent to the sample’s average porosity (black dotted line); (III) Pore network of the porous space in 3D, where pores are drawn in red and the mineral phase is the void space. Samples are shown as follows: (A) Coq 8; (B) Coq 9; (C) Coq 18; (D) Coq 7; (E) Coq 10B; and (F) A-16.
Coordination number and average pore and pore-throat size
The definition of the coordination number (CN) is especially important to understand which facies has the best chance to allow fluid displacement, since the higher the coordination number the greater the number of pore-throats connecting a single pore, facilitating the connectivity of the pore system (Fauzi et al., 2002; Vasilyev et al., 2012; Bernabé & Maineult, 2015; Bernabé et al., 2016). The average pore and pore-throat size, on the other hand, helps to understand the mean size discrepancy between pores and pore-throats. In this works we only used it is a quali-quantitative index to analyze the absolute permeability behavior, whose ability to transport fluids depend basically on effective porosity, pore-throat size and connectivity. The last two
parameters are represented here as the average pore-throat size and the CN, respectively. Effective porosity could not be computed using image analysis since in the resolution used in this study it was not found, although it was measured using experimental techniques. One of the resulting consequences of tight (small) pore-throats, for example, is the chance to occur a snap-off effect (Pak et al., 2015), reducing the recovery efficiency of the fluid stored in the reservoir. This demonstrates the additional importance of quantifying pore and pore-throats sizes apart from the evaluation of absolute permeability, as presented above.
As can be observed in Figure 7A, Coq 8 has the lowest CN (1.13) with 70% of the pores having between 0 to 1 connection and the lowest CN range, that is, from 0 to only 11. Sample Coq 9 has the highest CN, which is equivalent to 3.74, showing that
Figure 6 – Graphs showing the pore and pore-throat size distribution, calculated by the MBA algorithm, of the studied samples: (A) Coq 8;
(B) Coq 9; (C) Coq 18; (D) Coq 7; (E) Coq 10B; and (F) A-16.
the connectivity of the pores is relatively good, even if its pore system is predominantly formed by vugular and intercrystalline pores (Fig. 7B). Moreover, the range of CN variation is high (between 0 to 26) and 80% of it is concentrated between 2 to 7, which is a good indicative of its excellent pore system communication. Considering Coq 18 (Fig. 7C), the average CN of is 1.88, nevertheless its total range varies from 0 to 17. Since the
cementation was intense and intercrystalline and vugular pores without connection dominates, approximately half of the CN fall between zero and one.
Samples Coq 7 and Coq 10B have a similar pattern regarding CN. As can be seen in Figure 7D and 7E, the range of CN of all samples is mostly between 0 to 16, not to mention that these samples exhibited a high percentage (>50%) of
CN between 0 to 1. For example, for sample at Coq 10B the percentage of CN between 0 to 1 corresponds to approximately 60% of the pore to pore-throat connections. For this reason, this pattern has a negative influence on the average CN (Coq 7 = 1.63 and Coq 10B = 1.45, the second lowest regarding all samples).
On the other hand, sample A-16 is quite similar to sample Coq 9, which can be noted in CN graphs. Figure 7F shows that the range of coordination numbers for sample A-16 is from 0 to 20 and that 70% of CN fall between 2 to 7, which contributes to an average CN of 2.59, even though the moldic pores, supposedly not connected, represent the majority of the porous space.
Generally speaking, the diagenetic and taphonomic (depositional) aspects affected the coordination number in different ways. Diagenesis, when it comes to storm-influenced coquinas from group T5 (samples Coq 7 and Coq 10B), was responsible for reducing the number of connections between pores and pore-throats, the deposition of the shells interbedded with levels of micrite or clay minerals generated horizons that, associated with the dissolution and formation of vugs (as seen in sample Coq 9), allowed CN to be higher. Alternatively, both deposition and diagenesis can affect the communication of pores and pore-throats positively, as observed in A-16. The random distribution of moldic pores, which correspond to originally deposited aragonitic shells that dissolved during diagenesis, suggests that both process have acted to increase CN.
Although the literature reports few results, analysis of some studies already published (Jiang et al., 2013; Archilha et al., 2016; Mostaghimi et al., 2016; Pak et al., 2016) have revealed that the average coordination number found in this work is in consistency with carbonate rocks (1.7 to 3.44). Nevertheless, these numbers should only be considered as a reference, since the carbonate rocks analyzed in the referred studies are different than the ones studied on this paper, not to mention the difference in imaged resolution. These values are also in the same order of magnitude considering experimental permeability values, that is, between 10 to 100 mD (Pak et al., 2015).
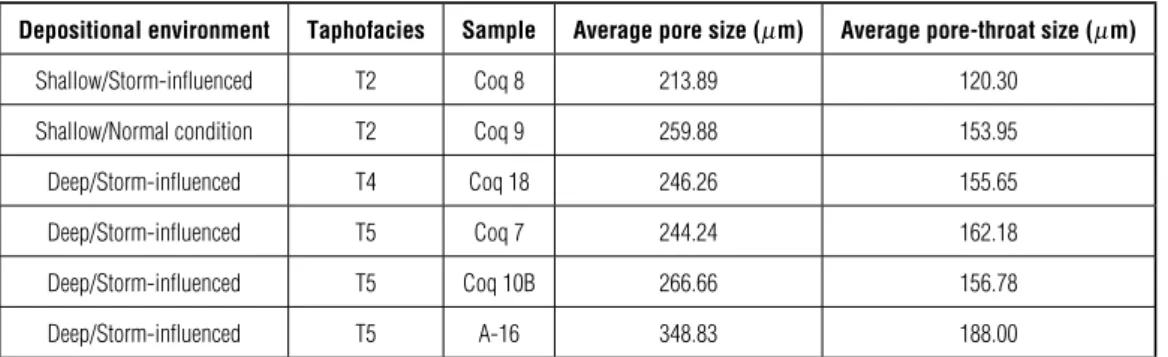
Considering the average pore and pore-throat size (Tab. 4) it is possible to observe that, in general, the average pore size of all samples is, at minimum, approximately 50% higher than the average pore-throat size. Analyzing these results and comparing them with porosity, CN and experimental petrophysical data, we can see that samples Coq 9 and A-16 (groups T2 and T5, respectively), showed different characteristics, despite having the highest image porosity. Sample A-16 exhibited the highest average pore (348.83µm) and pore-throat size (188µm), which
is in accordance with its other petrophysical parameters. However, sample Coq 9 presented the second lowest average pore-throat size (153.95 µm), but an intermediate pore size (259.88 µm), which do not correspond with its petrophysical behavior considering all other aforementioned variables, specially its experimental petrophysical data and CN.
Sample Coq 8, on the other hand, has the lowest value for average pore (213.89 µm) and pore-throat size (120.30 µm), consistent with its total image porosity and CN, but its experimental petrophysical data showed better results (φEX=12% and kEX=27.72 mD), when comparing with Coq 18 (the lowest experimental petrophysical data), for example. Analyzing sample Coq 18 (avg. pore size = 246.26µm; avg. pore-throat size = 155.65µm), it is possible to note that it has a relatively high correspondence with the average pore and pore-throat size of both Coq 7 (avg. pore size = 244.24µm; avg. pore-throat size = 162.18 µm) and 10 B (avg. pore size = 266.66µm; avg. pore-throat size = 156.78µm), but its experimental petrophysical data and CN are discrepant.
Therefore, these data suggest that when porosity is better characterized and connectivity is computed (which is the case of samples Coq 9 and A-16), pore-throat size – in this case average pore-throat size – is another parameter that helps explain absolute permeability and should also be considered when evaluating the reservoir quality of coquinas.
CONCLUSION
µ-CT has proved to be a useful additional pore-scale characterization method for coquinas. By using this technique, it was possible to identify the shape and geometry of the pores, not to mention that it also allowed the quantification of the porosity and its respective variation throughout the sample, integrated with the visualization of the segmented pore system. Additionally, by using specific algorithms and applying digital image analysis concepts, it was possible to extract the pore sizes and to hierarchy them into pore-throats to better understand their distribution in different facies. Even though the network is simplified, the topology of the pore system is preserved and, consequently, the pore system is equivalent to the original.
By means of this equivalent network we could quantify and analyze petrophysical parameters otherwise inaccessible with conventional methods (optical microscopy, porosimetry, etc.), such as coordination number and pore and pore-throat sizes and distribution coupled with their visualization. These variables helped understand the degree of connectivity between
Figure 7 – Coordination Number (CN) of the samples Coq 8(A), Coq 9(B), Coq 18(C), Coq 7(D) Coq 10B(E) and A-16(F), extracted though the pore network (3D).
Left: Representation of the porous network in 3D based on the MBA algorithm (pores=spheres; pore-throats=cylinders); Center: Graph showing the variation of the CN and average CN; and Right: Table representative of the CN and its absolute frequency.
Table 4 – Average size of pore and pore-throats of samples based on the quantitative data extracted from the pore network. Depositional environment Taphofacies Sample Average pore size (µm) Average pore-throat size (µm)
Shallow/Storm-influenced T2 Coq 8 213.89 120.30 Shallow/Normal condition T2 Coq 9 259.88 153.95
Deep/Storm-influenced T4 Coq 18 246.26 155.65
Deep/Storm-influenced T5 Coq 7 244.24 162.18
Deep/Storm-influenced T5 Coq 10B 266.66 156.78
Deep/Storm-influenced T5 A-16 348.83 188.00
the elements of the pore system and the easiness with which a fluid can, theoretically, flow in different facies. Considering this, we demonstrated that the taphofacies of groups T2 and T5 are in general better in terms of reservoir quality. However, to correctly analyze the reservoir quality it is important to exclude the vugular pores, which are generated during telogenesis. Thus, rocks from group T5 are more likely to represent a good
reservoir, since the predominant moldic pores are originated during the eogenetic phase. Sample from group T4, on the other hand, yielded lower porosity, narrow pore and pore-throat size distributions, poor coordination numbers, despite the moderate discrepancy regarding pore to pore-throat ratios, and are not considered good reservoirs. Additionally, and more importantly for this study, is that this technique could not only quantify
all studied parameters but also provided a visual insight of which petrophysical properties could explain the differences in permeability, shedding light on what could be the focus to better analyze coquinas considering its reservoir potential. For example, samples Coq 18 (group T4), Coq 8 (group T2) and A-16 (group T5) yielded different experimental permeability, whose explanation can be their very discrepant pore-throat size distribution (or average pore-throat size), coordination number (CN) and porosities. These same parameters are also useful to explain the petrophysical differences taking into account rocks from the same taphofacies.
Unfortunately, the method has some limitations mainly related to theµ-CT image resolution. Since theµ-CT images cannot exactly define features bellow detection limits, which in this case is approximately 28µm, a great number of pores could have not been included in the porous phase. As the experimental results demonstrate, porosity is actually higher than the one calculated viaµ-CT (φµ-CT), varying from fair to good, at the same time that permeability – which was not calculated using the single-resolution images in this study due to the lack of connections – varies from fair to good.
This data corroborates with the fact that, like many other carbonate rocks, despite the depositional origin of coquinas, their pore system is multiscale. Consequently, to correctly characterize such system, it is necessary to image the samples at a better resolution using two or three finer scales. This is absolutely indispensable to properly define the petrophysical properties and evaluate the reservoir quality of these rocks, and will be carried out by our group in future studies.
ACKNOWLEDGEMENTS
The authors want to thank LMPT/UFSC, especially Dr. Anderson C. Moreira and Dr. Iara F. Mantovani, for the acquisition ofµ-CT images, discussion about the technique and the supply of C3DE software. Special thanks to LMMR/CEPETRO for performing the experimental petrophysical tests, to Laboratório de Laminação of IG/UNICAMP for producing the thin sections and to the anonymous reviewers that helped improve this paper. The authors also want to acknowledge Dr. Michelle Kuroda, for her valuable discussions about the segmentation process ofµ-CT images, and M.Sc. Aline Belila for her support in clarifying any doubts related to the coquinas of the Morro do Chaves Formation. Finally, the authors want to extend our gratitude to CAPES (Coordenação de Aperfeiçoamento de Pessoal de Nível Superior) for providing the master’s degree scholarship to the first author.
REFERENCES
AHR WM. 2011. Geology of carbonate reservoirs: the identification, description and characterization of hydrocarbon reservoirs in carbonate rocks. John Wiley & Sons. 296 pp.
AL-KHARUSI ASZ. 2007. Pore-scale characterization of carbonate rocks. Ph.D. thesis. Department of Earth Science and Engineering, Imperial College London. 275 pp.
ANDRÄ H, COMBARET N, DVORKIN J, GLATT E, HAN J, KABEL M, KEEHM Y, KRZIKALLA F, LEE M, MADONNA C, MARSH M, MUKERJI T, SAENGER EH, SAIN R, SEXENA N, RICKER S, WIEGMANN A & ZHAN X. 2013. Digital rock physics benchmarks–Part I: Imaging and segmentation. Computers & Geosciences, 50: 25–32.
APPOLONI CR, FERNANDES CP & RODRIGUES CRO. 2007. X-ray microtomography study of a sandstone reservoir rock. Nuclear Instruments and Methods in Physics Research Section A: Accelerators, Spectrometers, Detectors and Associated Equipment, 580(1): 629–632. ARCHILHA NL, MISSAGIA RM, HOLLIS C, DE CEIA MA, McDONALD SA, LIMA NETO IA, EASTWOOD DS & LEE P. 2016. Permeability and acoustic velocity controlling factors determined from X-ray tomography images of carbonate rocks. AAPG Bulletin, 100(8): 1289–1309. ARNS CH, BAUGET F, LIMAYE A, SAKELLARIOU A, SENDEN T, SHEPPARD A, SOK RM, PINCZEWSKI V, BAKKE S, BERGE LI, ØREN PE & KNACKSTEDT MA. 2005. Pore scale characterization of carbonates using X-ray microtomography. Spe Journal, 10(04): 475–484. AZAMBUJA FILHO NC, ARIENTI L & CRUZ FEG. 1998. Guidebook to the Rift-Drift Sergipe–Alagoas, Passive Margin Basin, Brazil. In: The 1998 American Association of Petroleum Geologists International Conference and Exhibition, Roteiro de Excursão. American Association of Petroleum Geologists, Tulsa, OK, 113 pp.
BERNABÉ Y, LI M, TANG YB & EVANS B. 2016. Pore space connectivity and the transport properties of rocks. Oil & Gas Science and Technology–Revue d’IFP Energies nouvelles, 71(4): 1–17. BERNABÉ Y & MAINEULT A. 2015. Physics of porous media: fluid flow through porous media. Resources in the Near-Surface Earth, p. 19–41. CAINELLI C & MOHRIAK WU. 1998. Geology of Atlantic eastern Brazilian basins. In: Brazilian Geology Part. Volume 2, 67 pp.
CAMPOS NETO OPA, LIMA WS & CRUZ FG. 2007. Bacia de Sergipe-Alagoas. Boletim de Geociências da Petrobras, 15(2): 405–415. CHINELATTO GF, VIDAL AC, KURODA MC & BASILICI G. 2018. A taphofacies model for coquina sedimentation in lakes (Lower Cretaceous, Morro do Chaves Formation, NE Brazil). Cretaceous Research, 85: 1–19.
CHOQUETTE PW & PRAY LC. 1970. Geologic nomenclature and classification of porosity in sedimentary carbonates. AAPG Bulletin, 54(2): 207–250.
CNUDDE V & BOONE MN. 2013. High-resolution X-ray computed tomography in geosciences: A review of the current technology and applications. Earth-Science Reviews, 123: 1–17.
CUNHA AR. 2012. Caracterização de sistemas porosos de rochas reservatório de petróleo a partir da extração de redes poro-ligações. Master’s dissertation. Universidade Federal de Santa Catarina, Brazil. 140 pp.
DONG H. 2008. Micro-CT imaging and pore network extraction. Ph.D. thesis. Department of Earth Science and Engineering, Imperial College London. 213 pp.
FAUZI U, HOERDT A & NEUBAUER FM. 2002. Influence of coordination number and percolation probability on rock permeability estimation. Geophysical Research Letters, 29(8): 8–11.
FIGUEIREDO AMF. 1981. Depositional systems in the Lower Cretaceous Morro do Chaves and Coqueiro Seco Formations, and their relationship to petroleum accumulations, middle rift sequence, Sergipe-Alagoas Basin, Brazil. Ph.D. thesis. The University of Texas, Austin. 275 pp. JIA L, CHEN M & JIN Y. 2014. 3D imaging of fractures in carbonate rocks using X-ray computed tomography technology. Carbonates and Evaporites, 29(2): 147–153.
JIANG Z, VAN DIJKE MIJ, SORBIE KS & COUPLES GD. 2013. Representation of multiscale heterogeneity via multiscale pore networks. Water Resources Research, 49(9): 5437–5449.
KINOSHITA EM. 2010. Modelagem sísmica-geométrica de facies dos carbonatos lacustres da Formação Morro dos Chaves, Bacia de Sergie-Alagoas. Boletim Geociências da Petrobras, 18: 249–269. LANA MDC. 1990. Bacia de Sergipe-Alagoas: uma hipótese de evolução tectono-sedimentar. In: GABAGLIA GPR & MILANI EJ (Eds.). Origem e evolução de bacias sedimentares. p. 311–332. Gávea/Petrobras. LUCIA FJ. 1983. Petrophysical parameters estimated from visual descriptions of carbonate rocks: a field classification of carbonate pore space. Journal of Petroleum Technology, 35(03): 629–637.
LUCIA FJ. 1995. Rock-fabric/petrophysical classification of carbonate pore space for reservoir characterization. AAPG Bulletin, 79(9): 1275–1300.
MACHADO AC, LIMA I & LOPES RT. 2014. Effect of 3d computed microtomography resolution on reservoir rocks. Radiation Physics and Chemistry, 95: 405–407.
MANTOVANI IF. 2013. Microtomografia e nanotomografia de raios X aplicada à caracterização multiescalar de sistemas porosos carbonáticos. Ph.D. thesis. Universidade Federal de Santa Catarina, Brazil. 168 pp. MOSTAGHIMI P, LIU M & ARNS CH. 2016. Numerical simulation of reactive transport on micro-CT images. Mathematical Geosciences, 48(8): 963–983.
MUNIZ MC. 2013. Tectono-stratigraphic evolution of the Barremian-Aptian continental rift carbonates in southern Campos Basin, Brazil. Ph.D. thesis. Royal Holloway, University of London. 324 pp.
OLIVEIRA MFS, LIMA I, BORGHI L & LOPES RT. 2012. X-ray microtomography application in pore space reservoir rock. Applied Radiation and Isotopes, 70(7): 1376–1378.
PAK T, BUTLER IB, GEIGER S, VAN DIJKE MI, JIANG Z & SURMAS R. 2016. Multiscale pore-network representation of heterogeneous carbonate rocks. Water Resources Research, 52(7): 5433–5441. PAK T, BUTLER IB, GEIGER S, VAN DIJKE MI & SORBIE KS. 2015. Droplet fragmentation: 3D imaging of a previously unidentified pore-scale process during multiphase flow in porous media. Proceedings of the National Academy of Sciences, 112(7): 1947–1952. REIS NETO JM, FIORI AP, LOPES AP, MARCHESE C, PINTO-COELHO CV, VASCONCELLOS EMG, DA SILVA GF & SECCHI R. 2011. A microtomografia computadorizada de raios x integrada à petrografia no estudo tridimensional de porosidade em rochas. Revista Brasileira de Geociências, 41(3): 498–508.
SCHALLER H. 1969. Revisão estratigráfica da bacia de Sergipe/Alagoas. Technical report. Petrobras. Brazil.
SCHMITT M. 2014. Pore structure characterization of low permeability rocks. Ph.D. thesis. Programa de Pós-Graduação em Ciência e Engenharia de Materiais, Universidade Federal de Santa Catarina, Brazil. 223 pp.
SCHMITT M, HALISCH M, MÜLLER C & FERNANDES CP. 2016. Classification and quantification of pore shapes in sandstone reservoir rocks with 3-D X-ray micro-computed tomography. Solid Earth, 7(1): 285–300.
SILIN D & PATZEK T. 2006. Pore space morphology analysis using maximal inscribed spheres. Physica A: Statistical mechanics and its applications, 371(2): 336–360.
SILVA AFB. 2012. Caracterização do espaço poroso em rochas por esferas máximas exatas. Master’s dissertation. Universidade Federal de Santa Catarina, Brazil. 151 pp.
SOUZA-LIMA W, ANDRADE EJ, BENGTSON P & GALM PC. 2002. The Sergipe-Alagoas Basin the Sergipe Basin: Geological evolution, stratigraphy and fossil content. Aracaju: Fundação Paleontológica Phoenix, p. 1–34.
TAVARES AC. 2014. Fácies diagenéticas em coquinas da Formação Morro do Chaves (Barremiano/Aptiano da Bacia de Sergipe–Alagoas). Master’s dissertation. Instituto de Geociências, Universidade Federal do Rio de Janeiro. Brazil. 197 pp.
TAVARES AC, BORGHI L, CORBETT P, NOBRE-LOPES J & CÂMARA R. 2015. Facies and depositional environments for the coquinas of
the Morro do Chaves Formation, Sergipe-Alagoas Basin, defined by taphonomic and compositional criteria. Brazilian Journal of Geology, 45(3): 415–429.
THOMPSON DL, STILWELL JD & HALL M. 2015. Lacustrine carbonate reservoirs from Early Cretaceous rift lakes of Western Gondwana: Pre-salt coquinas of Brazil and West Africa. Gondwana Research, 28(1): 26–51.
TIAB D & DONALDSON EC. 2015. Petrophysics: theory and practice of measuring reservoir rock and fluid transport properties. 4th ed., Elsevier,
GP. 918 pp.
VASILYEV L, RAOOF A & NORDBOTTEN JM. 2012. Effect of mean network coordination number on dispersivity characteristics. Transport in Porous Media, 95(2): 447–463.
VOORN M, EXNER U, BARNHOORN A, BAUD P & REUSCHLÉ T. 2015. Porosity, permeability and 3D fracture network characterisation of dolomite reservoir rock samples. Journal of Petroleum Science and Engineering, 127: 270–285.
Recebido em 15 fevereiro, 2018 / Aceito em 9 outubro, 2018 Received on February 15, 2018 / Accepted on October 9, 2018