ECOLOGY, BEHAVIOR AND BIONOMICS
Study of the Drosophilidae (Diptera) Communities on Atlantic Forest
Islands of Santa Catarina State, Brazil
Daniela C. De Toni
1, MarCo S. GoTTSChalk
2, Juliana CorDeiro
3, Paulo P.r. hofMann
1anD Vera
l.S. ValenTe
2,3,41Depto. Biologia Celular, Embriologia e Genética, sala 304, Univ.Federal de Santa Catarina - UFSC 88010970, Florianópolis, SC, [email protected]
2Programa de Pós-Graduação em Biologia Animal; 3Programa de Pós Graduação em Genética e Biologia Molecular 4Depto. Genética. Univ. Federal do Rio Grande do Sul -UFRGS, Av. Bento Gonçalves, 9500
Campus do Vale, 91501970, Porto Alegre, RS Neotropical Entomology 36(3):356-375 (2007)
Estudo das Assembléias de Drosofilídeos (Diptera) de Ilhas com Mata Atlântica de Santa Catarina
RESUMO - Foi realizado um estudo de dinâmica de assembléias de drosofilídeos em seis comunidades
insulares e duas continentais em visitas estacionais ao longo de dois anos, em Santa Catarina. Os
índices de diversidade foram elevados se comparados com os de assembléias de clima temperado. Com relação ao índice de heterogeneidade de espécies de Shannon-Wiener (H’), os pontos localizados no
continente (Serra do Tabuleiro) foram os mais elevados. Esses sítios apresentam Mata Atlântica primária
e, teoricamente, deteriam a maior variabilidade de nichos ecológicos. Um dendograma mostrando a
similaridade entre as assembléias (medida pelo índice de Morisita), apontou para 60% de similaridade.
Nele os pontos continentais e insulares foram os que mais se diferenciaram. Os seis pontos insulares se separam em dois grupos: um que inclui os pontos da Ilha de Santa Catarina, e outro compreendendo
as demais ilhas adjacentes a essa ilha maior. Os agrupamentos mostram a importância do componente
espacial na previsão da estrutura das comunidades. Esse fato levanta a discussão a respeito da grande
complexidade do ecossistema de Mata Atlântica e, conseqüentemente, sua imprevisibilidade, em termos de composição faunística, evidenciando a necessidade de sua conservação.
PALAVRAS-CHAVE: Drosophila, diversidade, Brasil, ecologia
ABSTRACT - A study of the community dynamics of Drosophilidae was carried out in six insular communities and two others on the mainland. Seasonal collections were carried out throughout two years in Santa Catarina State, southern of Brazil. The diversity index calculations show high values when compared with temperate climate communities. The sites on the mainland (Serra do Tabuleiro) presented the highest diversity, which was measured by the Diversity Index (H’). These sites are covered by primary Atlantic Forest and theoretically should have a higher variation of ecological niches. A dendogram showing the similarity between the communities,
calculated by Morisita Index, points to a level of similarity equal to 60% for all communities. In this
diagram, we can see two clades: one on the mainland and the other on the islands. The six island sites are grouped into one clade and separated into two subclades, one including the sites on Santa Catarina Island and the other consisting of the islands adjacent to this last and very much larger one. These groupings show the very important role of the spatial component on the prediction of the structure of the communities. This fact raises the discussion about the high complexity of the Atlantic Forest ecosystem and consequently the unpredictability of its fauna, highlighting the need of its conservation.
KEY WORDS: Drosophila, biodiversity, ecology
The biological diversity of the Atlantic Forest is, doubtless, one of the highest of the planet, being one of the 25 worldwide ecological hotspots of conservation (Myers et al. 2000). Even though its area has been drastically reduced
in relation to the original size (less than 5% of the earlier 1,000,000 km2), it is still capable of supporting an incredible
variety of life forms. According to the 1992 Action Plan of the Biosphere Reserve of the Atlantic Forest, it is characterized by being a full forest with other associated ecosystems such as coastal fens and mangroves, rivers estuaries and lagoons
(environments that can, in some extension, receive influence
altitude fields.
The flies of the Drosophila genus became the preferred insects for the study of genetics from the time of the classic
works of Thomas Morgan in 1910, when crucial aspects of the
chromosome theory and the inheritance were elucidated. The
importance of this organism grew throughout the rest of 20th
century, and nowadays the organism still has an important role in genomic study (Schmitz et al. submitted).
However, Remsen & O’Grady (2002) remark that,
although this insect is frequently utilized in biological
research, the knowledge about Drosophilidae is still sparse. It contains 3,800 species distributed in 65 genera (Bächli 2006), but even with this significant number, and its importance to
the geneticists, models of Drosophila have been only rarely used to illustrate the mechanisms underlying the dynamics of the tropical assemblies.
In Santa Catarina State, some remnants of the Atlantic Forest are still found, many located on coastal islands, but mostly of small extension. In these places, we carried out monthly collections in previous years, and we were able to visualize a general panorama of the wealth of the Drosophilidae assemblies of the region ( Döge et al. 2004,
Gottschalk et al. 2006).
Few studies approaching the population dynamics, estimating parameters of diversity and similarity, have been carried out on the assemblies of Drosophila of the insular Atlantic Forest in Santa Catarina. Furthermore, little has been done in terms of evolutionary studies with these insects. Nothing has been elucidated yet in relation to their degree of ecological diversity or patterns and possible relations of
coexistence among the species. The present work represents an initial attempt to fill this gap.
Methodology
Samples were taken as adults, flying over fermented
banana bait and natural trophic resources (fermented fruits), at eight different sites (Fig. 1). Two of these sites were located on Santa Catarina Island: Morro da Lagoa da Conceição
(27º35’27’S; 48º28’33’W – site A), a collecting point with
sensu strictu secondary Atlantic Forest, in advanced process
of regeneration and without recent human influence; and the Municipal Park of Lagoa do Peri (27º45’23’S; 48º32’58’W
Fig. 1. Map of South America, showing Brazil and Santa Catarina State with the collection sites of Drosophilidae: A) Canto da Lagoa, Ilha de Santa Catarina ; B) Ilha Ratones Grande; C) Ilha Ratones Pequeno; D) Sertão do Peri, Ilha de Santa Catarina; E) Serra do Tabuleiro I; F) Parque Serra do Tabuleiro II, (E and F are on the mainland), G) Ilha Arvoredo; H) Ilha Campeche.
1
2
- site D), classified as sensu latu Atlantic Forest, being one of the few regions with remnants of Primary Forest on Santa Catarina Island, suffering only from small spots of deforested area and some abandoned agricultural zones.
Four sites are located on small islands near the mainland:
Ratones Grande Island (27º28’58’S; 48º33’71’W - site B),
located to the north of Santa Catarina Bay, approximately
0.8 km from the west coast of Santa Catarina Island; Ratones Pequeno Island (27º29’69’S; 48º33’97’W - site
C), positioned a few hundred meters from Ratones Grande
Island; Campeche Island (27º41’81’S; 48º28’88’W - Site
H), to the east of the Island of Santa Catarina, approximately
1.5 km from the coast, being the most extreme easterly
located collection site of this research; and Arvoredo Island
(27º17’57’S; 48º21’23’W - Site G), situated 8 km from
the north of Santa Catarina Island, being the northernmost sampling site studied in this research.
Two other collecting sites were located on the mainland
in the Serra do Tabuleiro State Park (27º44’48’S; 48º48’44’W - Site E; 27º44’55’S; 48º48’72’W - Site F). This park is the
biggest conservation unit of Santa Catarina, with an area of
87,405 ha, showing varied vegetation and congregating five of
the six botanical compositions of the State of Santa Catarina. Three to six days were spent at each site for collecting. These collection phases were seasonal and lasted two years beginning in March 1999. Concomitant with the
accomplishment of the sampling stage, the identification
of the flies by external morphology observation was
effected (Freire-Maia & Pavan 1949). In cases of sibling
species, dissection of the male terminalia was also done. A representative number of individuals were conserved and
kept in the Drosofilid Laboratory of the UFSC collection.
The description of the assemblies in terms of absolute (ni) and relative (pi) abundance of the species (Brower & Zar
1984) was made for each sample and site. The heterogeneity estimators of Shannon-Wiener - H’, the estimation of
evenness (Smith & Wilson 1996) - EVAR, and the species richness (S) were calculated. The species number was used in the calculations of the rarefaction analyses - SRAR, for each collection. To compare the results with those of other ecology studies of Drosophilidae in Brazil, the values of the dominance index of Simpsom (D), the effective number of species that had contributed to the diversity (Exp H’) and the Pielou’s evenness (J’) were calculated.
Even if all these ecological parameters were only for application at the species level, the use of the subgroup was adopted in the case of the two willistoni subgroup species (D. willistoni Sturtevant and D. paulistorum Dobzhansky and Pavan) because they were the most abundant species in our collections they were very similar in morphology, and
the identification of the females would have been impossible without checking their male progenies. This procedure
led to a small bias towards underestimating the diversity and evenness indices, and also an overestimation of the dominance indices.
The software Ecological Methodology 5.2 (Krebs 1999) was used to calculate the species rarefaction. In order to compare different samples, the minimum sampling number for a collection (51 individuals) was used, as suggested by Begon et al. (1996).
Variance analysis was carried out by ANOVA - Turkey’s
HSD test to verify whether the calculated diversity indices had differentiated between the places and seasons, using Statistica Software 5.1’ 98 edition (StatSoft 1998). Rarefaction curves for each point of collection were plotted.
The decomposition of the diversity values was conducted, trying to establish the reasons for the different patterns obtained. This decomposition was achieved using the divergences found between the index of heterogeneity H’ of each assembly, considering the factors space, time and season.
The similarity between the subsamples was calculated by the index of Morisita (IM). To facilitate the visualization of this similarity, dendograms were constructed using the analysis of groupings UPGMA – unweighted pair-group
method using arithmetic averages (Sneath & Sokal 1973).
Results and Discussion
A total of 49,368 Drosophilidae were collected during the
entire sampling period. In the Annex (Tables 1 to 8) we present the data of the absolute (ni) and relative (pi) abundance of
the different identified species of Drosophilidae at the eight
studied sites during the different seasons of the year. Is noticeable that some species present a higher abundance in the community to which they belong, consequently
influencing the diversity of this association (Table 1).
Generally, the sites D, E, F and H tend to have higher
values for the heterogeneity index of Shannon-Wiener (H’),
but the only significant difference found was between points F and A. The first one presented the highest values (ANOVA: F = 3.25, df = 7, P = 0.01; Turkey: P =.032). Despite the
seasonal variations of H’, which was not significant, it turned out to be higher in the winter and spring.
When the values of the evenness index of Smith-Wilson
(EVAR) were compared, there were no significant differences among the sampled sites. However, this index showed seasonal differences: the values for winter are higher than
those for the autumn and summer (ANOVA: F = 5.42, df = 3, P = 0.004; Turkey: P = 0.005 and 0.039 for the respective
comparisons).
The number of species observed (S) in each collection
presented only seasonal variation (ANOVA: F = 5.42, df = 3, P = 0.004). The differences between the sampled points were
small, but E and F, the most preserved sites, tended to be the richest areas. Comparing the number of species for the different seasons, the autumn presented the highest S, followed by
spring. These two seasons have significantly more species than the winter (Turkey: P = 0.002 and 0.027, respectively). The
numbers of species measured with the rarefaction technique (SRAR) also showed significant differences, but only in the seasonal comparisons, where the values for the spring were higher than those for the winter (ANOVA stops: F = 3.36, df
= 3, P = 0.031; Turkey: P = 0.039).
Tidon (2006) compared Drosophilidae populations of the
Cerrado biome and the Gallery Forest, pointing to a more elevated diversity in the dry season (winter) in both ecosystems,
despite the higher specific richness in the humid periods. The
and the migration of these species to the adjacent ecosystems. In this case, the diversity is increased by the evenness of the contribution of each individual species.
In the autumn months, an increase of the richness of species was observed in the studied assemblies. But in the winter, in a more elevated environmental stress situation, the populations were reduced, causing an increment of the diversity related to the increase of the evenness as observed
by Tidon (2006).
The rarefaction curves, based on the accumulated data of each sampling site (Fig. 2), show a very similar richness of species among the collection points as well. The most diverse was the point F, corroborating the results of the ANOVA tests. In Fig. 2, it is also possible to observe in the number of collected species a trend towards stabilization.
Despite the fact that the ANOVA analysis did not point to a significant difference between the found diversity values H’, its decomposition (Table 2) indicates the spatial Table 1. Average and standard error of the observed indices values in each collection site, with the respective P. For the abbreviations of the indices see text.
Indices/collecting sites H’ EVAR S SRAR D J’ Exp H’
A – Morro da Lagoa 1.61 (0.98) 0.22 (0.10) 17.0 (3.6) 6.41 (3.97) 0.53 (0.25) 0.39 (0.22) 8.32 (11.43)
B - Ilha de Ratones Grande 1.70 (0.33) 0.21 (0.02) 18.0 (6.6) 6.48 (1.32) 0.49 (0.09) 0.43 (0.10) 5.72 (2.06)
C - Ilha de Ratones Pequena 1.87 (0.28) 0.18 (0.05) 15.6 (5.5) 6.58 (1.24) 0.42 (0.10) 0.49 (0.10) 6.69 (1.79)
D – Sertão do Peri 2.31 (0.98) 0.26 (0.16) 16.5 (6.3) 7.64 (4.24) 0.35 (0.27) 0.59 (0.23) 13.79 (8.91)
E - Serra do Tabuleiro I 2.27 (0.65) 0.29 (0.08) 14.8 (5.2) 8.45 (1.80) 0.32 (0.18) 0.60 (0.16) 11.31 (5.83)
F - Serra do Tabuleiro II 2.52 (0.57) 0.29 (0.09) 14.9 (3.7) 9.13 (2.08) 0.27 (0.11) 0.65 (0.13) 14.27 (8.25)
G - Ilha do Arvoredo 1.74 (0.52) 0.25 (0.16) 14.8 (6.6) 5.90 (1.61) 0.46 (0.15) 0.48 (0.18) 6.45 (3.54)
H - Ilha do Campeche 2.17 (0.52) 0.24 (0.05) 16.1 (4.2) 7.71 (1.86) 0.35 (0.13) 0.54 (0.10) 9.82 (4.79) 0 10 20 30 40 50 60
0 1000 2000 3000 4000 5000 6000 7000 8000 9000 10000
Absolute abundance S p ec ie s
Site A Site B Site C Site D Site E
Site F Site G Site H
component as the most important for its determination
(36.0%), followed by the seasons (26.6%). These results reflect the great complexity and environmental heterogeneity
of the Atlantic Forest, and consequently its unpredictable fauna composition.
Benado & Brncic (1994) studied the decomposition of
the diversity components of the Drosophilidae community during eight years in La Florida, Chile. They showed that the variation throughout the years had an importance of only
5.15% in the explanation of the total variation. The seasonal component had a participation of 23.53%, the monthly value obtained was 39.70% and 31.62% of the variation was
considered to be inexplicable. In other words, among the temporal variations in this Chilean assembly, the monthly accumulated variation added to the seasonal variation totaled
62.6%, pointing to the seasonal component as being one of
the main factors responsible for maintaining the values of H’. However, the studied Chilean community is located in a region of temperate climate, which might possibly have maximized the importance of the seasonal factor.
Bearing in mind the huge diversity of insects, Fager (1968) suggested that one could determine a dominant species in a guild of invertebrates. However, in a temperate zone, this same species can lose its dominance, a fact that would be entirely unpredictable. In the assemblies of Drosophila analyzed in this study though, it was often possible to forecast
which species would be dominant in a specified period.
In the studied communities, almost all sampling points (with the exception of C and F) had high levels of S, and the values found for the diversity were low due to the elevated dominance of the willistoni subgroup (Table 1).
Brncic et al. (1985), in their three-year-long analysis of another Drosophilid assembly, stated that the seasonal patterns of occurrence of each species is the product of a long and continuous process of adaptation to the environmental conditions in which the species live.
Thus, the different climatic conditions throughout the
year are critical to the population fluctuation. It is well known
that temperature and humidity affect the majority of the vital Drosophila parameters such as viability, mating behavior, fertility, development time, offspring, and other factors that are directly related to the growth of a population. Also, the temperature affects the agility and therefore the number of
flies moving towards the bait.
Temperature, humidity and light intensity are considered
factors that, even independently of density, regulate the population growth. Besides that these elements also have
influence over the alimentary resources and the action of
parasites and predators (density dependent factors). The plant phenology explored by the Drosophila species depends, in turn, directly on the climatic factors, strengthening the importance of the seasons for the composition of the assemblies.
Concerning the willistoni group, several studies regarding
the frequency of seasonal fluctuations of this group have
already been done, due precisely to the importance of these species in the Brazilian assemblies. D. willistoni, the most representative species of the subgroup, exerted dominance in almost all of our collections (Table 1). According to diverse authors, the willistoni subgroup species have a clear preference for the summer and autumn, seasons with warmer
and more humid months (Patterson 1943, Dobzhansky & Pavan 1950, Franck & Valente 1985). Curiously, Borba & Napp (1985) did not find these species in abundance in Rio
Grande Do Sul during the summer. However, they observed that the occurrence of some warm and humid days in the
winter is sufficient to modify the phenological patterns of the
fruit trees and thus to trigger the availability of feeding and breeding sites for the species of this subgroup throughout the year. Burla et al. (1950) affirm that D. willistoni is common on the Angra dos Reis islands even in the absence of fruits. Valiati & Valente (1996) point out that the species of this subgroup have great ecological versatility.
Our data corresponded to these results and seem to strengthen the idea of the willistoni subgroup’s appearance following the phenology of the palm trees in the Atlantic Forest (Borba & Napp 1985, Valente & Araújo 1986, Saavedra et al. 1995). Our collections with the highest abundance of these species were those executed during September and May, on Ratones Grande Island, where its preferred resource, the palm fruits (S. romanzoffiana Glassman), were abundant in
these months. In these months, we had the highest peak of
occurrence of these species.
Drosophila capricorni was collected by Dobzhansky &
Pavan (1950) in he Vila Atlântica, SP, in the months of August
until November and, again, from May through July. The trend of preference for mild temperature months shown by this species was also observed at almost all of our collection points. Because of its intense presence in the colder months at the F site, it was considered to be the dominant species there.
Dobzhansky & Pavan (1950) also state that, from January to
March, there is an observable increment in the population of D. fumipennis. This was confirmed by our records, since the most representative collection of samples of this species occurred in exactly the same period. D. nebulosa, in turn, is known for being more frequently collected in open vegetal formations (Val et al. 1981, Martins 1987). This species is always rare in forest environments, and in fact its frequencies were very low in our collections, coinciding with the sampled driest periods.
These data agree with the results obtained by Petersen (1960), who took samples in Rio Grande do Sul State.
The species of the cardini group have, according to Rohde & Valente (1996), divergent preferences regarding the environment that they colonize. In the period covered by this study, D. polymorpha was found more abundantly Table 2. Differences observed in the H’ between sites,
between seasons and between years plotted for each collecting site and the respective percentage on the total variation observed.
Differences observed H’ % Between sites 0.68 36.0 Between seasons 0.50 26.6 Between years 0.00 0.0 Not explained 0.70 37.4
in cold and dry months and D. cardinoides was found more abundantly in the warm and humid months. The Spearman correlations obtained were positive concerning the high humidity for the former species and negative for the latter. On
the other hand, Petersen (1960) collected D. polymorpha in December, with high temperatures, in some forest localities of Rio Grande do Sul.
In our study, the flies of this group, especially D. polymorpha, showed a preference for the warmer months, in contrast with what was observed in the study of Rohde & Valente (1996), carried out in the city of Porto Alegre. This species was present in almost all of our collections, with its occurrence apparently more tied to the relative humidity than to the temperature.
De Toni & Hofmann (1995) have found more elevated amounts of D. griseolineata in the mild temperature months. According to Sene et al. (1980) this species and D. maculifrons have been collected together in many forests of Brazil, but this coincidence was not observed in the present investigation and we believe that D. maculifrons tends to have a westernmost distribution in Santa Catarina State, as observed by Val et al. (1981) for a São Paulo State population. De Toni & Hofmann (1995) have collected D. sturtevanti and D. neoelliptica predominantly in the warmer periods. In the collections of the present research, besides these two species, we also found D. saltans, D. prosaltans and D. parasaltans (cf.), all of which are very rare and, like the other species of the group, they appeared principally in the warmer months.
Other genera of Drosophilidae such as Zaprionus, Zygothrica, Rhinoleucophenga, Cladochaeta, Diathoneura, Mycodrosophila, Leucophenga, Scaptodrosophila and Amiota have also been collected. Zaprionus indianus, an invader species, initially appeared in lower frequencies that increased gradually in the subsequent collections. This type of invasion was also registered by Sevenster (1992), who found the emergence of D. malerkotliana in natural resources of Panama, a place where this species is an invader,
surpassing the native species in frequency, and confirming
the generalist and polyphagic character of these invaders.
Concerning the seasonal fluctuations of these other genera,
with the exception of Zaprionus that has a clear preference for the warmer months, (corroborated by Silva et al. 2005), no seasonal trend was registered.
Brncic & Valente (1978) suggested that perhaps the gregarious habit in Drosophila occurs even without sufficient
density to allow competition, since as Dobzhansky & Pavan (1950) observed, many species of the genus are found in
the same regions and seasons, apparently without mutual
influence. Da Cunha et al. (1951) supposed that the coexistence
could take place due to the different alimentary source utilized by each species. Later, this idea was confirmed by Dobzhansky
& Da Cunha (1955), Da Cunha et al.(1957) and Klaczko et al. (1983, 1986). However, Brncic & Valente (1978) stated that the niche interference in a physical space shared by the larvae would probably affect the survival of the individuals. The occurrence, in our samples, of fermented fruits not containing preadults of Drosophila seems to indicate that
the amount of food does not represent a key factor in the
coexistence of these species. In contrast, the interference would
be the most decisive factor. These last authors remember that in the laboratory, the larvae of D. pavani Brncic inhibit the growth of other species, particularly of D. willistoni, and that
facilitates the development of its own larvae (Budnik & Brncic 1974). Therefore, this kind of interspecific relationship could explain why some species like D. willistoni, D. simulans, D. mercatorum, D. pallidipennis and D. bandeirantorum have an aggregate distribution that is independent of the available resources, tending to facilitate themselves.
This fact illustrates the difficulty of understanding the
complex patterns found in the assemblies of Neotropical insects, and it is a sign of the stability of species in the
mature assemblies. As Tidon-Sklorz & Sene (1992) affirm,
the complexity of the dynamics of the tropical assemblies is a result of the interventions in the populations by factors such as ambient variation, natural selection, genetic derivation and inbreeding at different times and in different spaces. The interaction of all these factors, in alternating periods, can lead to an instability that could help to clarify the tropical diversity through the constant adaptation and differentiation of the populations.
Comparing the diversity of the analyzed assemblies with the values calculated by Saavedra et al. (1995) for the assemblies of Rio Grande do Sul State, it is perceivable that the values obtained in this study are closer to the ones
found for the Guaíba localities (sites covered by a kind of forest known as “capões”, where the climatic conditions are
unstable, and the resources are scarce and unpredictable) and Bento Gonçalves (a forest of low altitude and temperature). In these places, the H’ was 1.69 for Guaíba, very close to 1.74, the value found for Arvoredo Island (Point G). However, these three assemblies presented different richnesses of
species (S). On Arvoredo Island 42 species were captured, while at Guaíba and Bento Gonçalves, only 13 were captured.
This fact reinforces the importance of the dominance that the species of the willistoni subgroup exert in the studied communities. It is especially clear in Morro da Lagoa (site
A), a place where an elevated quantity of species (46)
was found and its diversity was similar to those of the Rio Grande do Sul sites mentioned above, which revealed only 13 different species each. The values of J’ were higher in
Guaíba (0.66) and Bento Gonçalves (0.60), indicating that
the well-distributed though small number of species found at these points contribute more regularly to the perpetuation of the local diversity than those of higher quantity from Santa Catarina involved in this study.
It is shown in Table 2 that the Morro da Lagoa site presented the least diversity of all points analyzed in the present study (H’ = 1.61). However, a higher number of species were found, suggesting that the environmental stability leads to a constancy in the species richness and a better possibility of adaptation for native species, as
exemplified by D. willistoni.
acquired monthly, over a collection period of three years. They found differences in two periods of sampling: January to May, with lower H’ and J’; and June to December, with higher H’ and J’. The highest diversity verified by the authors was in December (Exp H’ = 5.29 and J’ = 0.70) and the lowest was in March (Exp H’ = 1.17 and J’ = 0.25). The values of S were 6 and 13 species for the respective months, and a total of 17 different species collected for the whole period. Again, the low values of S when compared with the ones of the Atlantic Forest assemblies are evident. Although some dominant species occurred in the Chilean communities such as the cosmopolitan D. simulans and the invader D. subobscura Collin these species do not represent as large a portion of the community as the willistoni subgroup does in the Santa Catarina State. A similar situation arises when we compare the Santa Catarina State assemblies to the ones studied by
Benado & Brncic (1994). These authors also analyzed the
diversity of the assemblies of La Florida, in Chile. They found that the values of H’ varied from 1.78 in winter to 0.53 in the autumn, with S values ranging from 12 species collected in the winter to three in the autumn, totaling 16 species. D. simulans and D. subobscura had exerted some dominance, but it was incomparable to the supremacy imposed by the willistoni subgroup in assemblies studied in this research, since the values of H’ were considerably higher even with a small value of S.
A contrasting fact in our results was the greater diversity found in the winter due to the decrease in the dominance of some species. De Toni & Hofmann´s (1995) one year analysis for a Drosophilid community of Morro da Lagoa da Conceição found higher values of H’ for October (0.94),
August (0.91) and June (0.77), and lower values for the
autumn and summer months. The number of species by collection (S) ranged from seven in January to 20 in November. In these collections, a number for S was close to the values we obtained in this present study. However, the dominance of D. willistoni led to a decrease in the indices
of diversity in the present work.
In the drosophilid community that emerged from Parahancornia amapa Ducke,studied by Martins (1996) during a period of three years in the Amazon, the values of H’ were 1.78 in 1990, 1.50 in 1991 and 1.37 in 1992; J’ index
values were 0.38 in 1990, 0.53 in 1991 and 0.34 in 1992, and S resulted in 25 species in 1990, 7 species in 1991 and 17 species
in 1992. This tendency towards reduction in the diversity is interpreted by the author as the result of invasion by the exotic D. malerkotliana, which dislocated the native species and thus reduced the diversity level. However, although the values for diversity were elevated, there was no constancy of the relative contribution of the species to the increment of this index (J’). This demonstrates that, in this Amazonian assembly, the dominance is also an important factor in its structure, as well as in the Santa Catarina assemblies (D = 0.58, 0.62 and 0.57
for the years 1990, 1991 and 1992 respectively). The values
of D were low in almost all of the assemblies of the present study (Table 1), with the exception of the community of Morro
da Lagoa (D = 0.61).
D. schineri and D. fuscolineata were collected for the first time in the south of Brazil, widening, therefore, the southern limit of distribution of these species.
Our results revealed a high level of biological richness for the communities of the Atlantic Forest when compared with the same index of other ecosystems. This fact demonstrates that efforts towards the conservation of this ecosystem are extremely necessary because, even though it is highly
devastated, approximately 7% of the remainder of this forest
still lodges a diversity which is vastly superior to that of the ecosystems of temperate climate.
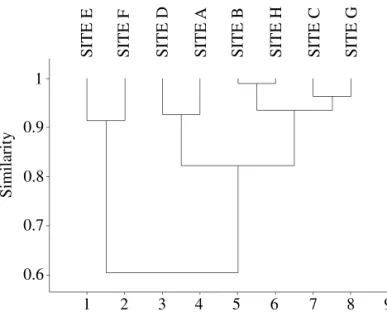
The degree of similarity between the different assemblies was compared in relation to the different sites and seasons through the Morisita index (MI), in which the data were
transformed (log (n+1)) as suggested by Wolda (1992), represented in Figs. 3 and 4 in the form of UPGMA
phylogenies.
In Fig. 3, the relationship of similarity for the sampling sites is represented at each collection point. The set of
assemblies presents a similarity of approximately 60%. The primary separation is in two clades: the first of which is continental (with about 90% of similarity) and the second of which is insular (with 81% of similarity), showing the
importance of the spatial component in the forecast of the community structure. The six insular grouped sites are
separated into two other clades (with 82% of similarity): one
including the sites on Santa Catarina Island and the other, with two subclades, comprising the adjacent islands and subdividing itself into 2 others, joining the Ratones Grande Island with Campeche Island (B and H) and Ratones Pequeno Island with Arvoredo Island (C and G). In this in case, the grouping is due to the similarity of environments found on
each island. The most greatly modified environments were
found in the C and G clades, in which an increase was found
in the abundance of “exotic” species, such as D. simulans.
In Fig. 4, the similarities of each collection are represented individually. We can observe that some collections at points like E and F are separated from the rest.
They include the best-preserved Atlantic Forest region of all the collecting points. Site F is the only one with primary Atlantic Forest. The remaining sites are grouped in function
Fig. 3. Dendogram showing the similarity relationships between the studied assemblies.
1
0.9
0.8
0.7
0.6
1 2 3 4 5 6 7 8 9
SITE E SITE F SITE D SITE
A
SITE B SITE H SITE C SITE G
Acknowledgements
The authors are extremely grateful to the entire team of the Drosophila laboratories of UFSC and UFRGS for their
assistance in collection and analysis; to the Polícia Ambiental
de Florianópolis for transportation to the biological reserve of Ilha do Arvoredo; to the Associação Couto de Magalhães for transportation to the Ilha Campeche; to DAEX of the Universidade Federal de Santa Catarina for the transportation to the Ilha Ratones; to the Hotel Plaza Caldas da Imperatriz,
particularly to the biologist Fernando Brügemann, for the
facilities in the Serra do Tabuleiro collection. This research
was financed by CNPq, FAPERGS, FINEP, and
PROPESQ-UFRGS.
References
Bächli, G. 2006. Taxodros: The database on taxonomy of Drosophilidae. Consulted May 2006. URL: http://www. taxodros.unizh.ch/.
Begon, M., J.L. Harper & C.R. Townsend. 1996. Ecology: Individuals,
populations and communities. Oxford, Blackwell, 885p. Benado, M. & D. Brncic. 1994. An eight year phenological study
of a local drosophilid community in Central Chile. Z. Zool. Syst. Evolut.-forsch 32: 51-63.
Borba, C.M.B. & M. Napp. 1985. Contribuição ao estudo das
populações naturais de Drosophila willistoni do Estado do Rio Grande do Sul. Cienc. Natur. 7: 181-195.
Brncic, D., M. Budnik & R. Guiñez. 1985. An analysis of a
Drosophila community in Central Chile during a three-year
period. Z. Zool. Syst. Evolut-forsch 23: 90-100.
Brncic, D. & V.L.S. Valente. 1978. Dinâmica de comunidades de
Drosophila que se estabelecem em frutos silvestres no Rio
Grande do Sul. Cienc. Cult. 30: 1104-1111.
Brower, E.J. & H.J. Zar. 1984. Field and laboratory methods for general ecology. 2ª ed. Iowa, Wm. C. Brown (Publishers), 226p. Budnik, M. & D. Brncic. 1974. Preadult competition between
Drosophila pavani and D. melanogaster Meigen, D. simulans
and D. willistoni. Ecology 55: 657-661.
Burla, H., A.B. Da Cunha, A.G.L. Cavalcanti, T. Dobzhansky & C. Pavan. 1950. Population density and dispersal rates in Brazilian
Drosophila willistoni. Ecology 31: 393-404.
Cunha, A.B. Da, T. Dobzhansky & A. Sokoloff. 1951. On food
preferences of sympatric species of Drosophila. Evolution
5: 97-101.
Cunha, A.B. Da, A.M. Shehata & W. Oliveira. 1957. A study of
the diets and nutritional preferences of tropical species of
Drosophila. Ecology 38: 98-106.
Dobzhansky, T. & A.B. Da Cunha. 1955. Differentiation of
nutritional preferences in Brazilian species of Drosophila. J.
Anim. Ecol. 19: 1-14.
Dobzhansky, T. & C. Pavan. 1950. Local and seasonal variations
Fig. 4. Dendogram showing the similarity relationships
between the studied assemblies at the different seasons. Numbers after the letter indicate the collecting site are corresponding with the months of the year.
10 20 30 40 50 60 E8 B3 H6 H1 C7 D7 D8 D2 D3 B8 D4 E4 F4 E1 F1 A2 A6 E5 F5 A4 A8 A5 B2 C6 C2 C3 H3 G2 G3 G7 B6 H2 B7 B1 B5 C5 G4 G5 C4 C1 G1 B4 H5 C8 H4 D1 A1 D5 G8 H8 H7 A7 D6 G6 A3 E7 E3 F3 F7 E2 F2 E6 F6 F8
of the influence of seasonal variation over the composition
of the assemblies, since they are all covered by Atlantic Forest that is in the process of regeneration.
The species of the melanogaster group and Z. indianus are more representative in the most altered sites. The presence of these Atlantic Forest cosmopolitan and invader species causes the higher similarity in the communities of these localities. This information is corroborated by Döge et al. (2004),
in relative frequencies of species of Drosophila in Brazil. J.
Anim. Ecol. 19: 1-14.
Döge, J.S., M.S. Gottschalk, D.C. De Toni, L.E. Bizzo, S.C.F. Oliveira, V.L.S. Valente & P.R.P. Hofmann. 2004. New
records of six species of subgenus Sophophora (Drosophila,
Drosophilidae) collected in Brazil. Zootaxa 675:1-6.
Fager, E.W. 1968. The community of invertebrates in decaying oak wood. J. Anim. Ecol. 7: 121-42.
Ferreira, L.B. & R. Tidon. 2005. Colonizing potential of
Drosophilidae (Insecta, Diptera) in environments with different
grades of urbanization. Biodiv. Conserv. 14: 1809-1821. Franck, G. & V.L.S. Valente. 1985. Study on the flutuation in
Drosophila populations of Bento Gonçalves, RS, Brasil. Rev.
Bras. Biol. 45: 133-141.
Freire-Maia, N. & C. Pavan. 1949. Introdução ao estudo da drosófila.
Cultus 1: 1-171.
Gottschalk, M.S., J.S. Döge, S.C.F. Oliveira, D.C. De Toni, V.L.S. Valente & P.R.P. Hofmann. 2006. On the geographic
distribution of the Drosophila subgenus in southern Brazil (Drosophilidae, Diptera). The Drosophila repleta species group
Sturtevant 1942. Trop. Zool. 19: 129-139.
Klaczko, L.B., J.R. Powell & C.E. Taylor. 1983. Drosophila baits:
Species attracted. Oecologia 59: 411-413.
Klaczko, L.B., C.E. Taylor & J.R. Powell. 1986. Genetic variation
for dispersal by Drosophila pseudoobscura and Drosophila
persimilis. Genetica 112: 229-235.
Krebs, C.J. 1999. Ecological metodology. New York, ED., 620p.
Martins, M. 1987. Variação espacial e temporal de algumas espécies e grupos de Drosophila (Diptera) em duas reservas de matas isoladas, nas vizinhanças de Manaus (Amazonas, Brasil). Bol. Mus. Para. Emilio Goeldi Ser. Zool. 3: 195-217.
Martins, M.N. 1996. Drosófilas e outros insetos associados a frutos
de Parahanchornia amapa dispersos sobre o solo da floresta.
Tese de Doutoramento em Ecologia, Universidade Estadual
de Campinas, Campinas, 203p.
Myers, N., R.A. Mittermeyer, C.G. Mittermeyer, G.A.B. Fonseca
& J. Kent. 2000. Biodiversity spots for conservation priorities. Nature 403: 853-858.
Patterson, J. T. 1943. The Drosophilidae of the soutwest. Univ. Texas Publ. 4313: 7-216.
Petersen, J. A. 1960. Studies on the ecology of the genus Drosophila. I. Collection in two different life zones and seasonal variations
in Rio Grande do Sul, Brazil. Rev. Bras. Biol. 20: 3-16. Remsen, J. & P. O’Grady. 2002. Phylogeny of Drosophilinae
(Diptera: Drosophilidae), with comments on combined analysis
and character support. Mol. Phyl. Evol. 24: 249-264.
Rohde, C. & V.L.S. Valente. 1996. Ecological characteristics of urban populations of Drosophila polymorpha Dobzhansky
& Pavan and Drosophila cardinoides Dobzhansky & Pavan (Diptera, Drosophilidae). Rev. Bras. Entomol. 40: 75-79.
Saavedra, C.C.R., S.M. Callegari-Jacques, M. Napp & V.L.S Valente. 1995. A descriptive and analytical study of four neotropical
Drosophilid communities. J. Zool. Syst. Evol. Res. 33: 62-74.
Schmitz, H.J., P.R.P. Hofmann & V.L.S. Valente. Ecology of communities of drosophilids (Diptera, Drosophilidae) in mangrove forests. Biotropica (submitted).
Sene, F.M., F.C. Val, C.R. Vilela & M.A.Q.R.Pereira. 1980.
Preliminary data of geographical distribution of Drosophila
species within morphoclimatic domains of Brazil. Pap. Avulsos Zool. 33: 315-326.
Sevenster, J.G. 1992. The community ecology of frugivorous
Drosophila in a neotropical forest. Univ. Leiden, The
Netherlands, 167p.
Silva N.M., C.C. Fantinel, V.L.S. Valente & V.H. Valiati. 2005. Ecology of colonizing populations of the figfly Zaprionus
indianus (Diptera, Drosophilidae) in Porto Alegre, Southern
Brazil. Iheringia Ser. Zool. 95: 233-240.
Smith, B. & B. Wilson. 1996. A consumer’s guide to evenness indices. OIKOS 76: 70-82.
Sneath, P.H. & R.R. Sokal. 1973. Numerical taxonomy. San Francisco, Freeman & Co., 573p.
StatSoft, Inc. 1998. STATISTICA for Windows [Computer program
manual]. Tulsa, OK: URL: http://www.statsoft.com.
Tidon, R. 2006. Relationships between drosophilids (Diptera,
Drosophilidae) and the environment in two contrasting tropical
vegetations. Zool. J. Linn. Soc. 87: 233-247.
Tidon-Sklorz, R. & F.M. Sene. 1992. Vertical and temporal
distribution of Drosophila (Diptera, Drosophilidae) species in a wooden area in the state of São Paulo, Brazil. Rev. Bras. Biol. 52: 311-317.
Toni, D.C. De & P.R.P. Hofmann. 1995. Preliminary taxonomic survey of the genus Drosophila (Diptera, Drosophilidae) at Morro Lagoa da Conceição, Santa Catarina Island, Brazil. Rev.
Bras. Biol. 55: 347-35.
Val, F.C., C.R. Vilela & M.D. Marques. 1981. Drosophilidae of the Neotropical region, p.2-168a. In M. Ashburner, H.L. Carson & I.N. Thompson Jr. (eds.), The genetics and biology of
Drosophila. Academic Press, New York, 168p.
Valente, V.L.S. & A.M. Araújo. 1986. Comments on breeding sites
of Drosophila willistoni Sturtevant (Diptera, Drosophilidae).
Rev. Bras. Entomol. 30: 281-286.
Valiati, V.H. & V.L.S. Valente. 1996. Observations on ecological parameters of urban populations of Drosophila paulistorum Dobzhansky & Pavan (Diptera, Drosophilidae). Rev. Bras. Entomol. 40: 225-231.
Wolda, H. 1992. Trends in abundance of tropical insects. Oecologia 89: 47-52.
Annex
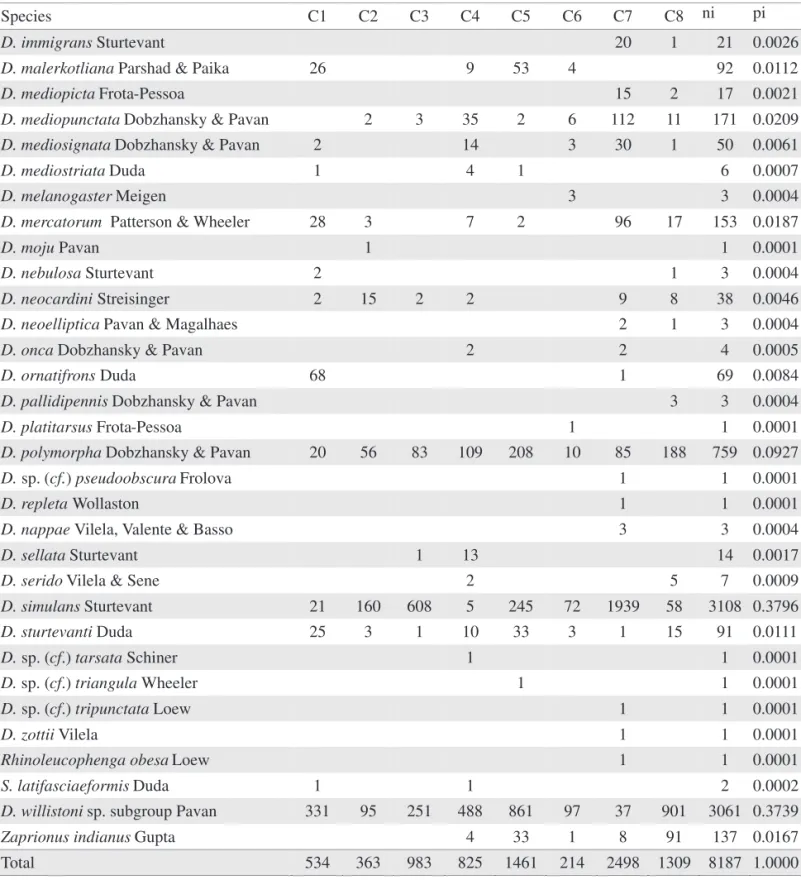
Table 1. Absolute abundance (ni) and relative abundance (pi) of the collected species from Morro da Lagoa da Conceição
(site A) at different seasons. The numbers after the site letter mean: 1 = autumn 1, 2 = winter 1, 3 = spring 1, 4 = summer
1, 5 = autumn 2, 6 = winter 2, 7 = spring 2 and 8 = summer 2.
Species A1 A2 A3 A4 A5 A6 A7 A8 ni pi
Amiota sp.1 1 1 0.0001
D. alagitans Patterson & Mainland 7 7 0.0007
D. angustibucca Duda 2 2 0.0002
D. annulimana Duda 1 2 3 0.0003
D. atrata Burla & Pavan 1 1 0.0001
D. bandeirantorum Dobzhansky & Pavan 6 6 1 13 0.0012
D. bocainensis Pavan & Cunha 2 2 0.0002
D. bocainoides Carson 2 2 0.0002
D. sp.(cf.) bodemannae Pipkin & Heed 1 1 0.0001
D. buskii Coquillett 3 3 0.0003
D. capricorni Dobzhansky & Pavan 3 266 96 25 47 576 85 9 1107 0.1030
D. dreyfusi Dobzhansky & Pavan 4 1 12 17 0.0016
D. fascioloides Dobzhansky & Pavan 1 1 0.0001
D. fumipennis Duda 18 5 2 155 65 1 246 0.0229
D. griseolineata Duda 70 6 4 4 2 3 3 1 93 0.0087
D. hydei Sturtevant 23 23 0.0021
D. immigrans Sturtevant 10 1 11 0.0010
D. maculifrons Duda 2 2 0.0002
D. malerkotliana Parshad & Paika 59 1 1 61 0.0057
D. mediopicta Frota-Pessoa 1 2 47 2 3 8 2 65 0.0060
D. mediopunctata Dobzhansky & Pavan 2 8 8 3 30 13 1 65 0.0060
D. mediostriata Duda 1 2 1 1 5 0.0005
D. melanogaster Meigen 17 17 0.0016
D. mercatorum Patterson & Wheeler 0 1 1 6 10 18 0.0017
D. nebulosa Sturtevant 2 2 0.0002
D. neocardini Streisinger 1 2 2 3 1 9 0.0008
D. neoelliptica Pavan & Magalhaes 3 1 5 2 7 18 0.0017
D. neosaltans Pavan & Magalhaes 1 1 0.0001
D. onca Dobzhansky & Pavan 1 10 1 12 0.0011
D. ornatifrons Duda 5 5 0.0005
D. paraguayensis Duda 4 3 7 1 5 2 22 0.0020
D. platitarsus Frota-Pessoa 1 1 0.0001
D. polymorpha Dobzhansky & Pavan 6 19 4 258 52 19 10 75 443 0.0412
D. prosaltans Duda 5 1 6 0.0006
D. replete Wollaston 7 7 0.0007
D. roehrae Pipkin & Heed 1 1 3 5 0.0005
Species A1 A2 A3 A4 A5 A6 A7 A8 ni pi
D. sellata Sturtevant 1 1 0.0001
D. simulans Sturtevant 12 7 33 3 3 58 0.0054
D. sturtevanti Duda 3 3 2 11 2 2 27 50 0.0047
D. sp.1 1 1 0.0001
Rhinoleucophenga obesa Loew 2 2 4 0.0004
Mycodrosophila sp.1 1 1 0.0001
S. latifasciaeformis Duda 1 1 0.0001
D. willistoni sp. subgroup Pavan 902 116 2 1268 811 1085 32 4095 8311 0.7732
Zaprionus indianus Gupta 18 1 3 22 0.0020
Zygothrica orbitalis Sturtevant 3 3 0.0003
Total 1094 440 183 1584 1115 1846 282 4205 10749 1.0000
Table 1. Continuation.
Table 2. Absolute abundance (ni) and relative abundance (pi) of the collected species from Ratones Grande Island (site
B) at different seasons. The numbers after the site letter mean: 1 = autumn 1, 2 = winter 1, 3 = spring 1, 4 = summer 1, 5 =
autumn 2, 6 = winter 2, 7 = spring 2 and 8 = summer 2.
Species B1 B2 B3 B4 B5 B6 B7 B8 ni pi
D. angustibucca Duda 1 1 0.0002
D. annulimana Duda 1 1 0.0002
D. atrata Burla & Pavan 13 1 3 28 45 0.0074
D. bandeirantorum Dobzhansky & Pavan 4 1 1 6 12 0.0020
D. bocainoides Carson 1 1 2 0.0003
D. briegeri Pavan & Breurer 1 1 0.0002
D. capricorni Dobzhansky & Pavan 6 49 4 1 1 49 7 117 0.0192
D. cardinoides Dobzhansky & Pavan 2 1 3 0.0005
D. dreyfusi Dobzhansky & Pavan 3 3 0.0005
D. sp. (cf.) freilejoni Hunter 1 1 0.0002
D. fumipennis Duda 7 3 3 1 20 1 35 0.0057
D. griseolineata Sturtevant 9 1 6 2 64 15 1 98 0.0161
D. hydei Sturtevant 1 1 2 0.0003
D. immigrans Sturtevant 1 3 1 5 0.0008
D. malerkotliana Parshad & Paika 119 1 17 137 0.0225
D. mediopicta Frota-Pessoa 2 13 2 3 20 0.0033
D. mediopunctata Dobzhansky & Pavan 18 7 2 5 5 37 0.0061
D. mediostriata Duda 4 2 1 7 0.0011
D. melanogaster Meigen 1 6 2 9 0.0015
D. mercatorum Patterson & Wheeler 7 1 10 5 6 14 43 0.0071
D. meridionalis Wasserman 4 4 0.0007
D. moju Pavan 1 1 0.0002
D. nebulosa Sturtevant 3 3 0.0005
Species B1 B2 B3 B4 B5 B6 B7 B8 ni pi
D. neocardini Streisinger 2 3 9 9 5 28 0.0046
D. neosaltans Pavan & Magalhaes 1 1 0.0002
D. neoelliptica Pavan & Magalhaes 1 1 2 0.0003
D. sp. (cf.) obscura Fallen 1 1 0.0002
D. onca Dobzhansky & Pavan 1 2 2 6 5 16 0.0026
D. ornatifrons Duda 1 4 5 0.0008
D. pallidipennis Dobzhansky & Pavan 2 1 1 4 0.0007
D. paraguayensis Duda 5 3 4 1 14 2 29 0.0047
D. polymorpha Dobzhansky & Pavan 21 15 196 64 112 4 41 97 550 0.0903
D. prosaltans Duda 3 4 7 0.0011
D. repleta Wollaston 2 2 0.0003
D. sellata Sturtevant 1 1 1 47 50 0.0082
D. senei Vilela 1 1 0.0002
D. serido Vilela & Sene 5 5 0.0008
D. simulans Sturtevant 61 74 861 45 148 40 135 30 1394 0.2289
D. sturtevanti Duda 50 3 42 1 96 0.0158
D. sp. (cf.) triangula Wheeler 1 1 0.0002
D. zottii Vilela 5 5 0.0008
D. sp. 1 1 1 0.0002
D. sp. 2 6 6 0.0010
D. sp. 3 12 12 0.0020
Rhinoleucophenga obesa Loew 1 2 3 0.0005
D. willistoni sp. subgroup Pavan 725 388 23 400 917 66 4 701 3224 0.5294
S. latifasciaeformis Duda 2 2 4 0.0007
Zaprionus indianus Gupta 9 32 13 54 0.0089
Zygothrica dispar Duda 2 2 0.0003
Total 1048 512 1212 553 1420 112 274 959 6090 1.0000
Table 2. Continuation.
Table 3. Absolute abundance (ni) and relative abundance (pi) of the collected species from Ratones Pequeno Island (site
C) at different seasons. The numbers after the site letter mean: 1 = autumn 1, 2 = winter 1, 3 = spring 1, 4 = summer 1, 5 =
autumn 2, 6 = winter 2, 7 = spring 2 and 8 = summer 2.
Species C1 C2 C3 C4 C5 C6 C7 C8 ni pi
D. atrata Burla & Pavan 1 2 1 10 6 20 0.0024
D. bandeirantorum Dobzhansky & Pavan 1 3 1 12 5 22 0.0027
D. bocainensis Pavan & Cunha 1 1 0.0001
D. capricorni Dobzhansky & Pavan 10 14 2 13 79 118 0.0144
D. fumipennis Duda 1 1 3 5 0.0006
D. griseolineata Sturtevant 5 15 19 112 9 34 194 0.0237
D. guaru Dobzhansky & Pavan 1 1 0.0001
D. hydei Sturtevant 1 1 2 0.0002
Species C1 C2 C3 C4 C5 C6 C7 C8 ni pi
D. immigrans Sturtevant 20 1 21 0.0026
D. malerkotliana Parshad & Paika 26 9 53 4 92 0.0112
D. mediopicta Frota-Pessoa 15 2 17 0.0021
D. mediopunctata Dobzhansky & Pavan 2 3 35 2 6 112 11 171 0.0209
D. mediosignata Dobzhansky & Pavan 2 14 3 30 1 50 0.0061
D. mediostriata Duda 1 4 1 6 0.0007
D. melanogaster Meigen 3 3 0.0004
D. mercatorum Patterson & Wheeler 28 3 7 2 96 17 153 0.0187
D. moju Pavan 1 1 0.0001
D. nebulosa Sturtevant 2 1 3 0.0004
D. neocardini Streisinger 2 15 2 2 9 8 38 0.0046
D. neoelliptica Pavan & Magalhaes 2 1 3 0.0004
D. onca Dobzhansky & Pavan 2 2 4 0.0005
D. ornatifrons Duda 68 1 69 0.0084
D. pallidipennis Dobzhansky & Pavan 3 3 0.0004
D. platitarsus Frota-Pessoa 1 1 0.0001
D. polymorpha Dobzhansky & Pavan 20 56 83 109 208 10 85 188 759 0.0927
D. sp. (cf.) pseudoobscura Frolova 1 1 0.0001
D. repleta Wollaston 1 1 0.0001
D. nappae Vilela, Valente & Basso 3 3 0.0004
D. sellata Sturtevant 1 13 14 0.0017
D. serido Vilela & Sene 2 5 7 0.0009
D. simulans Sturtevant 21 160 608 5 245 72 1939 58 3108 0.3796
D. sturtevanti Duda 25 3 1 10 33 3 1 15 91 0.0111
D. sp. (cf.) tarsata Schiner 1 1 0.0001
D. sp. (cf.) triangula Wheeler 1 1 0.0001
D. sp. (cf.) tripunctata Loew 1 1 0.0001
D. zottii Vilela 1 1 0.0001
Rhinoleucophenga obesa Loew 1 1 0.0001
S. latifasciaeformis Duda 1 1 2 0.0002
D. willistoni sp. subgroup Pavan 331 95 251 488 861 97 37 901 3061 0.3739
Zaprionus indianus Gupta 4 33 1 8 91 137 0.0167
Total 534 363 983 825 1461 214 2498 1309 8187 1.0000
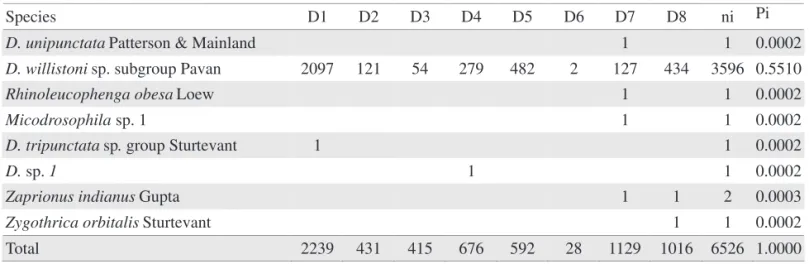
Table 4. Absolute abundance (ni) and relative abundance (pi) of the collected species from Sertão do Peri (site D) at
different seasons. The numbers after the site letter mean: 1 = autumn 1, 2 = winter 1, 3 = spring 1, 4 = summer 1, 5 = autumn
2, 6 = winter 2, 7 = spring 2 and 8 = summer 2.
Species D1 D2 D3 D4 D5 D6 D7 D8 ni Pi
D. angustibucca Duda 4 2 6 0.0009
D. annulimana Duda 1 1 0.0002
D. atrata Burla & Pavan 8 2 1 11 0.0017
D. bandeirantorum Dobzhansky & Pavan 3 8 8 2 4 5 30 0.0046
D. bocainensis Pavan & Cunha 10 4 14 0.0021
D. sp. (cf.) caponei Pavan & Cunha 7 7 0.0011
D. capricorni Dobzhansky & Pavan 36 149 65 13 5 10 10 288 0.0441
D. sp. (cf.) divisa Duda 1 1 0.0002
D. fascioloides Dobzhansky & Pavan 1 1 0.0002
D. fumipennis Duda 8 3 14 25 0.0038
D. griseolineata Sturtevant 4 72 51 59 14 2 297 160 659 0.1010
D. immigrans Sturtevant 16 16 0.0025
D. kikkawai Burla 1 1 0.0002
D. malerkotliana Parshad & Paika 8 2 10 0.0015
D. sp. (cf.) medioimpressa Frota-Pessoa 3 3 0.0005
D. mediopicta Frota-Pessoa 2 8 18 1 1 23 4 57 0.0087
D. mediopunctata Dobzhansky & Pavan 26 18 16 6 1 12 168 29 276 0.0423 D. mediosignata Dobzhansky & Pavan 54 48 16 20 14 4 186 40 382 0.0585
D. melanogaster Meigen 1 18 19 0.0029
D. mercatorum Patterson & Wheeler 0 6 7 4 12 16 45 0.0069
D. sp. (cf.) mesostigma Frota-Pessoa 5 33 1 39 0.0060
D. neocardini Streissinger 1 1 50 16 20 88 0.0135
D. neoelliptica Pavan & Magalhaes 1 4 5 0.0008
D. onca Dobzhansky & Pavan 0 1 7 8 16 0.0025
D. ornatifrons Duda 0 3 7 2 12 0.0018
D. pallidipennis Dobzhansky & Pavan 1 1 0.0002
D. paraguayensis Duda 19 19 0.0029
D. neosaltans Pavan & Magalhaes 1 1 0.0002
D. mediopictoides Heed & Wheeler 34 34 0.0052
D. platitarsus Frota-Pessoa 2 2 0.0003
D. sp. (cf.) platitarsus Frota-Pessoa 1 1 2 0.0003
D. polymorpha Dobzhansky & Pavan 6 87 29 109 3 90 153 477 0.0731
D. prosaltans Duda 2 2 0.0003
D. nappae Vilela, Valente & Basso 2 2 4 0.0006
D. sellata Sturtevant 1 10 1 12 0.0018
D. schilde Malloch 1 1 0.0002
D. simulans Sturtevant 9 6 32 16 101 118 282 0.0432
D. sturtevanti Duda 9 3 1 19 33 8 73 0.0112
Species D1 D2 D3 D4 D5 D6 D7 D8 ni Pi
D. unipunctata Patterson & Mainland 1 1 0.0002
D. willistoni sp. subgroup Pavan 2097 121 54 279 482 2 127 434 3596 0.5510
Rhinoleucophenga obesa Loew 1 1 0.0002
Micodrosophila sp. 1 1 1 0.0002
D. tripunctata sp. group Sturtevant 1 1 0.0002
D. sp. 1 1 1 0.0002
Zaprionus indianus Gupta 1 1 2 0.0003
Zygothrica orbitalis Sturtevant 1 1 0.0002
Total 2239 431 415 676 592 28 1129 1016 6526 1.0000
Table 4. Continuation.
Table 5. Absolute abundance (ni) and relative abundance (pi) of the collected species from Serra do Tabuleiro - I (site
E) at different seasons. The numbers after the site letter mean: 1 = autumn 1, 2 = winter 1, 3 = spring 1, 4 = summer 1, 5 =
autumn 2, 6 = winter 2, 7 = spring 2 and 8 = summer 2.
Species E1 E2 E3 E4 E5 E6 E7 E8 ni pi
Cladochaeta bomplandi Coquillett 6 6 0.0017
D. angustibucca Duda 27 11 38 0.0107
D. atrata Burla & Pavan 2 2 0.0006
D. bandeirantorum Dobzhansky & Pavan 20 2 4 6 4 36 0.0101
D. bocainensis Pavan & Cunha 8 3 1 1 13 0.0037
D. bocainoides Carson 2 2 0.0006
D. sp.(cf.) bodemannae Pipkin & Heed 1 1 0.0003
D. calloptera Schiner 1 1 2 0.0006
D. capricorni Dobzhansky & Pavan 701 39 59 45 207 7 58 1116 0.3135
D. dreyfusi Dobzhansky & Pavan 1 12 3 16 0.0045
D. fascioloides Dobzhansky & Pavan 1 1 0.0003
D. fumipennis Duda 1 10 11 0.0031
D. fuscolineata Duda 1 1 0.0003
D. griseolineata Sturtevant 5 4 4 5 17 1 13 1 50 0.0140
D. guarani Dobzhansky & Pavan 1 1 0.0003
D. immigrans Sturtevant 0 2 2 0.0006
D. maculifrons Duda 1 1 0.0003
D. medioimpressa Frota-Pessoa 2 1 3 0.0008
D. mediopicta Frota-Pessoa 17 2 68 24 8 2 39 6 166 0.0466
D. mediopunctata Dobzhansky & Pavan 20 2 24 6 8 4 21 7 92 0.0258
D. melanogaster Meigen 2 4 6 0.0017
D. mercatorum Patterson & Wheeler 0 1 9 10 0.0028
D. mesostigma Frota-Pessoa 4 8 12 0.0033
D. neocardini Streisinger 1 1 0.0003
D. neoelliptica Pavan & Magalhaes 4 3 7 0.0020
Table 5. Continuation.
Species E1 E2 E3 E4 E5 E6 E7 E8 ni pi
D. ornatifrons Duda 3 1 1 5 0.0014
D. paraguayensis Duda 93 17 32 23 20 45 15 245 0.0688
D. platitarsus Frota-Pessoa 26 5 5 2 2 3 43 0.0121
D. polymorpha Dobzhansky & Pavan 13 1 62 24 2 102 0.0287
D. prosaltans Duda 4 2 6 0.0017
D. repleta Wollaston 2 2 0.0006
D. nappae Vilela, Valente & Basso 14 9 23 0.0065
D. roehrae Pipkin & Heed 1 1 0.0003
D. schineri Pereira & Vilela 3 2 5 0.0014
D. simulans Sturtevant 1 2 10 13 0.0037
D. sturtevanti Duda 35 25 1 61 0.0171
D. tristriata Heed & Wheeler 1 1 0.0003
D. willistoni sp. subgroup Pavan 819 2 3 112 380 5 130 1451 0.4076
D. zottii Vilela 1 1 0.0003
Diathoneura brasiliensis Duda 1 1 0.0003
D. sp. 1 1 1 0.0003
Rhinoleucophenga obesa Loew 1 1 2 0.0006
Zygothrica orbitalis Sturtevant 1 1 0.0003
Total 1761 103 242 298 745 79 178 154 3560 1.0000
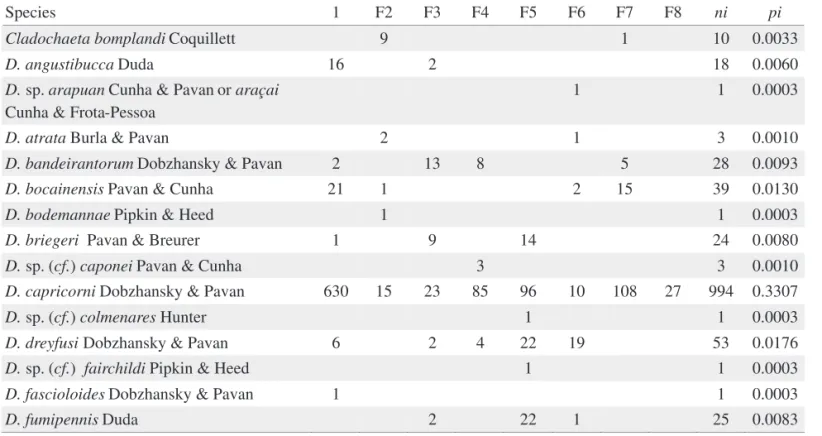
Table 6. Absolute abundance (ni) and relative abundance (pi) of the collected species from Serra do Tabuleiro - II (site
F) at different seasons. The numbers after the site letter mean: 1 = autumn 1, 2 = winter 1, 3 = spring 1, 4 = summer 1, 5 =
autumn 2, 6 = winter 2, 7 = spring 2 and 8 = summer 2.
Continue
Species 1 F2 F3 F4 F5 F6 F7 F8 ni pi
Cladochaeta bomplandi Coquillett 9 1 10 0.0033
D. angustibucca Duda 16 2 18 0.0060
D. sp. arapuan Cunha & Pavan or araçai Cunha & Frota-Pessoa
1 1 0.0003
D. atrata Burla & Pavan 2 1 3 0.0010
D. bandeirantorum Dobzhansky & Pavan 2 13 8 5 28 0.0093
D. bocainensis Pavan & Cunha 21 1 2 15 39 0.0130
D. bodemannae Pipkin & Heed 1 1 0.0003
D. briegeri Pavan & Breurer 1 9 14 24 0.0080
D. sp. (cf.) caponei Pavan & Cunha 3 3 0.0010
D. capricorni Dobzhansky & Pavan 630 15 23 85 96 10 108 27 994 0.3307
D. sp. (cf.) colmenares Hunter 1 1 0.0003
D. dreyfusi Dobzhansky & Pavan 6 2 4 22 19 53 0.0176
D. sp. (cf.) fairchildi Pipkin & Heed 1 1 0.0003
D. fascioloides Dobzhansky & Pavan 1 1 0.0003
Table 6. Continuation.
Species 1 F2 F3 F4 F5 F6 F7 F8 ni pi
D. griseolineata Sturtevant 4 1 2 17 8 1 33 0.0110
D. immigrans Sturtevant 1 9 10 0.0033
D. maculifrons Duda 2 2 0.0007
D. medioimpressa Frota-Pessoa 4 10 7 21 0.0070
D. mediopicta Frota-Pessoa 13 6 39 43 25 31 21 178 0.0592
D. mediopunctata Dobzhansky & Pavan 7 3 14 3 40 10 135 212 0.0705
D. mediostriata Duda 2 2 0.0007
D. melanogaster Meigen 5 5 0.0017
D. mercatorum Patterson & Wheeler 1 1 0.0003
D. sp. (cf.) mesophragmatica Duda 1 1 0.0003
D. sp. (cf.) mesostigma Frota-Pessoa 12 17 2 31 0.0103
D. neocardini Streisinger 1 1 1 3 0.0010
D. neoelliptica Pavan & Magalhaes 2 2 0.0007
D. onca Dobzhansky & Pavan 1 1 0.0003
D. ornatifrons Duda 8 4 12 0.0040
D. paraguayensis Duda 110 129 17 18 55 44 373 0.1241
D. sp. (cf.) mediopictoides Heed & Wheeler 19 19 0.0063
D. platitarsus Frota-Pessoa 25 27 2 3 2 59 0.0197
D. polymorpha Dobzhansky & Pavan 3 44 8 5 2 62 0.0206
D. sp. (cf.) nappae Vilela, Valente & Basso 18 18 0.0060
D. roehrae Pipkin & Heed 2 12 14 0.0047
D. senei Vilela 1 1 0.0003
D. setula Heed & Wheeler 8 8 0.0027
D. simulans Sturtevant 1 17 1 19 0.0063
D. sturtevanti Duda 1 3 19 1 24 0.0080
D. sp. (cf.) tristriata Heed & Wheeler 2 2 0.0007
D. unipunctata Patterson & Mainland 1 1 0.0003
Diathoneura brasiliensis Duda 2 2 0.0007
Rhinoleucophenga obesa Loew 2 2 0.0007
Leucophenga sp.1 2 2 0.0007
D. willistoni sp. subgroup Pavan 280 5 204 186 675 0.2246
D. sp. 2 8 8 0.0027
Zygothrica orbitalis Sturtevant 1 1 0.0003
Table 7. Absolute abundance (ni) and relative abundance (pi) of the collected species from Arvoredo Island (site G) at
different seasons. The numbers after the site letter mean: 1 = autumn 1, 2 = winter 1, 3 = spring 1, 4 = summer 1, 5 = autumn
2, 6 = winter 2, 7 = spring 2 and 8 = summer 2.
Continue
Species G1 G2 G3 G4 G5 G6 G7 G8 ni pi
D. angustibucca Duda 1 1 2 0.0003
D. atrata Burla & Pavan 3 1 4 0.0006
D. sp. (cf.) bodemannae Pipkin & Heed 3 3 0.0004
D. capricorni Dobzhansky & Pavan 3 5 1 20 29 0.0043
D. cardinoides Dobzhansky & Pavan 1 1 0.0001
D. sp. (cf.) fragilis Wheeler 1 1 0.0001
D. fumipennis Duda 3 5 8 0.0012
D. griseolineata Sturtevant 2 1 20 180 12 2 217 0.0319
D. guaru Dobzhansky & Pavan 1 1 0.0001
D. hydei Sturtevant 2 2 0.0003
D. immigrans Sturtevant 2 1 3 0.0004
D. kikkawai Burla 5 5 0.0007
D. maculifrons Duda 12 12 0.0018
D. malerkotliana Parshad & Paika 694 23 717 0.1055
D. mediopicta Frota-Pessoa 8 8 0.0012
D. mediopunctata Dobzhansky & Pavan 5 3 15 32 1 56 0.0082
D. mediostriata Duda 3 3 0.0004
D. melanogaster Meigen 1 1 6 8 0.0012
D. mercatorum Patterson & Wheeler 7 5 4 12 5 3 115 151 0.0222
D. mesostigma Frota-Pessoa 4 4 0.0006
D. nebulosa Sturtevant 13 1 3 17 0.0025
D. neocardini Streisinger 16 5 3 11 5 3 43 0.0063
D. onca Dobzhansky & Pavan 5 3 2 2 12 0.0018
D. pallidipennis Dobzhansky & Pavan 1 1 0.0001
D. paraguayensis Duda 2 21 37 10 70 0.0103
D. platitarsus Frota-Pessoa 1 1 0.0001
D. polymorpha Dobzhansky & Pavan 53 81 48 32 23 12 249 0.0366
D. prosaltans Duda 1 1 1 4 7 0.0010
D. sellata Sturtevant 1 1 1 2 1 6 0.0009
D. serido Vilela & Sene 7 1 2 10 0.0015
D. simulans Sturtevant 184 449 411 93 690 5 164 41 2037 0.2998
D. sturtevanti Duda 31 18 11 3 63 0.0093
D. zottii Vilela 1 1 0.0001
Diathoneura brasiliensis Duda 2 2 0.0003
D. willistoni sp. subgroup Pavan 1817 83 63 221 155 23 560 2922 0.4301
S. latifasciaeformis Duda 3 1 1 1 4 10 0.0015
D. tripunctata sp. group Sturtevant 2 2 0.0003
Table 8. Absolute abundance (ni) and relative abundance (pi) of the collected species from Campeche Island (site H)
at different seasons. The numbers after the site letter mean: 1 = autumn 1, 2 = winter 1, 3 = spring 1, 4 = summer 1, 5 =
autumn 2, 6 = winter 2, 7 = spring 2 and 8 = summer 2. Table 7. Continuation.
Species G1 G2 G3 G4 G5 G6 G7 G8 ni pi
D. sp. 2 1 1 0.0001
D. sp. 3 1 1 0.0001
Zaprionus indianus Gupta 17 75 6 98 0.0144
Zygothrica dispar Duda 1 1 2 0.0003
Total 2861 642 536 463 1242 82 218 750 6794 1.0000
Species H1 H2 H3 H4 H5 H6 H7 H8 ni pi
D. angustibucca Duda 2 2 0.0006
D. atrata Burla & Pavan 14 1 1 1 3 1 21 0.0060
D. bandeirantorum Dobzhansky & Pavan 9 1 10 0.0029
D. bocainensis Pavan & Cunha 1 1 0.0003
D. sp. (cf.) bodemannaePipkin & Heed 1 1 0.0003
D. bromelioides Pavan & Cunha 8 1 9 0.0026
D. capricorni Dobzhansky & Pavan 3 9 1 19 3 35 0.0100
D. cardinoides Dobzhansky & Pavan 2 2 4 0.0011
D. fascioloides Dobzhansky & Pavan 1 1 0.0003
D. sp. (cf.) fragilis Wheeler 3 3 0.0009
D. griseolineata Sturtevant 1 18 12 2 1 37 5 76 0.0218
D. guaraja King 1 3 4 0.0012
D. guaru Dobzhansky & Pavan 1 1 0.0003
D. hydei Sturtevant 1 1 1 3 0.0009
D. immigrans Sturtevant 2 7 8 2 19 0.0055
D. kikkawai Burla 2 3 5 0.0014
D. malerkotliana Parshad & Paika 32 1 33 0.0095
D. mediopicta Frota-Pessoa 3 1 12 16 0.0046
D. mediopunctata Dobzhansky & Pavan 6 1 2 1 11 21 0.0060
D. mediostriata Duda 1 37 11 49 0.0141
D. melanogaster Meigen 17 4 18 110 149 0.0427
D. mercatorum Patterson & Wheeler 14 19 3 4 2 17 59 0.0169
D. neocardini Streisinger 6 3 49 18 1 77 0.0221
D. onca Dobzhansky & Pavan 7 3 4 14 0.0040
D. pallidipennis Dobzhansky & Pavan 4 4 0.0011
D. paraguayensis Duda 26 2 1 1 5 13 4 52 0.0149
D. neosaltans Pavan & Magalhaes 2 2 0.0006
D. polymorpha Dobzhansky & Pavan 50 11 28 23 22 197 10 31 372 0.1067
D. prosaltans Duda 1 1 0.0003
Table 8. Continuation.
Species H1 H2 H3 H4 H5 H6 H7 H8 ni pi
D. quadrum Wiedemann 1 1 0.0003
D. repleta Wollaston 1 1 0.0003
D. nappae Vilela, Valente & Basso 1 1 0.0003
D. sellata Sturtevant 1 2 2 5 0.0014
D. serido Vilela & Sene 3 3 0.0009
D. simulans Sturtevant 195 13 33 57 129 198 7 18 650 0.1865
D. sturtevanti Duda 1 4 4 4 13 0.0037
D. zottii Vilela 1 1 0.0003
Rhinoleucophenga obesa Loew 1 1 1 42 45 0.0129
Leucophenga sp.1 1 1 2 0.0006
D. willistoni sp. subgroupPavan 152 72 239 196 271 267 61 435 1693 0.4857
D. sp 1 2 2 0.0006
Zaprionus indianus Gupta 4 15 5 24 0.0069
Zygothrica dispar Duda 1 1 0.0003