Photosynthetic capacity of three phytoplanktonic
species measured by a pulse amplitude
fluorometric method
cleber c. figueredo
1, alessandra giani
1*and José p. lemos filho
1.
1 Departamento de Botânica, Instituto de Ciências Biológicas, Universidade Federal de Minas Gerais, PO Box 486,
31270-010 Belo Horizonte, MG, Brazil.
* Corresponding author: agiani@icb.ufmg.br. Received: 04 April 2009; Accepted: 22 October 2009.
abstract
During photosynthesis, absorbed energy that is not used in photochemical reactions dissipates as fluorescence. Fluorescence provides important information on the physiological conditions of the studied organisms and its measurement is widely used by plant physiologists and can be valuable in phytoplankton studies. We describe a method adapting a plant fluorometric equipment to measure the photosynthetic capacity of microalgae. Unialgal cultures of three planktonic chlorophytes were exposed to 3(3,4-dichlorophenyl)-1,1-dimethylurea (DCMU), an inhibitor of photosystem II, at concentrations of 0.1, 1.0 and 10.0 µmol.L-1. Estimates
were made of photosynthetic parameters, including operational and potential photosystem II quantum yield and electron transport rate between photosystems, using algal cells concentrated on glass-fiber filters. The technique allowed reliable measurements of fluorescence, and detection of distinct levels of inhibition. Physiological or morphological characteristics of the selected species might provide an explanation for the observed results: differences on the surface/volume ratio of the cells and colony morphology, for example, were associated with contrasting resistance to the toxicant. To characterize inhibition on phytoplanktonic photosynthesis, we suggest operational quantum yield and electron transport rate as best parameters, once they were more sensitive to the DCMU toxicity. Key words: chlorophytes photosynthesis, Electron Transport Rate, phytoplankton.
resUMo
inibição da fotossíntese fitoplanctônica, nós sugerimos o rendimento quântico efetivo e a taxa de transporte de elétrons como os parâmetros mais adequados, uma vez que foram os mais sensíveis à toxicidade do DCMU.
Palavras-chave: fotossíntese em clorófitas, taxa de transporte de elétrons, microfitoplâncton.
introDUction
When the photosynthetic apparatus absorbs more light energy than can be used for photochemical conversions, the excessive excitation energy has to be dissipated to maintain normal physiological cell conditions. The dissipation of non-photochemical energy occurs as heat and fluorescence (Schreiber, 2003). Fluorescence is mainly emitted by the photosystem II (PSII) associated chlorophyll a, and it is a measure of its photosynthetic capacity and physiological conditions (Schreiber, 2003).
Fluorescence parameters are a rapid, sensitive, non-invasive and non-destructive methodology (Schreiber et al., 1995; Juneau and Popovic, 1999) for physiological studies. They allow the assessment of different factors on photosynthesis, at concentration lower than that affecting growth rates (Macedo et al., 2008), and a more specific evaluation of one photosystem, since fluorescence is mainly linked to PSII (Dorigo and Leboulanger, 2001).
Several methods to assess chlorophyll a fluorescence were developed and employed in plant research (Schreiber and Bilger, 1987). Among different fluorescence techniques, the pulse amplitude modulation (PAM) fluorometry is widely used today. This method operates with three kinds of light, modulated, actinic, and saturating, which allow the analyses of fluorescence-induction kinetics in plants and the evaluation of their primary productivity (see Schreiber, 1986, for detailed discussion). Important parameters for the evaluation of the photosynthetic metabolic state (Schreiber, 1986) can be quantified, such as the potential PSII quantum yield (represented as ΦM or Fv/Fm), the operational PSII quantum
yield (represented as Φ’M or ∆F/F’m), and the electron
transport rate (ETR) between PSII and PSI.
However, PAM fluorometry is not yet widely used in phytoplankton studies, although it clearly opens new research opportunities in aquatic ecology. Lu and Vonshak (1999), for example, investigated several characteristics of the PSII photochemistry and evaluated the use of different fluorescence parameters as indicators for photoinhibition
in outdoor cyanobacterial cultures. Parkhill et al. (2001) measured the efficiency and sensitivity of PAM fluorometry to study the effects of nutrient stress on phytoplankton potential quantum yield. Villareal (2004) used a PAM system to study the photosynthetic responses of the giant diatom
Ethmodiscus, in comparison with co-occurring species and bulk phytoplankton. However, even if PAM fluorometry can show a great potential to evaluate environmental conditions or to study new aspects of phytoplankton ecophysiology, species particularities or different culture conditions have shown to affect the final results (Nash and Quayle, 2007), therefore the technique has to be used very accurately.
The present work aims to present a simple methodology, which adapt a PAM equipment, routinely used for terrestrial plant (Mini-PAM, Waltz, Germany), to obtain useful and reliable measurements of the photosynthetic capacity of different phytoplanktonic species. Measurements of absolute values of photosynthetic parameters in phytoplankton are not completely understood (Wilhelm et al., 2004) and its discussion is beyond the scope of the present study. The purpose of this research was to estimate algal species-specific susceptibility to a toxicant, through relative values. Our goal was also to evaluate if variations in fluorescence parameters could be precisely detected by Mini-PAM and, thus, if the equipment would be an useful tool for algal ecophysiological studies. Finally, we also intended to suggest the best parameter to detect inhibitory effects on PSII of phytoplankton, based on measurements performed on light- (ΦM) and dark-adapted algae (Φ’M and ETR).
Materials anD MethoDs
Fluorescence methodology (a short review): The operational (effective) PSII quantum yield (Φ’M) corresponds
to the effective plant capacity to convert light energy into chemical energy. To measure Φ’M, samples are maintained
under ambient light conditions, when QA (quinone A, the first
(F’) is recorded and a very intense saturation pulse (SP) is applied on the sample. This pulse leads to a complete closure of PSII (i.e. full reduction of QA). At this moment, additional
energy captured in PSII cannot be used in photochemistry and is emitted as a maximal fluorescence F’m. With F’ and F’m
values, we can calculate the effective PSII quantum yield as:
Φ’M = (∆F/F’m) = (F’m – F’)/F’m
The measurements can be made under increasing actinic light levels to obtain a curve of Φ’M. Changes of the minimal
(F’) and maximal (F’m) fluorescence yield are recorded for
these light intensities by SPs given periodically. Such curve provides a notion of the current status of light adaptation to the ambient light conditions (Schreiber et al., 1997). The relative photosynthetic electron transport rate (ETR) between PSII and PSI can be calculated as the multiplication of Φ’M with
the corresponding light intensity of photosynthetically active radiation (PAR) (Genty et al., 1989; Wilhelm et al., 2004):
ETR = Φ’M· PAR · 0.5
The 0.5 factor is often used in the literature because only about 50% of the absorbed quanta are distributed to the photosystem II (PSII) (Schreiber et al., 1995). The other 50% fraction is directly absorbed by the photosystem I (PSI).
Measurements of the potential quantum yield are taken in dark conditions, when all PSII reaction centers are open, and the minimal fluorescence, F0, emitted mainly from
antenna pigments (Krause and Weis, 1991), is measured. After the recording of F0, a very intense pulse of light is
emitted that saturates the reaction centers, suppressing the photochemical quenching (Schreiber, 1986). Under this condition, the excessive excitation of chlorophyll pigments must be dissipated, and a maximum fluorescence value, Fm,
is recorded. Using these measurements, we can calculate the potential quantum yield as:
ΦM = (Fv/Fm) = (Fm – F0)/Fm
Algal strains: Water samples were collected by a Van Dorn sampler in a central station in Lagoa Santa lake (Minas Gerais, Brazil) between August 2003 and August 2004. Strains of several phytoplanktonic species were isolated and are maintained in batch culture conditions at the Phycology Laboratory of the Federal University of Minas Gerais. Clonal non-axenic cultures were established using microcapillary pipettes for isolation of individual cell, trichome or colonie under
an optical microscope. Cultures were grown in Erlenmeyer flasks at 22±1ºC, under 110 µmol photon · m-2· s-1 provided
by cool-white fluorescent lamps at a light-dark cycle of 12:12 h. Isolation and growth of cultures were performed in WC medium (Guillard and Lorenzen, 1972).
Experiments: Three chlorophyte cultures (Tetrallantos lagerheimii Teiling, Coelastrum sphaericum Naegeli and
Pediastrum boryanum (Turpin) Meneghini) at exponential growth were chosen as the target for PSII inhibition experiments. The culture densities at the start of the experiments were 2.2 · 106, 5.9 · 106 and 1.1 · 106 cell.mL-1, respectively,
for Tetrallantos lagerheimii, Coelastrum sphaericum and
Pediastrum boryanum. Biovolume and superficial area of each species were obtained by stereometric calculations according to Rott (1981) and the surface:volume (S:V) ratios were calculated.
The experiments were performed by fractioning a single target culture in 12 erlenmeyers flasks (125 mL capacity). All treatments were performed in triplicate and each flask received 19.8 mL of the cultures. We conducted the inhibition experiments by exposing the species at exponential growth to different concentrations of the herbicide DCMU (3(3,4-dichlorophenyl)-1,1-dimethylurea), a specific inhibitor of PSII. For this purpose, control Erlenmeyer flasks received 0.2 mL of distilled water and the treatments received the same volume of DCMU at different concentration, producing a final experimental concentration of 0.1, 1.0 and 10.0 µmol.L-1. The
flasks were maintained under 110 µmol photon · m-2 · s-1
during 2 minutes, when photosynthetic parameters (Φ’M, ETR
and ΦM) were measured.
Fluorescence measurements: We investigated
cells under low pressure (<30 cmHg) to avoid additional stress (Juneau et al., 2002). Filters were then placed for 10s over a paper dampened in WC medium to prevent osmotic stress and cell dessication. The dampened filter was cut into two pieces that were gently wrapped in a thin layer of a PVC film. One piece was immediately placed in the leaf-clip holder at a distance of 7 mm from the fiberoptic light source in ambient light conditions for measurement of Φ’M and ETR. We
measured the photosynthetic performance under increasing actinic irradiance (9 PAR intensities between 0 and 900 µmol photons · m-2· s-1). Each PAR lasted 30s and, after the
recording of F’, a saturation pulse (0.8s at 6.000 µmol · m-2·
s-1) was applied to determine F’
m. The φ’M was then calculated
at those 9 light levels and the relative PSII electron transport rate (ETR) was calculated as Φ’M· PAR · 0.5.
The other half of filter was maintained in fully dark conditions for 20 minutes, when the potential quantum yield (ΦM)was
measured. With this parameter, the relative response (R) to the treatments was calculated as a percentage of inhibition as:
R= (r0- r/ r0) · 100
where r0 is the measured response of non-treated algae
taken as a control and r is the response of treated algae.
Statistical methods: Since Φ’M values are strongly related
to ETR, we performed statistical analyses just on the latter. The effect of DCMU on the electron transport rate between PSII and PSI was analyzed using nonlinear mixed effects modelling, permitting to compare different sections (α, ETRmax and β) of
the obtained curves (for details see Figueredo et al., 2007). The effect of DCMU on the potential quantum yield (ΦM) for
dark-adapted filters was analyzed statistically by a Kruskal-Wallis test, given that no homogeneity was observed in the variances of these data (Brown-Forsythe test). When significant differences were observed, a Tukey test was applied to verify the differences among control and treatments.
resUlts
There were evident inhibitory effects of DCMU on all parameters measured and PAM fluorometry was able to detect differences among treatments.
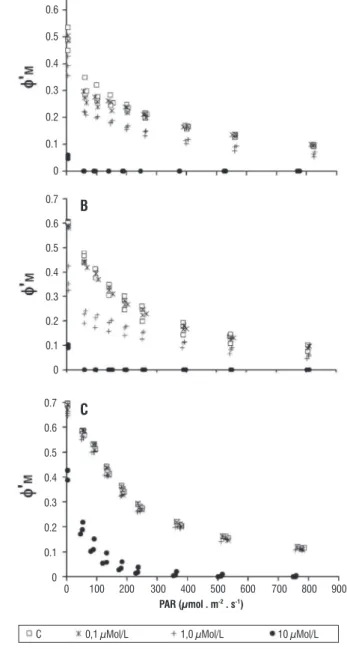
For all species,Φ’M was a sensitive parameter, which
was completely inhibited (Φ’M = 0) by DCMU concentration
of 10.0 µmol · L-1 (Figure 1). The DCMU inhibitory effects
were more intense on T. lagerheimii and C. sphaericum, which had their Φ’M decreased by 1.0 µmol · L-1 and were
completely inhibited by 10.0 µmol · L-1 of DCMU, even at very
low light intensity (Figure 1 A and B). P. boryanum was the most resistant species. Concentrations of 1.0 µmol · L-1 did
not affect it and 10.0 µmol · L-1 reduced its Φ’
M records to 0
just for light intensities higher than 350 µmol · m-2 · s-1 (Figure
1C). The trends described above were statistically confirmed by ETR data, which are related to the Φ’M values.
0.7
0.6
0.5
0.4
0.3
0.2
0.1
0
a
0.7
0.6
0.5
0.4
0.3
0.2
0.1
0
b
0.7
0.6
0.5
0.4
0.3
0.2
0.1
0
c
0 100 200 300 400 500 600 700 800 900
C 0,1 µMol/L 1,0 µMol/L 10 µMol/L par (µmol . m-2 . s-1)
figure 1 – Effective quantum yield curves of control (C, with no DCMU addition) and treatments at different concentrations of DCMU (0.1, 1.0 and
10.0 µmol · L-1). A = Tetrallanthos largeheimii, B = Coelastrum sphaericum,
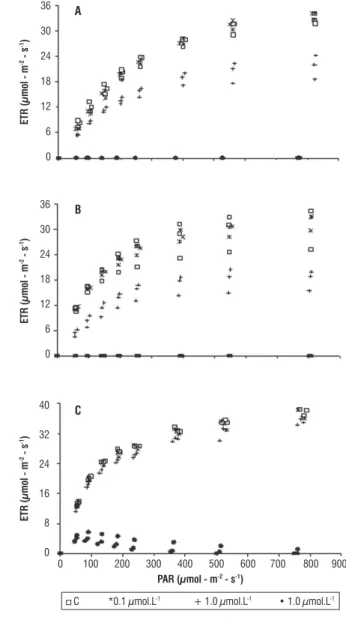
ETR saturation curves, in response to increasing DCMU concentrations, showed very similar trends for Tetrallantos lagerheimii and Coelastrum sphaericum (Figure 2). For both species, a DCMU concentration of 0.1 µmol · L-1 did not
show any inhibition and no differences were observed among treatment and control parameters (Figure 2 A and B, Tables 1 and 2). When the two species were submitted to higher DCMU concentration (1.0 µmol · L-1), statistically significant
differences of α and ETR maximum relative to the control were detected (Tables 1 and 2). Under this DCMU concentration the ETR curve exhibited a lower plateau with an inhibitory effect of ca. 40% (Figure 2 A and B). Furthermore, ETR saturation was observed at lower light levels for this treatment (ca. 300 µmol photon· m-2· s-1) when compared to the control (ca. 500 µmol
photon · m-2 · s-1) (Figure 2 A and B). DCMU concentrations
of 10.0 µmol · L-1 completely blocked the electron flux among
PSII and PSI in both T. lagerheimii and C. sphaericum (Figure 2 A and B, Tables 1 and 2).
table 1 – Response of Tetrallantos largeheimii to the addition of different
concentrations of DCMU. The significance of treatment effects was assessed using likelihood ratio tests (Global Test) and t-test comparisons between
treatments and control. Units as follows: ETR (µmol electrons · m-2 · s-1); α
(µmol electrons per µmol PAR photons).
treatment etrmax p-value α p-value
C 33.5 0.15
0.1 31.6 0.16 0.14 0.07
1.0 22.1 < 0.0001a 0.11 < 0.0001 a
10.0 0 < 0.0001a 0 < 0.0001 a
a Significant differences at P < 0.05 (Global test and t-test).
table 2 – Response of Coelastrum sphaericum to the addition of different
concentrations of DCMU. The significance of treatment effects was assessed using likelihood ratio tests (Global Test) and t-test comparisons between
treatments and control. Units as follows: ETR (µmol electrons · m-2 · s-1); α
(µmol electrons per µmol PAR photons).
treatment etrmax p-value α p-value
C 30.4 0.22
0.1 29.9 0.82 0.21 0.17
1.0 18.5 < 0.0001 a 0.12 < 0.0001 a
10.0 0 < 0.0001 a 0 < 0.0001 a
a Significant differences at P < 0.05 (Global test and t-test). Pediastrum boryanum was clearly the most resistant species to the herbicide DCMU. For this species, α values were never different between treatments and control. Furthermore, this chlorophyte was not affected by DCMU concentrations of 0.1 µmol · L-1, which did not produce ETR values statistically
different from the control, with no herbicide (Figure 2C, Table 3). Difference between the control and the 1.0 µmol · L-1 treatment
were significant for ETRmax (Table 3), but the inhibitory effect was
small (ca. 10%). In the control and the 0.1 and 1.0 µmol · L-1
DCMU treatments, ETR saturation occurred at light levels higher than 350 µmol · photon · m-2 · s-1 (Figure 2C). Different from
the other species, P. boryanum was able to maintain electron transport among photosystems even when submitted to higher DCMU concentration (10.0 µmol · L-1). At this concentration,
the electron flux was completely blocked just when light levels were higher than 500 µmol · photon · m-2· s-1 (Figure 2C).
36
30
24
18
12
6
0
a
36
30
24
18
12
6
0
b
40
32
24
16
8
0
c
0 100 200 300 400 500 600 700 800 900
C *0.1 µmol.L-1 + 1.0 µmol.L-1 • 1.0 µmol.L-1 par (µmol - m-2 - s-1)
etr (µmol - m
-2 - s -1)
etr (µmol - m
-2 - s -1)
etr (µmol - m
-2 - s -1)
figure 2 – Electron transport rate curves of control (C, with no DCMU addition) and treatments at different concentrations of DCMU (0.1, 1.0 and
10.0 µmol · L-1). A = Tetrallanthos largeheimii, B = Coelastrum sphaericum,
table 3 – Response of Pediastrum boryanum to the addition of different concentrations of DCMU. The significance of treatment effects was assessed using likelihood ratio tests (Global Test) and t-test comparisons between
treatments and control. Units as follows: ETR (µmol electrons · m-2 · s-1); β
(µmol electrons per µmol PAR photons). Since. α values (µmol electrons per
µmol PAR photons) were not different among treatments and control, they were not represented in this table.
treatment etrmax p-value β p-value
C 34.8 0
0.1 34.0 0.23 0
1.0 31.5 < 0.0001 a 0
10.0 3.9 < 0.0001 a -0.0055 < 0.0001 a
a Significant differences at P < 0.05 (Global test and t-test).
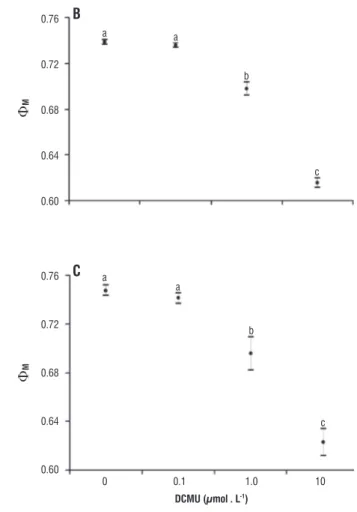
The potential quantum yield (ΦM) responses to
increasing DCMU concentrations were similar among the three chlorophytes (Figure 3). This parameter showed no changes at a DCMU concentration of 0.1 µmol · L-1. On
the otherhand, concentrations higher than 1.0 µmol. L-1
resulted in a statistically significant inhibition of ΦM. The
effects were significantly higher for DCMU concentration of 10.0 µmol · L-1. Although these general trends were similar
for all species, absolute values were always lower for T. lagerheimii and comparable absolute values of ΦM in the
control and treatments were found just for C. sphaericum and
P. boryanum. Furthermore, T. largeheimii was more strongly inhibited by DCMU (Table 4). While both C. sphaericum and P. boryanum had aΦM decrease of 6 and 17%, respectively for
DCMU concentrations of 1.0 and 10.0 µmol · L-1, T. lagerheimii
was more sensitive and showed reductions of 12.5 and 36% (Table 4).
0.70
0.60
0.50
0.40
a a
a
b
c
ΦM
0.76
0.72
0.68
0.64
0.60
b
ΦM
a a
b
c
0.76
0.72
0.68
0.64
0.60
c
ΦM
0 0.1 1.0 10
DcMU (µmol . l-1)
a
a
b
c
figure 3 – Potential quantum yield (mean and standard deviation) of control (C, with no DCMU addition) and treatments at different concentrations of
DCMU (0.1, 1.0 and 10.0 µmol · L-1).
Small letters in each graphic correspond to the result of the Tukey test, where the same letter indicates no significative differences (p > 0.05) and different letters indicates significative differences (p < 0.05). A = Tetrallanthos largeheimii, B =
Coelastrum sphaericum, C = Pediastrum boryanum.
table 4 – Percent inhibition of the potential quantum yield (means (standard deviation) of R-values).
DcMU (µmol . l-1) T. lagerheimii C. sphaericum P. boryanum
0.1 4.19 (2.19) 0.36 (0.51) 0.84 (1.11)
1.0 12.50 (1.84) a 5.50 (0.89) a 6.95 (2.19) a
10.0 36.05 (1.16) a 16.65 (0.32) a 16.68 (1.18) a
DiscUssion
The results indicated that the method was able to produce reliable fluorescence measurements of the photosynthetic capacity of phytoplanktonic species. The patterns observed in the Φ’M and ETR responses were very similar to those
described in the literature for natural leaves leading to the conclusion that filters containing microalgal cells could be used as “artificial leaves”. Results were consistent, since the recorded values were very similar in all triplicates for each treatment. Differences among treatments and control could be detected and, as expected, increased at higher DCMU concentrations. Higher concentrations of DCMU (1.0 and 10.0 µmol · L-1) affected PSII in all three species, since ETR values
were much lower at these two concentrations than in the control. Thus, PAM fluorometry appears to be an efficient non-invasive tool to detect changes in photosynthetic activity of microphytoplankton cultures and may be a trustworthy way to study phytoplankton responses to environmental conditions or to stressing factors.Juneau and Popovic (1999), for example, used PAM fluorimetry to study toxic effects of different agents on phytoplankton photosynthesis. However, we recommend using this methodology just for unialgal cultures because photosynhetic responses showed different patterns and intensities even for related genera. Villareal (2004) also found different fluorescence responses in two diatoms genera (Ethmodiscus and Phaeodactylum Bohin) suggesting that these results emerged from differences in their taxonomy or in their light adaptation history. In another study, Macedo et al. (2008) showed that the toxicity of the herbicide bentazon on phytoplankton was also species-specific. Although field samples responses were not the scope of this study, we reinforce the necessity to carefully evaluate field fluorescence data due the complexe composition of the phytoplankton community in natural systems and the consequent different outcomes from its individual components.
The inhibitory effects were evaluated throughout the measured parameters as a relative decrease in photosynthesis and showed that different species of the order Chlorococcales (Chlorophyta) were differently sensitive to DCMU. Podola and Melkonian (2003) also reported that a methanol-induced inhibition of photosynthesis was clearly not the same among different algal species or strains. Juneau et al. (2001, 2002) observed that the sensitivity of algal species to mercury, cupper and to the herbicide metolachlor also varied largely,
according to the used species and toxicants. These authors suggested that morphological features might affect the algal sensibility to chemical substances. In our study, variation in morphology could explain, at least partially, the different responses in the ETR curves recorded. Although all species studied have typically a colonial organization in nature, just
P. boryanum maintained its colonial form in our culture conditions, while C. sphaericum and T. lagerheimii grew mainly unicellular. The relative cell surface exposed to DCMU was lower in P. boryanum, once the cells of this species are strongly bound into colonies. This fact was confirmed by the different surface:volume ratios of the studied species. While P. boryanum had a S:V ratio of 0.3 (±0.1), C. sphaericum and T. lagerheimii showed S:V ratios of 1.3 (±0.3) and 1.7 (±0.5), respectively. Therefore, considering just this morphological aspect, the relative exposition to toxicants could be about 5 times lower in P. boryanum than in the other two chlorophytes. However, morphology could just partially explain the results on potential quantum yield. This parameter showed the same trend of sensivity for P. boryanum and C. sphaericum, both being more resistant than T. lagerheimii. Since T. largeheimii presented the highest S:V ratio, we could expect its lower resistance, however similar trends of sensitivity for P. boryanum and C. sphaericum appear not be related to the morphological characteristics of these two species. Thus, beyond morphology, probably physiology and historic aspects of the cultures or of the natural populations may also affect fluorescence results. Diverse responses in fluorescence among species or among higher taxonomical groups were observed in other studies. Alpine and Cloern (1985) indicated, for example, that changes in light conditions of the growth environment (light life history) could affect the physiology and, hence, the fluorescence yield of the phytoplankton.
1998). In fact, even for the same species, cell age and light intensity during life cycle may influence the photochemical metabolism of the cultures (Heinze et al., 1996, Nash and Quayle, 2007). However, we showed that it is possible to compare the response to treatments as relative values of just one species, with excellent results. Furthermore, when using PAM fluorometry the choice of the best parameter to describe the response is also important. Juneau et al. (2001, 2002) considered the operational PSII quantum yield (Φ’M) as a
useful parameter for plant and phytoplankton bioassays. From our results, it appears that Φ’M and ETR were both sensitive
parameters for measuring the toxic effect of DCMU on algae. The potential quantum yield (ΦM) could also be used but with
lower sensivity, once ΦM values suffered less reduction and
very low values, as the 0 values recorded for Φ’M, were not
observed.
Acknowledgements: we wish to thank D.F. Bird for the development of the statistical non-linear method used to analyze the ETR curves. This study was supported by a fellowship to C.C.F. from CAPES (Coordenação de Aperfeiçoamento do Pessoal Docente, Brazil).
references
Alpine AE, Cloern JE (1985) Differences in in vivo fluorescence yield between
three phytoplankton size classes. J. Plankton Res. 7:381-390.
Dorigo U, Leboulanger C (2001) A pulse-amplitude modulated fluorescence-based method for assessing the effects of photosystem II herbicides on freshwater periphyton. J. appl. Phycol. 13:509-515.
Figueredo CC, Giani A, Bird DF (2007) Does allelopathy contribute to
Cylindrospermopsis raciborskii (cyanobacteria) bloom occurrence and geographic expansion? J. Phycol. 43:256-265.
Genty B, Briantais JM, Baker NR (1989) The relationship between the quantum yield of photosynthetic electron transport and quenching of chlorophyll fluorescence. Biochim. Biophys. Acta 990:87-92.
Guillard RR, Lorenzen CJ (1972) yellow-green algae with chlorophyllidae C1,2. J. Phycol. 8:10-14.
Heinze I, Dau H, Senger H (1996) The relation between the photochemical yield
and variable fluorescence of photosystem II in the green alga Scenedesmus
obliquus. J. Photochem. Photobiol. B Biol. 32:89-95.
Juneau P, Popovic R (1999) Evidence for the rapid phytotoxicity and environmental stress evaluation using the PAM fluorometric method: importance and future application. Ecotoxicology 8:449-455.
Juneau P, Dewez D, Matsui S, Kim SG, Popovic R (2001) Evaluation of different algal species sensitivity to mercury and metolachlor by PAM-fluorometry.
Chemosphere45:589-598.
Juneau P, El Berdey A, Popovic R (2002) PAM-fluorometry in the determination
of the sensitivity of Chlorella vulgaris, Selenastrum capricornutum and
Chlamydomonas reinhardtii to copper. Arch. Environ. Contam. Toxicol. 42:155-164.
Krause GH, Weis E (1991) Chlorophyll fluorescence and photosynthesis: the basics. Annu. Rev. Plant Physiol. Plant. Mol. Biol. 42:313–349.
Lu C, Vonshak A (1999) Photoinhibition in outdoor Spirulina platensis cultures
assessed by polyphasic chlorophyll fluorescence transients. J. Appl. Phycol. 11:355-359.
Macedo RS, Lombardi AT, Omachi Cy, Rörig LR (2008) Effects of the herbicide bentazon on growth and photosystem II maximum quantum yield of
the marine diatom Skeletonema costatum. Toxicol. In Vitro. 22:716-722.
Nash SMB, Quayle PA (2007) Biomaterial culture conditions impacting the performance of a PAM fluorometry based aquatic phytotoxicity assay. Biosens. Bioelectron. 23:276-280.
Parkhill JP, Maillet G, Cullen JJ (2001) Fluorescence-based maximal quantum yield for PSII as a diagnostic of nutrients stress. J. Phycol. 37:517-529. Podola B, Melkonian M (2003) A long-term operating algal biosensor for the rapid detection of volatile toxic compounds. J. Appl. Phycol. 15:415-424. Rott E (1981) Some results from phytoplankton counting intercalibrations. Schweiz. Z. Hydrol. 43:34-62.
Schreiber U (1986) Detection of rapid induction kinetics with a new type of high- frequence modulated chlorophyll fluorometer. Photosynth. Res. 9:261-272.
Schreiber U, Bilger W (1987) Rapid assessment of stress effects on plant leaves by chlorophyll fluorescence measurements. In: Tenhunen J, Catarino FM, Lange OL, Oechel WC (eds), Plant Response Stress, pp. 27-56. Springer-Verlag, Berlin.
Schreiber U, Hormann H, Neubauer C, Klughammer C (1995) Assessment of photosystem II photochemical quantum yield by chlorophyll fluorescence quenching analysis. Aust. J. Plant Physiol. 22:209-220.
Schreiber U, Gademann R, Ralph PJ, Larkum, AWD (1997) Assessment of
photosynthetic performance of Prochloron in Lissoclinum patella in hospite
by chlorophyll fluorescence measurements. Plant Cell Physiol. 38:945-951. Schreiber U (2003) In vivo chlorophyll fluorescence: assessment and analysis of photosynthesis function. In: Larcher W (ed), Physiological plant ecology: ecophysiology and stress physiology of functional groups. 513p. Springer, Berlin.
Silva J, Santos R, Serôdio J, Melo RA (1998) Light response curves for
Gelidium sesquipedale from different depths, determined by two methods: O2
evolution and chlorophyll fluorescence. J. Appl. Phycol. 10:295-301. Villareal TA (2004) Single-cell pulse amplitude modulation fluorescence
measurements of the giant diatom Ethmodiscus (Bacillariophyceae). J.
Phycol. 40:1052-1061.
Walker DA, Sivak MN, Prinsley RT, Cheeseborough JK (1983) Simultaneous measurements of oscillations in oxygen evolution and chlorophyll fluorescence in leaf pieces. Plant Physiol. 73:542-549.
Wilhelm C, Becker A, Toepel J, Vieler A, Rautenberger R (2004)
Photophysiology and primary production of phytoplankton in freshwater.