Relationship between birth weight and overweight/obesity
among students in Florianópolis, Santa Catarina, Brazil:
a retrospective cohort study
Relação entre peso ao nascer e sobrepeso/obesidade em estudantes de
Florianópolis, Santa Catarina, Brasil: estudo de coorte retrospectivo
Camila Elizandra Rossi
I, Francisco de Assis Guedes de Vasconcelos
IIUniversidade Federal de Santa Catarina (UFSC), Florianópolis, Santa Catarina, Brazil
ABSTRACT
CONTEXT AND OBJECTIVE: Being born heavier than 4 kg is associated with current overweight and obesity over the long term. The objective here was to ascertain whether birth weight was related to overweight or obese status, among 7 to 14-year-old schoolchildren, taking into consideration the possible interactions between socioeconomic factors and other biological variables.
DESIGN AND SETTING: Retrospective cohort study on a probabilistic sample of 2,696 children and ado-lescents living in Florianópolis, Santa Catarina, Brazil.
METHODS: The following data were collected: anthropometric (student’s weight, height and age; and parents’ weight and height), socioeconomic (family income, number of people in house and parental schooling level), birth weight and gestational age. Overweight and obesity were classiied using percen-tiles of body mass index and triceps and subscapular skinfolds. The outcome variables were overweight and obesity and the main explanatory variables were birth weight and birth weight according to gesta-tional age. The control variables were the parents’ nutrigesta-tional status, their schooling level and the per capita
family income. Poisson multivariate regressions were carried out.
RESULTS: Higher prevalence of high birth weight was observed among overweight male adoles-cents (PR = 1.14; 95% CI = 1.02-1.27; P = 0.03), but this was not observed among obese male ado-lescents. Low birth weight and being born small for gestational age were also not associated with the outcomes. Among overweight and obese children, birth weight was not significantly different from that of normal-weight children.
CONCLUSION: No signiicant association between birth weight and obesity was observed. However, there was a weak but signiicant association between high birth weight and overweight, among male adolescents.
RESUMO
CONTEXTO E OBJETIVO: Nascer com peso > 4 kg se associa a sobrepeso e/ou obesidade em longo prazo. O objetivo foi veriicar se o peso ao nascer foi um fator relacionado ao estado de sobrepeso ou obesidade atuais, em escolares de 7-14 anos, levando em consideração interações possíveis com fatores socioeconô-micos e outras variáveis biológicas.
TIPO DE ESTUDO E LOCAL: Estudo coorte retrospectivo numa amostra probabilística de 2.696 crianças e adolescentes residentes em Florianópolis, Santa Catarina, Brasil.
MÉTODOS: Coletaram-se dados antropométricos (peso, estatura e idade dos escolares, peso e estatura dos pais), socioeconômicos (renda familiar, número de pessoas na casa, escolaridade dos pais) e de peso ao nascer e idade gestacional. Sobrepeso e obesidade foram deinidos utilizando-se os percentis de índice de massa corporal e as dobras cutâneas tricipital e subescapular. Sobrepeso e obesidade foram desfechos, e peso ao nascer e peso ao nascer/por idade gestacional foram variáveis explanatórias principais. As vari-áveis de controle foram: estado nutricional dos pais, seu nível de escolaridade e renda familiar per capita. Foram realizadas regressões de Poisson.
RESULTADOS: Nos adolescentes do sexo masculino com sobrepeso, houve maior prevalência de elevado peso ao nascer (RP = 1,14; 95% IC = 1,02-1,27; P = 0,03). Naqueles com obesidade, não foi observado o mes-mo. Baixo peso ao nascer e nascer pequeno para a idade gestacional também não se associaram aos desfe-chos. Nas crianças com sobrepeso ou obesidade, o peso ao nascer não diferiu daquele entre as eutróicas.
CONCLUSÃO: Não se observou associação signiicativa entre peso ao nascer e obesidade. Porém, houve associação signiicativa, ainda que fraca, entre elevado peso ao nascer e sobrepeso, nos adolescentes do sexo masculino.
IMSc. Assistant Professor, Undergraduate Nutrition
Course, Universidade Federal da Fronteira Sul (UFFS), Chapecó, Santa Catarina, Brazil.
IIPhD. Titular Professor, Undergraduate
Nutrition Course, Department of Public Health, Universidade Federal de Santa Catarina (UFSC), Florianópolis, Santa Catarina, Brazil.
KEY WORDS: Child. Adolescent. Birth weight. Overweight. Obesity.
PALAVRAS-CHAVE: Criança.
INTRODUCTION
Among the factors associated with obesity, signiicant attention has been given to birth weight. High birth weight (HBW),
espe-cially greater than or equal to 4 kg,1 has been correlated with
overweight and/or obesity over the long term, in epidemiological
studies.2-5 Particularly in developed countries, HBW is the main
risk factor for obesity among children and adolescents whose mothers were afected by gestational diabetes mellitus, because
of the elevated number of adipose cells acquired by the infant.6
However, other factors may overlap the association between birth weight and overweight/obesity, such as the mother’s body
mass index (BMI),7 both the mother’s and the father’s BMI,8
family income3,8 and the type of school attended, with regard to
developing countries.9 hese factors may reduce the importance
of the birth weight variable in multivariate analysis.3 Systematic
reviews have shown that correlations between birth weight and overweight/obesity among children not only have presented con-tradictory results, but also have difered regarding the meth-ods used. hus, these reviews have demonstrated that research on this subject needs to be conducted with the proper method-ological rigor, in order to identify factors that might reduce the efect of birth weight on overweight or obesity among children
and adolescents.10,11
Because of the contradictions in these studies, it is impor-tant to clarify the association between birth weight and over-weight/obesity, so as to determine the stage of life at which this relationship irst appears. Longitudinal studies have revealed
these associations in adulthood.12,13
A study conducted in the city of Florianópolis in the year
2002 by de Assis et al.14, among children aged 7-9 years, found
that the prevalence of overweight (including obesity) was 22.1%,
in accordance with the criteria of Cole et al.15 Data from this city’s
live births registry, obtained in 2005, showed that the prevalence of low birth weight (LBW) among live births in Florianópolis was
8.3%.16 hese proportions are similar to those found in developed
countries, where an increase in HBW has been observed with a
simultaneous decrease in LBW.17,18 Florianópolis was classiied as
the fourth highest city in Brazil in terms of human development
in 2000 and the third city in 2013.19,20 hus, the importance of
the present study lies in the fact that in Florianópolis, elevated HBW prevalence that could be correlated with high rates of over-weight and obesity would be expected.
OBJECTIVE
he purpose of this study was to investigate whether overweight and obese children and adolescents aged 7 to 14 years living in Florianópolis, Santa Catarina, southern Brazil, were born with low or high birth weight, taking into consideration the possible interactions between socioeconomic factors and other biologi-cal variables.
METHOD
Design, setting and ethics
his study was conducted on a retrospective cohort from the year 2007. An assessment was made on a probabilistic sam-ple of schoolchildren aged 7 to 14 years who were enrolled in public and private elementary schools in Florianópolis, Santa Catarina, southern Brazil. he schoolchildren in this investiga-tion were included ater obtaining consent from their parents or legal guardians, who signed a free and informed consent state-ment. his study had previously been approved by the Ethics Committee for Human Research of the Federal University of Santa Catarina (Universidade Federal de Santa Catarina, UFSC) through project number 028/06.
Sample
he sampling was divided into two stages. Firstly, the 221 schools in Florianópolis were listed according to their geographical loca-tion in the city (north, south, east, center or mainland) and their kind of institution (public or private). he number of schools selected in each of the four geographical areas was deined tak-ing into account: the proportion of schools in each area com-pared to the totality of schools in the city and the proportion of private and public institutions in each geographical area, total-izing 17 schools (11 public and 6 private). he selection of the 17 schools was made randomly, by simple draw, but taking into account the previous list (stratiied selection by geographical area and kind of school). Subsequently, students in each school were selected taking into consideration the ratios of schoolchildren registered in the 2004 school census in Florianópolis (53,595 indi-viduals) in the following categories: geographical location of the student’s home, kind of school, gender and age group.
Sample size was calculated taking the prevalence of over-weight (including obesity) among children aged 7 to 9.9 years
to be 10%,21 and 17% for adolescents aged 10 to 14 years,22 with
95% conidence levels and a two-tailed sampling error of 2%. he design efect was estimated to be 1.3 and the power was taken to be 80%. his calculation resulted in a requirement for a sample size of 1,100 children aged 7 to 9.9 years and 700 adoles-cents aged 10 to 14.99 years. In addition, all the children who had
participated in a previous study conducted in 2002,14 and who
in 2007 were adolescents enrolled in these randomly selected schools were also included. It was possible to locate 30% of all the students who had participated in the previous study in these ran-domly selected schools.
over (n = 16) were excluded, as were those for whom no valid data for weight (n = 2) or birth weight (n = 131) was available. hus, the inal sample investigated comprised 2,696 students (857 children and 1,839 adolescents), i.e. 94% of the total.
Data collection
Biological data (gender, age, birth weight, gestational age, weight, height, and subscapular and triceps skinfolds of the schoolchil-dren; and age, weight and height of their parents) and socioeco-nomic data (kind of school, i.e. public or private, family income level and parental educational level) were collected.
Information relating to birth weight, gestational age, age, parents’ weight and height and socioeconomic data were collected by means of a self-administered questionnaire that was sent to the parents and legal guardians of the students.
Anthropometric data on the students were collected by
pre-viously trained anthropometry technicians,23 following a
proto-col based on the recommendations of Lohman.24,25 Weight was
assessed using a Marte electronic scale, model PP 180 (Marte Cientíica, Santa Rita do Sapucaí – MG, Brazil). with a capacity for 180 kg and precision of 100 grams. Height was measured using an AlturExata stadiometer (AlturExata, Belo Horizonte – MG, Brazil) with 1.0 millimeter precision. Skinfolds were measured using a Cescorf caliper (Cescorf Equipamentos Antropométricos, Porto Alegre - RS, Brazil) with 0.1 millimeter precision. he chil-dren and adolescents were measured without shoes and wearing light clothes.
A pilot study was conducted among subjects who were not included in the sample and, following the recommendations
from the World Health Organization,26 the intra-rater
techni-cal measurement error (TME) for skinfold (SF) measurements was calculated. he intra-rater TME showed a reliability coei-cient (R) greater than 0.95, which showed that all of the anthro-pometry technicians made skinfold measurements properly, thus
resulting in low variability in the data.23
he data were entered into EpiData 3.2 and were fully checked by the duly trained data entry team, and automatic con-sistency and amplitude checks were made.
Statistical variables and analysis
he outcome variables were overweight and obesity. Overweight
was deined as BMI ≥ 85th percentile, according to age and gender,
as proposed by Must et al.27 and as recommended by the Brazilian
Ministry of Health until the year 2008.28 Obesity was deined as
BMI ≥ 85th percentile, according to age and gender, as proposed
by Must et al.,27 along with triceps and subscapular skinfolds
in millimeters (mm) ≥ 90th percentile as proposed by Johnson
et al.29 he criteria of Must et al.27 were chosen because they are
widely used in the literature and have been recommended by the
World Health Organization.24 hese were also recommended by
the Brazilian Ministry of Health28 for evaluating nutritional
sta-tus among children and adolescents until 2008, when this study was conducted.
Birth weight and birth weight according to gestational age were the independent variables (or exposure) and were classiied as follows: a) birth weight was classiied as a single piece of data, as LBW (< 3,000 g), appropriate birth weight (ABW; between 3,000
and 3,999 g) and HBW (≥ 4,000 g);24,30 and b) birth weight was
correlated with gestational age in order to classify
schoolchil-dren as small for gestational age (SGA), i.e. below the 10th
per-centile; appropriate for gestational age (AGA), i.e. between the
10th and the 90th percentiles; and large for gestational age (LGA),
i.e. above the 90th percentile.30 he World Health Organization
classiies children as presenting insuicient birth weight if they are born weighing between 1,500 and 2,999 g and as
present-ing low birth weight if they are born weighpresent-ing 2,500 g or less.24
In our study, these categories were uniied because the number of responses was low and this could have hidden an association between the outcome and the independent variables.
he control variables analyzed were the following: age and gender of the students; their parents’ education level classiied
into three categories (< 8; 8 to 11; or ≥ 12 years of education),
based on the recommendations of the Brazilian Association for Population Studies (Associação Brasileira de Estudos
Populacionais, ABEP);31 per capita family income in quartiles (in
Brazilian money); kind of school (public or private); and paren-tal BMI. he socioeconomic variables of parenparen-tal education, per capita income and kind of school, and the parental BMI, were considered to be control variables.
he BMI of the students and their parents was obtained by dividing the weight measurement (in kg) by the square of their height (in meters). Non-elderly parents were classiied as
over-weight if their BMI was between 25 and 30 kg/m2 or obese if
their BMI was ≥ 30 kg/m2, as proposed by the World Health
Organization,24 and elderly parents were classiied as
over-weight if their BMI was ≥ 27 kg/m2, as proposed by the American
Dietetic Association.32 Both of these sets of criteria are
recom-mended by the Brazilian Ministry of Health.28
An analysis on the consistency of the database was made using the Stata version 9.0 statistical package.
A descriptive analysis was conducted to show the prevalence ratios of overweight and obesity for each independent variable, and the prevalence of LBW, HBW, SGA and LGA.
regarding the prevalences of overweight and obesity. In order to compare the prevalences of overweight and obesity for the dif-ferent categories within each variable studied, an analysis was performed using Pearson’s modiied contingency coeicient, based on chi-square statistics.
Poisson univariate analysis was used to investigate associa-tion between birth weight (independent variable) and overweight and obesity (outcomes). Multivariate analysis was performed to ascertain the extent to which the exposure variables inluenced the outcomes. Additionally, 95% conidence interval (95% CI) and P-values were estimated. he Poisson analysis model was used because for high-prevalence outcomes in cross-sectional studies (more than 10%), odds ratio estimates are said to either overesti-mate or underestioveresti-mate associations with outcomes, in comparison
with prevalence ratios.33,34
All the analysis took into consideration the efect of the
sam-pling design, through the svy command in the Stata sotware,
which is used to analyze data from complex samples. Associations
among the variables for which the P-value was ≤ 0.05 were
con-sidered to be statistically signiicant.
RESULTS
Data on 2,863 children (aged 7-9 years) and adolescents (aged 10-14 years) were collected. he proportion of the data that com-prised refusals or exclusions was 5.8%. Students less than 7 years of age (n = 18) and more than 14.9 years of age (n = 16) were excluded because these ages were outside of the study range. Invalid weight data (less than 10 kg, n = 2) and birth weight (lower than 800 grams, n = 131, and higher than 6 kg) were also excluded. Occurrences of no response or discrepant values were considered to be invalid data. hus, 2,696 students (857 children and 1,839 adolescents) were studied. In relation to the initial number calculated (3,100), this study presented a data loss rate of
13%. Table 1 describes the data on the population studied.
he LBW prevalences among the children and adolescents were respectively 8.2% and 7.8%. HBW was found in 7.4% and 7.9% of the children and adolescents, respectively. he preva-lences of children and adolescents who were born SGA were 14.4% and 13.0%, respectively. Children and adolescents who were born LGA accounted for respectively 10.2% and 12.9%.
he prevalence of overweight among the children was 31.5% and of obesity, 10.9%. Among the adolescents, the prevalence of
overweight was 21.0% and of obesity, 6.0%. Table 2 shows the
prevalences of overweight and obesity among the children accord-ing to gender and the variables investigated. In this table, it can seen that the prevalence of overweight among children was sig-niicantly higher in the following cases: boys born LGA (P = 0.02); children of both genders whose mothers were obese (P = 0.008 for boys and 0.001 for girls); and boys whose fathers were obese
(P = 0.02). he prevalence of obesity was higher among girls whose mothers were obese (P < 0.001); and among boys whose fathers were obese (P = 0.05). he other variables investigated did not demonstrate any signiicant association with overweight or obesity in children (Pearson chi-square test).
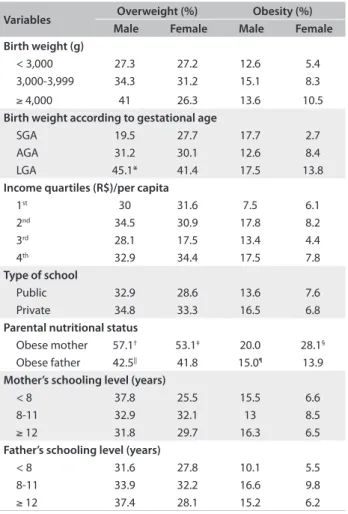
Table 3 shows the prevalences of overweight and obesity
among the adolescents (10-14 years of age). he prevalence of overweight was higher among the following: boys with HBW
(P = 0.01) and LGA (0.01); boys in the top monthly per capita
income quartile (P = 0.01); boys whose mothers (P = 0.003) and fathers (P < 0.001) were obese; girls who attended pub-lic schools (P = 0.001); and girls whose mothers (P < 0.001) or fathers (P = 0.002) were obese. he prevalence of obesity was higher among the following: adolescents with HBW (P = 0.002); LGA (P = 0.001); and those whose mothers (P < 0.001) or fathers (P = 0.03) were obese (Pearson chi-square test).
Table 1. Description of explanatory and outcome variables among the students investigated and their families. Florianópolis, Santa Catarina, 2007
Variables 7-9 years old 10-14 years old
n % n %
Gender
Male 412 48.1 866 47.1
Female 445 51.9 973 52.9
Birth weight (g)
< 3,000 242 28.2 490 26.6
3,000-3,999 552 64.4 1203 65.4
≥ 4,000 63 7.4 146 7.9
Birth weight according to gestational age
SGA* 113 13.2 217 11.8
AGA* 594 69.3 1237 63.7
LGA* 80 9.3 215 11.7
Income quartiles (R$)/per capita
1st 178 20.8 370 20.1
2nd 181 21.1 440 23.9
3rd 180 21.0 405 22.0
4th 181 21.1 387 21.0
Type of school
Public 646 75.4 1373 74.7
Private 211 24.6 466 25.3
Parental nutritional status
Obese mother 67 7.8 190 10.3
Obese father 83 9.7 189 10.3
Mother’s schooling level (years)
< 8 180 21 466 25.3
8-11 375 43.8 794 43.2
≥ 12 273 31.9 540 29.4
Father’s schooling level (years)
< 8 169 19.7 392 21.3
8-11 351 41.0 720 39.2
≥ 12 259 30.2 553 30.1
analysis (Table 2), it ceased to be correlated ater controlling for con-founding. he father’s and mother’s BMI were probably the variables that were most strongly associated with the outcomes.
Table 5 shows the prevalence ratios for obesity among
ado-lescents and their adjusted associations with birth weight. A sig-niicant association was found between birth weight and over-weight among male adolescents, for those with HBW (PR = 1.14; 95% CI = 1.02-1.27; P = 0.03). However, it needs to be noted that this association observed between HBW and overweight among male adolescents was weak, because the prevalence of overweight among the male adolescents born with high birth weight was only 1.14 times greater than the prevalence of overweight found among adolescents born with appropriate weight. Hence, birth weight does not seem to be the principal factor that determines overweight in adolescence. Birth weight and birth weight accord-ing to gestational age were not signiicantly associated with hese data show that a higher number of variables were
associated with overweight and obesity among adolescents (12) than among children (6). Among children, the biological vari-ables (birth weight for boys and parental BMI for both genders) were those that established a positive, proportional and signii-cant association with the prevalences of overweight and obesity. Among adolescents, socioeconomic variables (kind of school and family income) were also associated in addition to the biological variables. he main variable of interest (birth weight) seemed to be associated only among males.
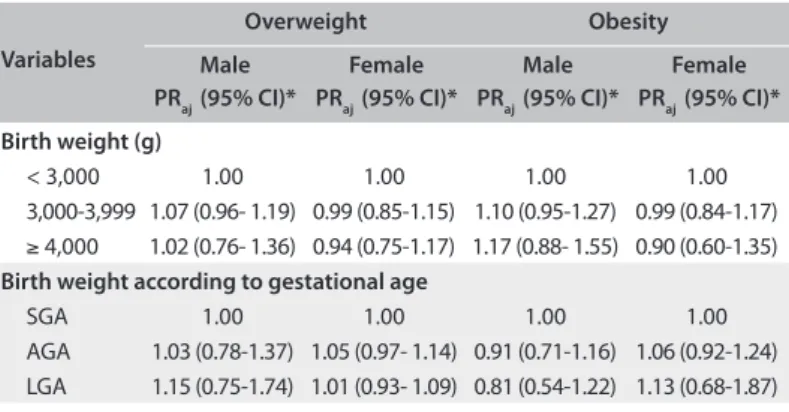
Table 4 shows the prevalence ratios in adjusted analysis on the
outcomes of overweight and obesity among children and their asso-ciations with the exposure variables. No association between birth weight and overweight or obesity was found among the children in multivariate analysis. hus, although birth weight according to gestational age was correlated with these outcomes in univariate
Variables Overweight (%) Obesity (%)
Male Female Male Female
Birth weight (g)
< 3,000 27.3 27.2 12.6 5.4
3,000-3,999 34.3 31.2 15.1 8.3
≥ 4,000 41 26.3 13.6 10.5
Birth weight according to gestational age
SGA 19.5 27.7 17.7 2.7
AGA 31.2 30.1 12.6 8.4
LGA 45.1* 41.4 17.5 13.8
Income quartiles (R$)/per capita
1st 30 31.6 7.5 6.1
2nd 34.5 30.9 17.8 8.2
3rd 28.1 17.5 13.4 4.4
4th 32.9 34.4 17.5 7.8
Type of school
Public 32.9 28.6 13.6 7.6
Private 34.8 33.3 16.5 6.8
Parental nutritional status
Obese mother 57.1† 53.1‡ 20.0 28.1§
Obese father 42.5|| 41.8 15.0¶ 13.9
Mother’s schooling level (years)
< 8 37.8 25.5 15.5 6.6
8-11 32.9 32.1 13 8.5
≥ 12 31.8 29.7 16.3 6.5
Father’s schooling level (years)
< 8 31.6 27.8 10.1 5.5
8-11 33.9 32.2 16.6 9.8
≥ 12 37.4 28.1 15.2 6.2
Table 2. Prevalence of overweight and obesity according to explanatory variables, by gender, among schoolchildren aged 7-9 years. Florianópolis, Santa Catarina, 2007
M = males, F = female, SGA = small for gestational age,
AGA = appropriate for gestational age, LGA = large for gestational age. *P = 0.02; †P = 0.008; ‡P = 0.001; §P < 0.001; ||P = 0.02; ¶P = 0.05; χ2 test.
Variables Overweight (%) Obesity (%)
Male Female Male Female
Birth weight (g)
< 3,000 21.8 13.5 7.4 1.7
3,000-3,999 26.8 16.3 8.8 3.1
≥ 4,000 37.3* 21.2 19.3† 4.2
Birth weight according to gestational age
SGA 18.1 16.4 5.1 2.1
AGA 25.6 14.4 8.2 2.7
LGA 34.7‡ 21.6 17.8§ 4||
Income quartiles (R$)/per capita
1st 18.5 17.2 7.3 1.5
2nd 26.6 17.2 10.7 3.5
3rd 25.9 16.6 10 3.7
4th 33.5¶ 15.6 10 2.7
Type of school
Public 25.4 17.3** 10.1 2.7
Private 31.4 11 8.5 2.7
Parental nutritional status
Obese mother 38.7†† 29.9‡‡ 21.5§§ 9.3||||
Obese father 41.0¶¶ 27.6*** 15.9 8.5†††
Mother’s schooling level (years)
< 8 2.8 23.4 23.4 10.5
8-11 2.7 26.8 26.8 8.8
≥ 12 3.0 29.5 29.5 10.3
Father’s schooling level (years)
< 8 2.4 22.2 22.2 8.4
8- 11 4.3 26.7 26.7 9.6
≥ 12 1.7 29.5 29.5 8.6
SGA = small for gestational age, AGA = appropriate for gestational age, LGA = large for gestational age.
*P = 0.01; †P = 0.001, ‡P = 0.001, §P = 0.001, ||P = 0.01, ¶P = 0.001, **P < 0.001, ††P = 0.003, ‡‡P < 0.001, §§P < 0.001, ||||P = 0.002, ¶¶P < 0.001, ***P = 0.003, †††P = 0.03.
obesity among adolescents. Again, other variables seem to be strongly associated with obesity, and parental BMI may have con-trolled this association.
DISCUSSION
Investigating the inluence of birth weight on overweight and obesity among children and adolescents is important, accord-ing to public health studies. his study in Florianópolis was justi-ied by the city’s high Human Development Index, which reached the fourth position in Brazil in 2000 and this index is continu-ally increasing. Currently, Florianópolis is the third city in the
country in terms of human development.19,20 Moreover, the
prev-alence of newborns who were LGA (10.2% among the children
and 12.9% among the adolescents), was similar, in 2000, to that
found in developed countries.17,18
he LBW prevalence found in this study (around 8%) is similar to that recorded in the Ministry of Health’s Live Births
Registry for the city of Florianópolis, which was 8.3% in 2005,16
and the same has been found in developing countries such as
Argentina and Mexico.35 However, it must be pointed out that
intrauterine growth restriction, which is an indication of poor nutrition during pregnancy, reached 27.4% in this study.
he prevalences of overweight and obesity found in this sur-vey (31.5% and 21% of the children and adolescents, respec-tively, were overweight and 10.9% and 6% were obese) were sim-ilar to those found in other studies on schoolchildren that used the same diagnostic criteria. For example, an assessment made
by Dutra et al.5 on 810 adolescents aged 10 to 19 years in the city
of Pelotas found that 19.3% of this population were overweight.
Monteiro et al.,3 also in Pelotas, found that 20.5% were
over-weight and 7.7% were obese, among 1,076 schoolchildren aged 14 to 16 years. Among 2,936 schoolchildren aged 7 to 10 years
assessed by de Assis et al.14 in Florianópolis in the year 2002,
10.6% were obese [BMI/age ≥ 95th percentile of Must et al.27]
Elevated proportions of overweight including obesity also were found among preschool children (28.8%) in Taubaté (state of São Paulo) and of obesity among children less than two years of age
(10%) in Campinas (state of São Paulo).36,37 hese indings may
indicate that overweight and obese infants also tend to have over-weight and obesity during childhood and adolescence.
Regarding the inluence of birth weight on the prevalence of overweight in the sample investigated, a signiicant association was found in the univariate Poisson regression analysis for male adolescents who were born LGA. No association between birth weight and overweight was found among children of both gen-ders, or among female adolescents. In an analysis adjusted for the parental socioeconomic and biological variables, the most signiicant association found was between HBW and overweight among male adolescents. Additionally, associations with obe-sity were found in univariate analysis for male adolescents who were born LGA and for those with HBW. However, ater inclu-sion of parental socioeconomic variables and parental BMI in the multivariate analysis, the associations with obesity ceased to be signiicant.
Gilman et al.4 conducted a cross-sectional study on a cohort
of 7,981 children and adolescents aged 9 to 14 years in the United States and found that the odds ratio for overweight [(BMI
≥ 85th percentile and < 95] was associated with HBW [odds ratio
(OR) = 1.2; 95% conidence interval (CI) = 1.1–1.4] in a multi-variate model adjusted for socioeconomic, biological and
behav-ioral variables. In Mexico, Moraes et al.38 conducted a
cross-sec-tional study assessing 700 children and adolescents aged 5 to
Table 5. Prevalence ratio (PR) for overweight and obesity in adjusted analysis, according to categories of explanatory variables and according to gender, among adolescents. Florianópolis, Santa Catarina, 2007
Variables
Overweight Obesity
Male PRaj (95% CI)*
Female PRaj (95% CI)*
Male PRaj (95% CI)*
Female PRaj (95% CI)*
Birth weight (g)
< 3,000 1.00 1.00 1.00 1.00
3,000-3,999 1.05 (0.92-1.20) 1.05 (0.93-1.19) 1.00 (0.94-1.06) 1.02 (0.98-1.05) ≥ 4,000 1.14 (1.02-1.27) 1.03 (0.92-1.15) 1.04 (0.98-1.10) 1.03 (0.97-1.08) Birth weight according to gestational age
SGA 1.00 1.00 1.00 1.00
AGA 1.01 (0.89-1.14) 0.93 (0.82-1.05) 0.98 (0.87- 1.11) 0.98 (0.94-1.01) LGA 0.99 (0.87-1.12) 1.01 (0.90-1.14) 1.04 (0.87- 1.25) 0.99 (0.96-1.02)
aj = adjusted; PR = prevalence ratio; SGA = small for gestational age; AGA = appropriate for gestational age; LGA = large for gestational age. *Analysis adjusted for socioeconomic variables (family income, type of school, i.e. public or private, and father’s and mother’s schooling levels) and biological variables (father’s and mother’s body mass index).
Table 4. Prevalence ratio (PR) for overweight and obesity in adjusted analysis, according to categories of explanatory variables and according to gender, among children. Florianópolis, Santa Catarina, 2007
Variables
Overweight Obesity
Male PRaj (95% CI)*
Female PRaj (95% CI)*
Male PRaj (95% CI)*
Female PRaj (95% CI)*
Birth weight (g)
< 3,000 1.00 1.00 1.00 1.00
3,000-3,999 1.07 (0.96- 1.19) 0.99 (0.85-1.15) 1.10 (0.95-1.27) 0.99 (0.84-1.17) ≥ 4,000 1.02 (0.76- 1.36) 0.94 (0.75-1.17) 1.17 (0.88- 1.55) 0.90 (0.60-1.35) Birth weight according to gestational age
SGA 1.00 1.00 1.00 1.00
AGA 1.03 (0.78-1.37) 1.05 (0.97- 1.14) 0.91 (0.71-1.16) 1.06 (0.92-1.24) LGA 1.15 (0.75-1.74) 1.01 (0.93- 1.09) 0.81 (0.54-1.22) 1.13 (0.68-1.87)
13 years and found that birth weight between 2,890 and 3,110 g
and birth weight ≥ 3,110 g were associated with overweight
according to the cutof points set by Cole et al.15 (OR = 2.85; 95%
CI = 1.49-5.47; and OR = 7.03; 95% CI = 3.53-13.99, respec-tively), in a multivariate analysis.
Monteiro et al.3 obtained similar results to those of the
pres-ent study, in a cross-sectional investigation embedded in a cohort of children born in the city of Pelotas in 1982. Using the same diagnostic criteria for overweight and obesity as used in this study, they also found through a univariate analysis that there was an association between birth weight according to gestational age and obesity (i.e. being born LGA) among adolescents aged 14 to 16 years. However, the association did not remain signiicant ater adjusting for family income and maternal BMI.
he present study showed that being born with high birth weight is a factor associated with overweight among male ado-lescents. However, this association seemed to be weakened by the variables of obesity in the mother and obesity in the father, in the multivariate analysis. In childhood, this association between birth weight and overweight/obesity was not observed. his seems biologically plausible, since there are reports in the literature showing a strong association between these
vari-ables in adulthood.39 So, even though it was not so strong,
the relationship between overweight in male adolescents and being born with high birth weight indicates that health ser-vices should promote nutritional monitoring among adoles-cents with a focus on lifestyle, in order to reduce the chances of overweight and obesity in adulthood. In addition, it is rec-ommended that epidemiologists and other researchers should investigate whether adolescents with elevated birth weight were born from mothers who presented gestational obesity or gesta-tional diabetes, because the origins of overweight may be found in intrauterine development.
In relation to birth weight and parental weight and height, it should be stressed that this information was reported by the children’s legal guardians through a self-administered questionnaire. This method was chosen in order to make it easier to collect data and administer the data collection instrument. Araújo et al. conducted a validation study on the degree of agreement between reported birth weight infor-mation and birth weight measurements made immediately after birth, among eleven-year-old adolescents who were part of a cohort in Pelotas (Rio Grande do Sul) and found a high level of agreement regarding information on low birth weight (kappa = 0.73), with disagreements of the order of -20.0 g
(standard deviation = 288.3).40 However, when stratifying
birth weight information, the authors found that reported information tended to be overestimated in the case of LBW children and underestimated in the case of HBW children.
They pointed out that the linear relationship between birth weight and BMI was more consistent when birth weight was measured immediately after birth and not so precise when birth weight was reported. Therefore, validation for birth weight measurements in a subsample is highly recommended, so as to compare the reported variable with data gathered by hospital registries or on health record cards.
In spite of these limitations, the present study had exter-nal validity, was probabilistic and had a complex sampling plan. Additionally, the researchers took care to train the anthropo-metry technicians, which resulted in reliable data. In addition to appropriate data gathering, care was taken in compiling the research data, which were fully entered and checked by a trained team, using sotware that enables data entry control. herefore, the results from this study seem not to have been inluenced by selection or measurement bias.
CONCLUSION
No significant association was found between high birth weight/being born large for gestational age and obesity after adjusting for the control variables, either among children or among adolescents. The same results were found for low birth weight and being born small for gestational age. Even though the association was not very strong, a relationship between high birth weight and overweight among male adolescents was observed.
REFERENCES
1. Wilcox AJ. On the importance - and the unimportance - of birthweight. Int JEpidemiol. 2001;30(6):1233-41.
2. Reilly JJ, Armstrong J, Dorosty AR, et al. Early life risk factors for obesity in childhood: cohort study. BMJ. 2005;330(7504):1357.
3. Monteiro PO, Victora CG, Barros FC, Monteiro LM. Birth size, early childhood growth, and adolescent obesity in a Brazilian birth cohort. Int J Obes Relat Metab Disord. 2003;27(10):1274-82.
4. Gillman MW, Rifas-Shiman S, Berkey CS, Field AE, Colditz GA. Maternal gestational diabetes, birth weight, and adolescent obesity. Pediatrics. 2003;111(3):e221-6.
5. Dutra CL, Araújo CL, Bertoldi AD. Prevalência de sobrepeso em adolescentes: um estudo de base populacional em uma cidade no Sul do Brasil [Prevalence of overweight in adolescentes: a population-based study in a southern Brazilian city]. Cad Saude Publica. 2006;22(1):151-62.
6. Parsons TJ, Power C, Manor O. Fetal and early life growth and body mass index from birth to early adulthood in 1958 British cohort: longitudinal study. BMJ. 2001;323(7325):1331-5.
between the body mass index of schoolchildren aged between 7 and 14 years and that of their parents in the city of Florianópolis, in the State of Santa Catarina, Brazil]. Rev Bras Saúde Matern Infant. 2010;10(2):183-90.
8. Gabriel CG, Corso AC, Caldeira GV, et al. Overweight and obesity related factors in schoolchildren in Santa Catarina State, Brazil. Arch Lationoam Nutr. 2010;60(4):332-9.
9. Vieira MFA, Araújo CLP, Hallal PC, et al. Estado nutricional de escolares de 1a a 4a séries do Ensino Fundamental das escolas urbanas da
cidade de Pelotas, Rio Grande do Sul, Brasil [Nutritional status of irst to fourth-grade students of urban schools in Pelotas, Rio Grande do Sul State, Brazil]. Cad Saude Publica. 2008;24(7):1667-74.
10. Martins EB, Carvalho MS. Associação entre peso ao nascer e o excesso de peso na infância: revisão sistemática [Birth weight and overweight in childhood: a systematic review]. Cad Saude Publica. 2006;22(11):2281-300.
11. Rossi CE, Vasconcelos FAG. Peso ao nascer e obesidade em crianças e adolescentes: uma revisão sistemática [Birth weight and obesity in children and adolescents: a systematic review]. Rev Bras Epidemiol. 2010;13(2):246-58.
12. Stettler N, Kumanyika SK, Katz SH, Zemel BS, Stallings VA. Rapid weight gain during infancy and obesity in young adulthood in a cohort of African Americans. Am J Clin Nutr. 2003;77(6):1374-8. 13. Te Velde SJ, Twisk JW, Van Mechelen W, Kemper HC. Birth weight,
adult body composition, and subcutaneous fat distribution. Obes Res. 2003;11(2):202-7.
14. de Assis MA, Rolland-Cachera MF, Grosseman S, et al. Obesity, overweight and thinness in schoolchildren of the city of Florianópolis, Southern Brazil. Eur J Clin Nutr. 2005;59(9):1015-21.
15. Cole TJ, Bellizi MC, Flegal KM, Dietz WH. Establishing a standard deinition for child overweight and obesity worldwide: international survey. BMJ. 2000;(320):1240-3.
16. Brasil. Ministério da Saúde. Secretaria de Vigilância em Saúde. Indicadores de morbidade e fatores de risco. Proporção de nascidos vivos com baixo peso ao nascer. Available from: http://tabnet. datasus.gov.br/cgi/tabcgi.exe?idb2006/d16.def. Accessed in 2013 (Aug 15).
17. Ananth CV, Wen SW. Trends in fetal growth among singleton gestations in the United States and Canada, 1985 through 1998. Semin Perinatol. 2002;26(4):260-7.
18. Surkan PJ, Hsieh CC, Johansson AL, Dickman PW, Cnattingius S. Reasons for increasing trends in large for gestational age births. Obstet Gynecol. 2004;104(4):720-6.
19. Programa das Nações Unidas para o Desenvolvimento (PNUD). Índice de Desenvolvimento Humano – Municipal, 1991 e 2000. Todos os municípios do Brasil. Available from: http://www.pnud.org.br/ atlas/ranking/IDH-M%2091%2000%20Ranking%20decrescente%20 (pelos%20dados%20de%202000).htm. Accessed in 2013 (Jun 25).
20. Programa das Nações Unidas para o Desenvolvimento (PNUD). Atlas do Desenvolvimento Humano no Brasil 2013. IHDM Brasil. Available from: http://www.atlasbrasil.org.br/2013destaques/. Accessed in 2013 (Aug 15).
21. Abrantes MM, Lamounier JA, Colosimo EA. Comparison of body mass index values proposed by Cole et al. (2000) and Must et al. (1991) for identifying obese children with weight-for-height index recommended by the World Health Organization. Public Health Nutr. 2003;6(3):307-11.
22. Salles RK, Kazapi IAM, Di Pietro P. Ocorrência de obesidade em adolescentes da rede de ensino do município de Florianópolis. In: Obesidade e anemia carencial na adolescência: Simpósio. São Paulo: Instituto Danone, 2000. p. 235.
23. Frainer DE, Adami F, Vasconcelos Fde A, et al. Padronização e coniabilidade das medidas antropométricas para pesquisa populacional [Standardization and reliability of anthropometric measurements for population surveys]. Arch Latinoam Nutr. 2007;57(4):335-42.
24. Physical status: the use and interpretation of anthropometry. Report of a WHO Expert Committee. World Health Organ Tech Rep Ser. 1995;854:1-452.
25. Lohman TG, Roche AF, Martorell R, eds. Anthropometric standardization reference manual. Illinois: Human Kinetics; 1988. 26. WHO Multicentre Growth Reference Study Group. Reliability of
anthropometric measurements in the WHO Multicentre Growth Reference Study. Acta Paediatr Suppl. 2006;450:38-46.
27. Must A, Dallal GE, Dietz WH. Reference data for obesity: 85th and 95th percentiles of body mass index (wt/ht2) and triceps skinfold thickness. Am J Clin Nutr. 1991;53(4):839-46.
28. Brasil. Ministério da Saúde. Secretaria de Atenção à Saúde. Departamento de Atenção Básica. Coordenação Geral da Política de Alimentação e Nutrição. Vigilância Alimentar e Nutricional (SISVAN). Orientações para a coleta e análise de dados antropométricos em serviços de saúde. Norma Técnica – SISVAN: material preliminar – fevereiro 2008. Available from: http://www.sonutricao.com.br/ downloads/sisvan_norma_tecnica_preliminar_criancas.pdf. Accessed in 2013 (Jun 25).
29. Johnson CL, Fulwood R, Abraham S, Bryner JD. Basic data on anthropometric measurements and angular measurements of the hip and knee joints for selected age groups 1-74 years of age. Vital Health Stat 11. 1981;(219):1-68.
30. Alexander GR, Kogan M, Bader D, et al. US birth weight/gestational age-speciic neonatal mortality: 1995-1997 rates for whites, hispanics, and blacks. Pediatrics. 2003;111(1):e61-6.
32. The Nutrition Screening Initiative. In: Incorporating nutrition screening and interventions into medical practice. A monograph for physicians. Washington: American Academy of Family Physicians. The American Dietetic Association. National Council on Aging Inc; 1994. 33. Vigo A. Modelando desfechos comuns: viés e precisão [Modeling
common outcomes: bias and precision]. Cad Saude Publica. 2006;22(11):2496-7, author reply 2497.
34. Barros AJ, Hirakata VN. Alternatives for logistic regression in cross-sectional studies: an empirical comparison of models that directly estimate the prevalence ratio. BMC Med Res Methodol. 2003;3:21. 35. United Nations Children’s Fund (UNICEF). Situação mundial da
infância 2006. Excluídas e invisíveis. Tabela 2: Nutrição. Available from: http://www.unicef.org/brazil/sowc06/. Accessed in 2013 (Jun 25). 36. Nascimento VG, Silva JP, Bertoli CJ, et al. Prevalence of overweight
preschool children in public day care centers: a cross-sectional study. Sao Paulo Med J. 2012;130(4):225-9.
37. Bernardi JL, Jordão RE, Barros Filho A de A. Cross-sectional study on the weight and length of infants in the interior of the state of São Paulo, Brazil: associations with sociodemographic variables and breastfeeding. Sao Paulo Med J. 2009;127(4):198-205.
38. Moraes SA, Beltrán Rosas J, Mondini L, Freitas IC. Prevalência de sobrepeso e obesidade e fatores associados em escolares de área urbana de Chilpancingo, Guerrero, México, 2004 [Prevalence of overweight and obesity, and associated factors in school children from urban area in Chilpancingo, Guerrero, Mexico, 2004]. Cad Saude Publica. 2006;22(6):1289-301.
39. Rugholm S, Baker JL, Olsen LW, et al. Stability of the association between birth weight and childhood overweight during the development of the obesity epidemic. Obes Res. 2005;13(12):2187-94.
40. Araújo CL, Dutra CL, Hallal PC. Validity of maternal report on birth weight 11 years after delivery: the 1993 Pelotas Birth Cohort Study, Rio Grande do Sul State, Brazil. Cad Saude Publica. 2007;23(10):2421-7.
Sources of funding: Research funded by the National Council for Scientiic and Technological Development (CNPq) (Procedural no. 402322/2005-3 – Call for bid MCT/CNPq/MS-SCTIE-DECIT/SAS-DAB 51/2005)
Conlict of interest:None
Date of irst submission: November 20, 2012
Last received: Setember 21, 2013
Accepted: October 8, 2013
Address for correspondence: Camila Elizandra Rossi Rua Zelindro Périco, 2.191 Caixa Postal 205
Jd. Panorâmico — Loteamento Marchese — Realeza (PR) — Brasil CEP 85770-000