in 2009 Pandemic Influenza Mortality Rates between
Countries in Europe
Georgios Nikolopoulos1,2, Pantelis Bagos2, Theodoros Lytras1, Stefanos Bonovas1*
1Hellenic Centre for Disease Control and Prevention, Athens, Greece,2Department of Computer Science and Biomedical Informatics, University of Central Greece, Lamia, Greece
Abstract
Background:Pandemic A (H1N1) 2009 mortality rates varied widely from one country to another. Our aim was to identify
potential socioeconomic determinants of pandemic mortality and explain between-country variation.
Methodology:Based on data from a total of 30 European countries, we applied random-effects Poisson regression models
to study the relationship between pandemic mortality rates (May 2009 to May 2010) and a set of representative environmental, health care-associated, economic and demographic country-level parameters. The study was completed by June 2010.
Principal Findings:Most regression approaches indicated a consistent, statistically significant inverse association between
pandemic influenza-related mortality and per capita government expenditure on health. The findings were similar in univariable [coefficient: –0.00028, 95% Confidence Interval (CI): –0.00046, –0.00010, p = 0.002] and multivariable analyses (including all covariates, coefficient: –0.00107, 95% CI: –0.00196, –0.00018, p = 0.018). The estimate was barely insignificant when the multivariable model included only significant covariates from the univariate step (coefficient: –0.00046, 95% CI: –0.00095, 0.00003, p = 0.063).
Conclusions: Our findings imply a significant inverse association between public spending on health and pandemic
influenza mortality. In an attempt to interpret the estimated coefficient (–0.00028) for the per capita government expenditure on health, we observed that a rise of 100 international dollars was associated with a reduction in the pandemic influenza mortality rate by approximately 2.8%. However, further work needs to be done to unravel the mechanisms by which reduced government spending on health may have affected the 2009 pandemic influenza mortality.
Citation:Nikolopoulos G, Bagos P, Lytras T, Bonovas S (2011) An Ecological Study of the Determinants of Differences in 2009 Pandemic Influenza Mortality Rates between Countries in Europe. PLoS ONE 6(5): e19432. doi:10.1371/journal.pone.0019432
Editor:Benjamin J. Cowling, University of Hong Kong, Hong Kong
ReceivedJanuary 17, 2011;AcceptedMarch 28, 2011;PublishedMay 11, 2011
Copyright:ß2011 Nikolopoulos et al. This is an open-access article distributed under the terms of the Creative Commons Attribution License, which permits unrestricted use, distribution, and reproduction in any medium, provided the original author and source are credited.
Funding:The authors have no support or funding to report.
Competing Interests:The authors have declared that no competing interests exist. * E-mail: [email protected]
Introduction
On 11 June 2009, two months after the first human infections with a novel A (H1N1) virus of swine origin were reported from Mexico and the USA [1], the World Health Organization formally confirmed the first pandemic of influenza for 40 years [2]. To date, one year after its emergence, the pandemic A (H1N1) 2009 virus has spread across the globe having caused at least 18,000 confirmed and notified deaths [3].
In a pandemic, infection and death rates are expected to affect countries in different ways. Poor populations do endure a disproportionate burden of disease and death [4], as demonstrated by contemporary studies after the 1918 influenza pandemic [5]. In particular, the mortality rates from the 1918 pandemic were far higher in poor countries, such as India and Iran, than in Europe and North America [6,7].
Although the 2009 influenza pandemic may be characterized as moderate in severity [2], having caused a rather small number of deaths, mortality rates were considerably higher among
indigenous populations [8,9] and varied widely from one country to another. Socioeconomic factors such as income, unemploy-ment rates, average education level, nutritional status, comor-bidities, population density and mixing rates, access to health care and quality of health system resources, as well as environmental factors may account for the observed variations in mortality rates.
The objectives of this ecological study were to identify potential, country-level, socioeconomic determinants of pandemic A (H1N1) 2009 mortality and explain between-country variation, based on data from a total of 30 countries of the European Union (EU) and the European Free Trade Area (EFTA) on which we have complete data on variables of interest.
Methods
Data collection
countries, as of week 16, 2010 (May 2009 to May 2010). These countries operated comparable surveillance systems, with similar testing procedures for the novel A (H1N1) virus and the reporting of national data at the European level was coordinated by the European Centre for Disease Control and Prevention (ECDC). All cases of pandemic influenza met the laboratory criteria for confirmation according to the EU case definition, which included confirmation by RT-PCR, viral culture or a four-fold increase in influenza specific neutralizing antibodies (European Commission Decision of 30 April 2009; Available at: http://eurlex.europa.eu/LexUriServ/LexUri Serv.do?uri = OJ:L:2009:110:0058:0059:EN:PDF).
Three representative indicators of four parameters (environ-mental, health care-related, economic and demographic), which might had affected pandemic A (H1N1) 2009 mortality, were selected. Unless stated differently, the data was taken from Eurostat, which is the statistical office of the European Union (http://epp.eurostat.ec.europa.eu). The study, including the retrieval of data from the publicly available electronic databases, was completed by June 2010.
Environmental parameters
The set of environmental variables included greenhouse-gas emissions, concentration of particulate matter and geographical latitude. Exposure to gaseous pollution has been found to affect respiratory diseases such as asthma in children or chronic obstructive pulmonary disease in adults and contribute to overall mortality [10]. Moreover, gaseous pollution might increase the risk of infections and exacerbate the inflammatory effects of viral diseases in the lower respiratory tract, especially in individuals with pre-existing airway disorders. Although the underlying pathoge-netic mechanisms are not fully understood, exposure to common gaseous pollutants affects the susceptibility to and the progression of infectious diseases through the impairment of local bronchial immunity, the modification of alveolar macrophages function and the epithelium damage [11]. To model the potential effect of gaseous pollution, we selected a variable providing total emissions, translated in carbon dioxide equivalents and reported as indices, with the base year = 100 (EU-27, Euro area 15, Cyprus and Malta base year = 1990), of four greenhouse gases (carbon dioxide, methane, nitrous oxide, sulphur hexafluoride) and two groups of gases (hydrofluorocarbons and perfluorocarbons) covered by the Protocol of Kyoto.
The second environmental indicator is a population weighted annual mean concentration of particulate matter at urban background stations in agglomerations. This variable was selected because fine particulates, i.e. particulates whose diameter is less than 10 micrometers, can reach the lungs causing inflammation and aggravating the condition of people with an underlying heart or lung disease. Long exposure to fine particulates has been associated with increased risk of worsening asthma and reduced lung function in children [12], and higher cardiopulmonary mortality [13]. Finally, in order to address the potential effects of climate factors, we also used the geographical latitude of the 30 EU and EFTA countries. The average latitude was recorded as an angular measurement in degrees, which, subsequently in the analysis, was expressed singularly with both minutes and seconds incorporated as a decimal number.
Health care resources-related parameters
Public spending on health is a core factor in determining health outcomes [14,15], especially for the poor [16], and, although not universally accepted as a powerful determinant of overall mortality, it might also influence, to some degree, the probabi-lity of death [17–19]. Therefore, the per capita government
expenditure on health, expressed in international dollars and calculated using purchasing power parities (PPPs), was extracted from the World Health Information Statistical Information System (WHOSIS). PPPs can be used as currency conversion rates to express expenditures provided in national currencies into an artificial currency, thus eliminating the effect of price level variability across countries. Commonly, the PPP exchange rate refers to the number of units of a country’s currency needed to purchase the same quantity of goods and services in local market, as a United States (US) dollar would buy in the US at a given point in time. The international dollar is, therefore, a hypothetical unit of currency used to translate and compare costs from one country to the other having as reference point the US dollar (http://www. who.int/choice/costs/ppp/en). To further assess the potential effect of the health care services infrastructure in each country, we also used the reported number of beds per 100,000 inhabitants and the share of the population who declared an unmet need for medical treatment or examination.
Economic parameters
A country’s income per capita and the inequality of income distribution might also account for differences in mortality rates across countries. In our analysis, the set of economic indicators contained the Gini coefficient, the Gross Domestic Product (GDP) per capita and the employment rate. The Gini coefficient is commonly used to quantify the degree of inequality in income distribution in a given society taking values between 0 and 1. It is usually multiplied by 100 to range between 0 and 100. Lower values of Gini coefficient are indicative of a more equal income distribution, with 0 corresponding to a society in which each member receives exactly the same income. Higher coefficients denote an unequal distribution with 1 indicating maximum inequality. Although the detrimental effects of unequal income distribution have been questioned by some researchers [20], Gini coefficients of national income inequality have been correlated with life expectancy and infant mortality rates [21,22].
Country Fatal
cases Population
Mortality (per million)
Gas
emissions1 PMemissions2 Latitude Hospitalbeds
Per capita government expenditure on health3
Share of the population with unmet health needs
Gini coeffi-cient4
Gross Domestic Product5
Employ-ment rate
Percentage of people aged.65
Age dependency ratio6
Female to male ratio
Austria 40 8 355 260 4.8 110.8 22.9 47.33 777.9 2 729 0.6 26 123 72.1 17.1 25.4 105.5
Belgium 19 10 750 000 1.8 92.9 26.0 50.83 660.1 2 264 0.5 28 115 62.4 17.1 25.8 104.2
Bulgaria 40 7 606 551 5.3 62.6 52.7 43 638.1 443 11.7 36 41 64.0 17.3 25.0 106.5
Cyprus 8 796 875 10.0 193.9 – 35 375.5 759 3.0 28 98 70.9 12.5 17.8 102.6
Czech Republic
102 10 467 542 9.7 72.5 29.8 49.75 727.3 1 309 0.3 25 80 66.6 14.6 20.5 104.2
Denmark 33 5 511 451 6.0 92.6 21.4 56 340.8 2 812 0.0 25 117 78.1 15.6 23.6 101.9
Estonia 21 1 340 415 15.7 49.6 11.1 59 557.3 734 0.9 31 62 69.8 17.2 25.3 117.2
Finland 44 5 326 314 8.3 99.7 14.3 64 673.6 1 940 0.5 26 110 71.1 16.5 24.8 104.1
France 344 64 350 759 5.3 93.6 24.1 46 700.3 2 833 1.6 28 107 64.9 16.3 25.1 106.7
Germany 254 82 002 356 3.1 77.8 21.1 51 829.1 2 548 1.6 30 116 70.7 19.9 30.0 104.1
Greece 141 11 260 402 12.5 122.8 36.8 39 473.8 1 317 4.3 33 95 61.9 18.6 27.8 101.9
Hungary 134 10 030 975 13.4 75.1 27.1 47 713.3 978 2.5 25 63 56.7 16.2 23.5 110.6
Iceland 2 319 368 6.3 142.9 11.5 65 – 2 758 1.2 27 120 83.6 11.5 17.1 96.1
Ireland 25 4 450 030 5.6 123.0 13.7 53 519.9 2 413 1.2 30 131 67.6 10.9 15.9 100.3
Italy 244 60 045 068 4.1 104.7 34.3 42.83 386.3 2 022 3.9 31 102 58.7 20.0 30.4 105.9
Latvia 34 2 261 294 15.0 44.4 23.8 57 744.5 615 6.9 38 49 68.6 17.2 24.9 116.9
Lithuania 23 3 349 872 6.9 48.9 17.4 56 816.2 728 1.8 34 53 64.3 15.8 23.0 114.8
Luxem-bourg
3 493 500 6.1 95.2 – 49.75 571.4 5 233 0.5 28 268 63.4 14.0 20.6 101.9
Malta 5 413 609 12.1 144.2 29.3 35.83 737.3 1 419 0.5 27 78 55.3 13.5 19.3 101.0
Nether-lands
62 16 485 787 3.8 97.6 25.2 52.5 481.5 2 768 0.0 28 130 77.2 14.7 21.8 102.2
Norway 29 4 799 252 6.0 108.0 18.9 62 382.3 3 780 0.2 25 177 78.0 14.6 22.1 100.8
Poland 180 38 135 876 4.7 87.3 33.4 52 642.5 636 2.7 32 56 59.2 13.5 18.9 107.0
Portugal 122 10 627 250 11.5 132.2 24.3 39.5 365.1 1 494 0.9 36 78 68.2 15.7 23.4 106.6
Romania 122 21 498 616 5.7 60.3 41.1 46 641.1 433 10.0 36 42 59.0 14.9 21.3 105.2
Slovakia 56 5 412 254 10.3 66.1 25.0 48.67 674.9 913 0.5 24 72 62.3 12.0 16.6 105.9
Slovenia 19 2 032 362 9.3 115.2 29.9 46 473.2 1 507 0.1 23 86 68.6 16.3 23.3 103.8
Spain 271 45 828 172 5.9 142.3 27.7 40 330.2 1 732 0.1 31 104 64.3 16.6 24.1 102.5
Sweden 27 9 256 347 2.9 88.3 17.6 62 287.7 2 533 0.6 24 120 74.3 17.5 26.7 101.2
Pandemic
Mortality
&
Public
Spending
on
ONE
|
www.plos
one.org
3
May
2011
|
Volume
6
|
Issue
5
country’s level of GDP per head was higher than the EU average and vice versa. As explained previously with international dollar, PPS is a common artificial currency that removes variation in price levels between countries permitting meaningful comparisons. In the analysis we also chose the employment rate as the third economic variable. Compared with other indicators, the employ-ment rate might better reflect the consequences of economic uncertainty and insecurity faced by the population. It is postulated, based on individual studies [26,27] that unemployment can contribute to mental health or addiction problems, to the adoption of unhealthy life styles, to loss of health insurance and, consequently, to poor disease management and ill health. However, during the years of economic boom, ecological studies have revealed an inverse relationship between job loss and mortality, especially for causes of death such as motor vehicle crashes, cardiovascular disease, influenza and pneumonia [24,25]. On the other hand, rapid and large rises in unemployment, a common characteristic of economic turmoil, have been linked to premature deaths from intentional violence [24,28].
Demographic parameters
The demographic parameters in the analysis consisted of the proportion of population aged.65, the old age dependency ratio, i.e. the ratio between the total number of elderly persons of an age when they are generally economically inactive (aged 65 and over) and the number of persons of working age (from 15 to 64), and the number of women per 100 men. Studies on risk factors for death among cases infected with the pandemic A (H1N1) 2009 virus have already shown different fatality rates between the various age groups [29,30]. Moreover, pandemic influenza in pregnancy was associated with increased hospitalization rates and severe illness, and has also been demonstrated to be a risk factor for death [29,30]. Therefore, we modeled the aforementioned covariates in an attempt to explore the potential effect of the population composition of the countries on the variation of mortality rates.
Statistical analysis
We used a random effects Poisson regression model to study the relationship between pandemic A (H1N1) 2009 mortality rates and a set of environmental, health care-associated, economic and demographic country-level parameters. The random effects approach was selected to account for the observed variability in the reported number of fatalities. The random effects are summarized on the basis of their estimated variances/covariances and, in this case, took the form of random intercepts for each participating country.
The following Poisson model for the number of observed deaths (mi) attributable to pandemic A (H1N1) 2009 virus was specified:
log(mi) =b0 + b1*Gas emissions + b2*Particulate matter concentration+ b3*Average country latitude+ b4*Hospital beds per 100,000 inhabitants+b5*Per capita government expenditure on health+ b6*Percentage of people with unmet health needs+ b7*Gini coefficient + b8*Gross domestic product + b9 *Employ-ment rate + b10*Percentage of people aged.65 + b11*Age dependency ratio + b12*Female to male ratio + log(Population)
+ui(1)
In equation 1, i stands for country (i = 1,…,30). In the standard random-effects model, uiis assumed to be identically distributed such that exponentiated uiis gamma with mean one and variance a, which is estimated from the data.
For model building, a stepwise backward elimination procedure was performed. Starting from the fully saturated model, we eliminated the least significant variable at each step. In the context of the multivariable analysis, we also present estimates obtained
Country Fat a l ca se s Popula tion Mortali ty (p er million) Ga s emi ss io n s 1 PM em issio n s 2 La ti tu de Ho sp ita l be ds Per capita govern m ent exp en d iture on h ealth 3 Sh a re o f th e
population with
un m e t h ealth n eed s Gin i coeffi -ci ent 4 Gr os s Domes ti c P roduct 5
Employ- ment rate Percentage of
people
aged
.
65
Age dependency ratio
6 Female to male ratio Switzer- land 18 7 7 01 856 2.3 100.5 – 47 539.3 2 598 – – 144 79.5 16.4 24.1 103.7 United Kingdom 474 6 1 595 961 7.7 81.4 2 0.4 54 341.8 2 434 0.1 34 1 16 71.5 16.1 24.3 103.7 Statistics were obtained from EUROSTAT. Data on per capita government expenditure on health was derived from the World Health Information Statistical Information System (WHOSIS). 1Total emissions in CO 2 equivalents p resented as indices, with the b ase year = 100. 2Population w eighted annual m ean concentration o f p articulate matter at urban b ackground stations in agglomerations. 3Expressed in international dollars, which are calculated u sing purchasing power p arities (PPP) (PPP -rates of currency conversion constructed to account for d ifferences in price level between countries). 4Index o f inequality of income distribution ranging from 0 (complete equality) to 100 (complete inequality). 5The index is calculated from Purchasing Power Standards (PPS) figures and expressed with respect to European Union-27 = 100. 6The ratio between the total number o f p ersons of aged 65 and o ver, and the number o f p ersons aged between 15 and 6 4. doi:10.1371/journal.pone. 0019432.t001 Table 1. Cont.
Covariates1
Univariable
analysis2 95% CI p-value
Multivariable analysis including all
covariates2 95% CI p-value
Multivariable analysis with significant covariates from univariable
analysis2 95% CI p-value
Environmental parameters
Greenhouse gas emissions3(2008) –0.00111 –0.00680, 0.00458 0.702 0.00012 –0.01090, 0.01115 0.983
Concentration of particulate matter4(2007–2008) –0.00410 –0.02596, 0.01776 0.713 –0.02156 –0.07229, 0.02918 0.405
Geographical latitude –0.00790 –0.03204, 0.01624 0.521 –0.05095 –0.09792, –0.00398 0.034
Health care resources–related parameters
Hospital beds per 100,000 inhabitants (latest available) 0.00029 –0.00092, 0.00150 0.639 –0.00038 –0.00159, 0.00082 0.532
Per capita government expenditure on health5(2006) –0.00028 –0.00046, –0.00010 0.002 –0.00107 –0.00196, –0.00018 0.018 –0.00046 –0.00095, 0.00003 0.063
Unmet need for medical examination/treatment (2008) 0.01124 –0.05621, 0.07868 0.744 0.03591 –0.08143, 0.15325 0.549
Economic parameters
Gini coefficient6(2008) 0.01428 –0.02666, 0.05522 0.494 –0.04507 –0.09437, 0.00422 0.073
Gross domestic product7per capita (2009) –0.00631 –0.01112, –0.00151 0.010 0.01732 –0.00461, 0.03925 0.122 0.00756 –0.00591, 0.02102 0.271
Employment rate (2008) –0.02227 –0.05172, 0.00718 0.138 0.04590 0.00011, 0.09170 0.049
Demographic parameters
Proportion of population aged 65 and over (2008) –0.02897 –0.12256, 0.06462 0.544 –0.49838 –1.59463, 0.59787 0.373
Old age dependency ratio8(2008) –0.02676 –0.08329, 0.02978 0.354 0.27997 –0.39016, 0.95010 0.413
Women per 100 men (2008) 0.04798 0.00960, 0.08636 0.014 0.06468 –0.00516, 0.13452 0.069 0.03154 –0.01399, 0.07706 0.175
1
Statistics were obtained from EUROSTAT. Data on per capita government expenditure on health was derived from the World Health Information Statistical Information System (WHOSIS). 2Random-effects poisson regression model.
3Total emissions in CO
2equivalents presented as indices, with the base year = 100.
4Population weighted annual mean concentration of particulate matter at urban background stations in agglomerations.
5Expressed in international dollars, which are calculated using purchasing power parities (PPP) (PPP - rates of currency conversion constructed to account for differences in price level between countries).
6Index of inequality of income distribution ranging from 0 (complete equality) to 100 (complete inequality).
7The index is calculated from Purchasing Power Standards (PPS) figures and expressed with respect to European Union-27 = 100. 8The ratio between the total number of persons of aged 65 and over, and the number of persons aged between 15 and 64.
doi:10.1371/journal.pone.0019432.t002
Pandemic
Mortality
&
Public
Spending
on
ONE
|
www.plos
one.org
5
May
2011
|
Volume
6
|
Issue
5
from the fully adjusted model and the model that includes significant covariates from the univariable step.
All regression estimates are presented along with their corresponding 95% confidence intervals (CI) and p-values. The tests of significance are two-sided. A probability level less than 0.05 was considered statistically significant. Stata 10 software was used for the statistical modeling and analysis (STATA, College Station, Texas, USA). The random-effects Poisson model was fitted via maximum likelihood using the xtpoisson command.
Results
Cumulatively, 2896 fatalities, attributed to pandemic A (H1N1) 2009 strain, were reported from the 30 EU and EFTA countries. Among the studied countries, the smallest number of deaths was reported in Iceland (n = 2) and the largest in the United Kingdom (n = 474). In terms of mortality, the highest annual incidence was observed in Estonia (15.7 cases per million population) followed by Latvia (15.0) and Hungary (13.4). Table 1 shows the number of deaths in each country, the corresponding mortality rate, and the environmental, health, economic and population characteristics of each country, which might had been associated with pandemic influenza death rate.
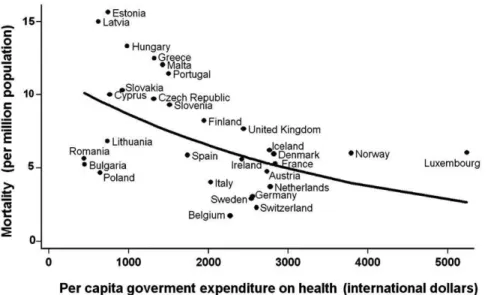
Table 2 summarizes the results of the regression modeling, which shows a consistent, statistically significant inverse association between pandemic influenza-related mortality and per capita government expenditure on health. More specifically, in the univariable analyses, the random-effects Poisson regres-sion approach provided a negative coefficient of –0.00028 for the per capita government expenditure on health (95% CI: – 0.00046, –0.00010, p-value = 0.002). Figure 1 depicts graphi-cally the association between pandemic mortality rate and public spending on health. The GDP, on per capita basis, was also inversely related to death rate (coefficient: –0.00631, 95% CI: –0.01112, –0.00151, p-value = 0.010) in univariable analy-ses. Finally, the female-to-male ratio was the third index, which was associated with mortality. The estimated coefficient describing its impact was 0.04798 (95% CI: 0.00960, 0.08636, p-value = 0.014).
Incorporating the aforementioned covariates in the same model, we noted that the per capita government expenditure on health retained its effect. The multivariable model including the three significant variables derived from univariable analyses, arrived at a coefficient of –0.00046 for public spending on health, which was marginally insignificant at the 0.05 level (95% CI: –0.00095, 0.00003, p-value = 0.063). The effect of government expenditure on health per capita was significant after adjusting for all covariates considered in the current analysis (coefficient: –0.00107, 95% CI: –0.00196, –0.00018, p-value = 0.018). In the fully adjusted model, another two variables were statistically significant: the geographical latitude (coefficient: –0.05095, 95% CI: –0.09792, –0.00398, p-value = 0.034) and the employment rate (coefficient: 0.04590, 95% CI: 0.00011, 0.09170, p-value = 0.049).
Lastly, the stepwise backward elimination procedure, which was applied to estimate the best model fitted to the data, resulted in having only one significant predictor in the model, the government expenditure on health per capita. It should be noted that, in all cases, the random-effects estimators were significantly different from the conventional Poisson estimators.
Interpreting the estimated coefficient (–0.00028) for the per capita government spending on health, we observed that a rise of 100 international dollars was associated with a reduction in the pandemic influenza mortality rate by approximately 2.8%.
Discussion
Though the 2009 influenza pandemic was considerably less lethal than originally expected, having caused a rather small number of deaths, mortality rates varied widely from one country to another. In this ecological study, we attempted to assess the potential country-level determinants of pandemic mortality and explain the between-country variation assuming reasonably that surveillance systems and reporting of fatalities were comparable among the 30 European countries. Our findings imply a significant inverse association between per capita government expenditure on health and pandemic influenza mortality. The significant association of mortality with other covariates such as the employment rate or the geographical latitude was not
Figure 1. Relation between per capita government expenditure on health and pandemic A (H1N1) 2009 mortality in 30 European countries.The superimposed line is obtained by a random-effects Poisson regression model.
doi:10.1371/journal.pone.0019432.g001
consistently observed in all models applied and valid conclusions regarding their potential effects, based solely on statistical grounds, cannot be drawn.
A previous study [31] has indicated a strong negative association between per-head income and mortality in the 1918 influenza pandemic. Interestingly, in the current study regarding the 2009 pandemic the GDP effect did not retain its significance throughout the analysis, while it appears that this time public spending on health, which is a social indicator of the degree of investment in the human capital, has a core role to explain variations in mortality. The multivariable-adjusted estimates obtained from regression analyses led to similar findings, a fact that reinforces our confidence in the validity of the observed association.
There is extensive evidence that reduced public expenditure allocations to the health sector have adverse consequences for the health of populations, which substantiates the ecological findings of this analysis. More specifically, previous research has suggested that, although economic progress, especially in low-income countries, impacts health outcomes such as under-five mortality, government spending on health is an equally important contrib-utor [15,18]. Furthermore, less public expenditure on health appeared to be a key hazard to infant survival [15,32], a finding that has also been observed in the European setting [17]. Even though not closely related to the effects of government expenditure on health, a recent study explored the potential association between levels of social spending and age standardized all cause mortality in 15 European countries and produced extremely significant findings [33]. The analysis showed that 100$increase in social welfare spending corresponded to 1.19% reduction in mortality. More interestingly, although GDP was also correlated to mortality a comparable increase in social spending produced a greater drop in death rate than a rise in GDP of similar magnitude and the estimated effect of GDP was almost cut by two thirds when it was adjusted for social spending in the constructed models. Absolute wealth or economic progress is essential for the well-being of the population but does not lead to improved health per se. It seems that the appropriate expansion of public health services and their use in a socially productive way determine the health benefits of economic growth [24]. At the present time, many European countries, being hit hard by the global economic turmoil, are far from economic expansion and face an unwanted recession phase. Governments are pressed to endorse economic programs of macroeconomic stability balancing their limited budget and raising productivity, which, finally, even though not directly recommended by the inventors of these programs, constrain country policies and, subsequently, public health spending. Some analysts argue that recession might lead to health gains. Reduced investments in health, however, have been associated with worsened health outcomes [34]. Moreover, the rapidity of economic change might itself negatively affect the health of the population [35]. Therefore, based on the results of the current study and the aforementioned evidence, national governments, in order to buffer the effects of economic shifts, need to safeguard budgetary allocations to the health sector [24] taking
also into account the emerging evidence that expenditure allocations in favor of health, contrary to what might have been expected, not only secure human lives but can also boost economic growth while reducing poverty [36].
Nevertheless, our study has at least three limitations. First, as with all cross-country analyses, the potential exists for spurious statistical correlations produced by unknown sources of confound-ing [37]. Ecological fallacies are also present if inferences about the nature of individuals are drawn based only on aggregate statistics. In other words, associations observed at the country-level might not apply at the individual members. Therefore, our findings should be interpreted with caution and further verification is needed. Second, government expenditure on health may not be the only explanation for the observed differences in pandemic mortality, but this finding offers a partial account of the ultimate correspondents of between-country variation. Third, although the analysis was restricted to European countries with, probably, comparable surveillance systems and quite similar procedures of data reporting, differences may still exist and lead to various biases. Usually, however, countries with lower government spending on health operate surveillance systems that suffer higher rates of underreporting. If such bias exists for surveillance of pandemic influenza across Europe, it would imply that the strength of the inverse association between the per capita government expenditure on health and pandemic A (H1N1) mortality, which was found in this study, might have been conservatively underestimated.
The best guides we will have for the effects on mortality of a future influenza pandemic are the studies of the previous epidemics. Therefore, in this ecological analysis, our attention was turned to the role of various country-level covariates in the pandemic A (H1N1) 2009 death rate. It can be concluded that there is a consistent and statistically significant association between per capita government expenditure on health and pandemic A (H1N1) 2009 mortality. However, this particular association is neither definite nor thoroughly clear. This analysis should be viewed within its limitations, at least, as hypothesis generating. Further work needs to be done, on individual patient databases, to unravel the mechanisms by which reduced government spending on health may have affected the 2009 pandemic influenza mortality. These may include limited access to medical care services, low quality of health system resources, inadequate numbers of health workers, underfunded influenza pandemic preparedness and ineffective public health interventions. These have long been fundamental concerns for public health, and new efforts have to be made to push them up in the global health policy agenda.
Author Contributions
Study idea: GN SB. Literature search and study design: GN SB. Data collection: GN TL. Statistical analysis: GN PB. Data interpretation: GN PB TL SB. Wrote first version of the manuscript: GN SB. Critical revision for important intellectual content: GN PB TL SB. Final approval of the version to be published: GN PB TL SB.
References
1. Dawood F, Jain S, Finelli L, Shaw M, Lindstrom S, et al. (2009) Emergence of a novel swine-origin influenza A (H1N1) virus in humans. N Engl J Med 360: 2605–2615.
2. Chan M (2009) World now at start of 2009 influenza pandemic. World Health Organization. (Available: http://www.who.int/mediacentre/news/statements/ 2009/h1n1_pandemic_phase6_20090611/en/index.html. Accessed 2010 Jun 25.). 3. World Health Organization (2010) Pandemic (H1N1) 2009 – update 101. 21. (Available: http://www.who.int/csr/don/2010_05_21/en/index.html. Ac-cessed 2010 Jun 25.).
4. Ferguson N (2006) Poverty, death, and a future influenza pandemic. Lancet 368: 2187–2188.
5. Sydenstricker E (1931) The incidence of influenza among persons of different economic status during the epidemic of 1918. Public Health Rep 46: 154–170.
6. Johnson NP, Mueller J (2002) Updating the accounts: global mortality of the 1918-1920 ‘‘Spanish’’ influenza pandemic. Bull Hist Med 76: 105–115. 7. Afkhami A (2003) Compromised constitutions: the Iranian experience with the
8. Centers for Disease Control and Prevention (2009) Deaths related to 2009 pandemic influenza A (H1N1) among American Indian/Alaska Natives – 12 states, 2009. MMWR Morb Mortal Wkly Rep 58: 1341–1344.
9. La Ruche G, Tarantola A, Barboza P, Vaillant L, Gueguen J, et al. (2009) The 2009 pandemic H1N1 influenza and indigenous populations of the Americas and the Pacific. Euro Surveill 14: pii 19366.
10. Stieb DM, Judek S, Burnett RT (2002) Meta-analysis of time-series studies of air pollution and mortality: effects of gases and particles and the influence of cause of death, age, and season. J Air Waste Manag Assoc 52: 470–484.
11. Chauhan AJ, Johnston SL (2003) Air pollution and infection in respiratory illness. Br Med Bull 68: 95–112.
12. Salvi S (2007) Health effects of ambient air pollution in children. Paediatr Respir Rev 8: 275–280.
13. Pope CA, 3rd, Burnett RT, Thun MJ, Calle EE, Krewski D, et al. (2002) Lung cancer, cardiopulmonary mortality, and long-term exposure to fine particulate air pollution. JAMA 287: 1132–1141.
14. Akinkugbe O, Mohanoe M (2009) Public health expenditure as a determinant of health status in Lesotho. Soc Work Public Health 24: 131–147.
15. Gani A (2009) Health care financing and health outcomes in Pacific Island countries. Health Policy Plan 24: 72–81.
16. Gupta S, Verhoeven M, Tiongson ER (2003) Public spending on health care and the poor. Health Econ 12: 685–696.
17. Nixon J, Ulmann P (2006) The relationship between health care expenditure and health outcomes. Evidence and caveats for a causal link. Eur J Health Econ 7: 7–18.
18. Bokhari FA, Gai Y, Gottret P (2007) Government health expenditures and health outcomes. Health Econ 16: 257–273.
19. Farahani M, Subramanian S, Canning D (2010) Effects of state-level public spending on health on the mortality probability in India. Health Econ 19: 1361–1376.
20. Lynch J, Smith GD, Hillemeier M, Shaw M, Raghunathan T, et al. (2001) Income inequality, the psychosocial environment, and health: comparisons of wealthy nations. Lancet 358: 194–200.
21. De Vogli R, Mistry R, Gnesotto R, Cornia GA (2005) Evidence from Italy and top industrialised countries. Has the relation between income inequality and life expectancy disappeared? J Epidemiol Community Health 59: 158–162.
22. Babones SJ (2008) Income inequality and population health: correlation and causality. Soc Sci Med 66: 1614–1626.
23. Tapia Granados JA, Ionides EL (2008) The reversal of the relation between economic growth and health progress: Sweden in the 19th and 20th centuries. J Health Econ 27: 544–563.
24. Bezruchka S (2009) The effect of economic recession on population health. CMAJ 181: 281–285.
25. Tapia Granados JA (2005) Increasing mortality during the expansions of the US economy, 1900-1996. Int J Epidemiol 34: 1194–1202.
26. Mathers CD, Schofield DJ (1998) The health consequences of unemployment: the evidence. Med J Aust 168: 178–182.
27. Dorling D (2009) Unemployment and health. BMJ 338: b829.
28. Stuckler D, Basu S, Suhrcke M, Coutts A, McKee M (2009) The public health effect of economic crises and alternative policy responses in Europe: an empirical analysis. Lancet 374: 315–323.
29. Pebody RG, McLean E, Zhao H, Cleary P, Bracebridge S, et al. (2010) Pandemic Influenza A (H1N1) 2009 and mortality in the United Kingdom: risk factors for death, April 2009 to March 2010. Euro Surveill 15: pii 19571. 30. Louie JK, Acosta M, Winter K, Jean C, Gavali S, et al. (2009) Factors associated
with death or hospitalization due to pandemic 2009 influenza A (H1N1) infection in California. JAMA 302: 1896–1902.
31. Murray CJ, Lopez AD, Chin B, Feehan D, Hill KH (2006) Estimation of potential global pandemic influenza mortality on the basis of vital registry data from the 1918-20 pandemic: a quantitative analysis. Lancet 368: 2211–2218. 32. Chan MF, Ng WI, Van IK (2010) Socioeconomic instability and the availability
of health resources: their effects on infant mortality rates in Macau from 1957– 2006. J Clin Nurs 19: 884–891.
33. Stuckler D, Basu S, McKee M (2010) Budget crises, health, and social welfare programmes. BMJ 340: c3311.
34. Stuckler D, King LP, Basu S (2008) International Monetary Fund programs and tuberculosis outcomes in post-communist countries. PLoS Med 5: e143. 35. Stuckler D, Basu S, Suhrcke M, McKee M (2009) The health implications of
financial crisis: a review of the evidence. Ulster Med J 78: 142–145. 36. McKee M, Suhrcke M, Nolte E, Lessof S, Figueras J, et al. (2009) Health
systems, health, and wealth: a European perspective. Lancet 373: 349–351. 37. Morgenstern H (1982) Uses of ecological analysis in epidemiologic research.
Am J Public Health 72: 127–130.