UNIVERSIDADE FEDERAL DE SÃO CARLOS
CENTRO DE CIÊNCIAS BIOLÓGICAS E DA SAÚDE
PROGRAMA DE PÓS-GRADUAÇÃO EM ECOLOGIA E RECURSOS NATURAIS
Mixotrophy in
Chlorella sorokiniana
– Physiology,
Biotechnological Potential and Ecotoxicology
ADRIANO EVANDIR MARCHELLO
UNIVERSIDADE FEDERAL DE SÃO CARLOS
CENTRO DE CIÊNCIAS BIOLÓGICAS E DA SAÚDE
PROGRAMA DE PÓS-GRADUAÇÃO EM ECOLOGIA E RECURSOS NATURAIS
ADRIANO EVANDIR MARCHELLO
Mixotrophy in
Chlorella sorokiniana
–
Physiology,
Biotechnological Potential and Ecotoxicology
Orientadora: Profa Dra Ana Teresa Lombardi
São Carlos
–
2017
Dedico este trabalho aos meus pais Adilson e Rosana, minha irmã Amanda
“Só Tu és o Senhor. F
izeste os céus, e os mais altos céus, e tudo o que
neles há, a terra e tudo o que nela existe, os mares e tudo o que neles
existe. Tu deste vida a todos os seres, e os exércitos dos céus te adoram.”
Neemias 9:6
“
O que sabemos é uma gota; o que ignoramos é um oceano
.”
Agradecimentos
Acima de tudo agradeço a DEUS por ter me dado a vida, criado a vida em todas as suas formas e me dado a oportunidade de estudar sua maior criação, a VIDA!
Agradeço minha família (meu pai Adilson, minha mãe Rosana, minha irmã Amanda, e meus avós Laurinda in memoriam, Teresinha e João) por sempre ter me apoiado em
todo esse percurso. Se cheguei onde estou, com certeza é graças ao incentivo e esforço de cada um deles.
À Profa Dra Ana Teresa Lombardi por ter se arriscado e pegado uma verdadeira
“batata-quente” nas mãos ao aceitar me orientar. Jamais terei como agradecer pela
confiança depositada em mim. Muito obrigado por cada conselho, bronca, ombro para chorar, abraço em momentos tristes e tudo mais que fez por mim.
À Profa Dra Jandira Liria Biscalquini Talamoni, Depto de Ciências Biológicas, UNESP, Bauru, por esses longos anos de amizade e confiança. Pelos conselhos e por ter me dado
oportunidades maravilhosas de crescimento profissional.
Agradecimento especial para as mestres Daniela M. Barreto e Graziela C. Montanhim, e ao Dr Alexsandro C. dos Santos (grande amigo) pela ajuda efetiva durante a execução dos experimentos e análises dessa tese. Também sou agradecido à Natália L. Oliveira e
Prof Dr Adriano Polpo (Depto Estatística, UFSCar), por toda ajuda na análise estatística.
Aos professores Dr Clovis Wesley Oliveira de Souza (Laboratório de Microbiologia, DMP, UFSCar) e Dra Maria da Graça Gama Melão (Laboratório de Plâncton, DHb,
UFSCar) por ceder espaço físico, materiais e equipamentos para a realização de algumas análises em seus laboratórios.
Aos colegas dos laboratórios de Biotecnologia de Algas (DB) e de Microbiologia (DMP), em especial a técnica Zélia Venézio, que de uma forma ou de outra, mesmo que
só com uma conversa para distrair um pouco a mente, contribuíram para a finalização dessa tese.
Aos professores que sempre me incentivaram e apoiaram desde o Ensino Médio até os dias de hoje: Profa Sandra Muller (ETEC de Garça), Profa Márcia Duran (E.E. Padre
Antônio Jorge Lima, Bauru), Profa Dra Eliana Marques Zanata (Depto Educação, UNESP, Bauru) e Profa Dra Inês Cechin (Depto Ciências Biológicas, UNESP, Bauru).
Agradeço a presença e as contribuições dos membros da banca de defesa e de qualificação: Profa Dra Suzelei Rodgher, Profa Dra Inessa L. Bagatini, Profa Dra Odete
Ao Programa de Pós-Graduação em Ecologia e Recursos Naturais (PPGERN), à Universidade Federal de São Carlos (UFSCar), ao Laboratório de Biotecnologia de Algas e às agências financiadoras da pesquisa: CAPES, CNPq (Proc. No.
302175/2015-6) e FAPESP (Proc. No. 2014/15894-0).
7
SUMARY
LIST OF FIGURES...10
LIST OF TABLES...14
ABBREVIATIONS, ACRONYMS AND SYMBOLS……….15
ABSTRACT...18
RESUMO...20
INTRODUCTION...22
General Introduction……...23
Mixotrophy………..23
Biotechnological aspects of mixotrophy in microalgae………..25
Ecological aspects of mixotrophy in microalgae……….28
Chlorellasorokiniana...30
References………...33
OBJECTIVES...41
General Objective...42
Specific Objectives...42
Hypothesis………...………....42
CHAPTER 1 – Comparative Study of Growth and Photosynthetic Responses of Chlorella sorokiniana (Chlorophyta) Under Photoautotrophic and Mixotrophic Conditions...45
Abstract...45
Introduction...45
Material and Methods………..49
Results……….52
8
Conclusions……….62
Acknowledgment……….63
References...63
CHAPTER 2 –An Investigation onto the Effects of Glucose on the Biochemical Composition of the Freshwater Microalga Chlorella sorokiniana………….…...70
Abstract...71
Introduction...71
Material and Methods………..75 Results……….77
Discussion………84
Conclusions……….88
Acknowledgment……….88
References...89
CHAPTER 3 –An Investigation onto Cd Toxicity to Chlorella sorokiniana in Mixotrophy and Photoautotrophy: a Bayesian approach……….………...96
Abstract...97
Introduction...98
Material and Methods……….…...100
Results…...………102
Discussion……….111 Conclusions………...114
Acknowledgment………...…115 References...115
9
Abstract...124
Introduction...125
Material and Methods………127 Results………...129
Discussion……….136
Conclusions………...…140 Acknowledgment………...…141
References...141
FINAL CONSIDERATIONS...148
10
LIST OF FIGURES
INTRODUCTION
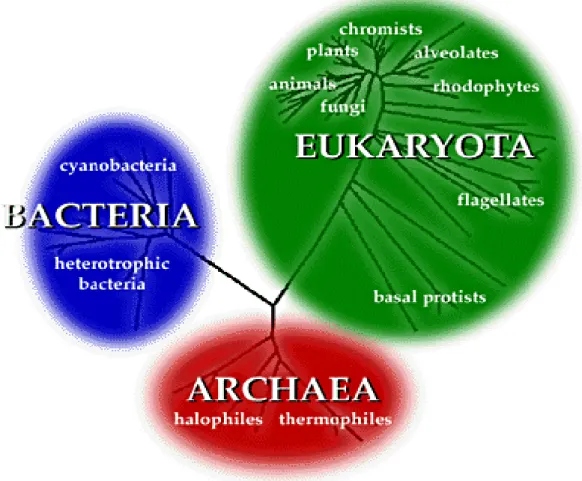
Figure 1 – Current phylogenetic tree of life based on small-subunit (SSU) rRNA sequences of the
organisms (Woose et al., 1990)………...23
Figure 2– Some potential applications of microalgae both in Biotechnology and in Ecology segments of
interest………..25
Figure 3 – Mixotrophy scheme inside the algal cell showing the biochemical and biophysical process of
this nutritional strategy………27
Figure 4 – Scheme of aquatic microbial food web with phytoplankton performing mixotrophy. Mixotrophy (dashed lines) by microalgae may occur via phagotrophy or, most commonly, osmotrophy of organic matter excreted by other organisms, such as bacteria, protozoans, and phytoplankton itself. At the top of the figure, a classical aquatic food web is represented. O.M. means organic matter (lysis of
cytoplasm and/or feces)……….…………..29
Figure 5 – The freshwater microalga Chlorellasorokiniana observed in: A. microscopy with resolution
of 1000x (Photo from Culture Collection of Algae at The University of Texas at Austin, https://utex.org/products/utex-1230. Accessed in May 2017), and B. schematic ultrastructure of genus
Chlorella representing different organelles (Safi et al., 2014)………...….…30
Figure 6 – Reproduction phases of genus Chlorella sp: a. early cell-growth phase; b. late cell-growth
phase; c. chloroplast dividing phase; d. early protoplast dividing phase; e. late protoplast dividing phase; f. daughter cells maturation phase; g. hatching phase (Safi et al., 2014)………...31 CHAPTER 1
Figure 1.1 – Ln values of chlorophyll a concentration in mg.L-1 (A) and density in cells.mL-1 (B) in C. sorokiniana under photoautotrophic (full squares), mixotrophic (empty circle) and photo-mixotrophic
(empty triangle) growth conditions. Error bars mean standard deviation from the mean (n = 3). Glucose was added at the beginning (mixotrophic cultures) and at 4th day (photo-mixotrophic cultures) of experiment, respectively.………...………..53
Figure 1.2 – Sigmoid growth curves based on chlorophyll a concentration (mg.L-1) of C. sorokiniana
under photoautotrophic (full squares), mixotrophic (empty circle) and photo-mixotrophic (empty triangle) growth conditions. Error bars mean standard deviation from the mean (n = 3). Glucose was added at the beginning (mixotrophic cultures) and at 4th day (photo-mixotrophic cultures) of experiment, respectively
………..54
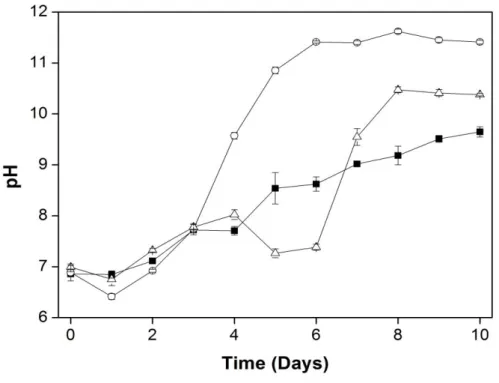
Figure 1.3 – Time-course pH values in C. sorokiniana under photoautotrophic (full squares), mixotrophic
11
deviation from the mean (n = 3). Glucose was added at the beginning (mixotrophic cultures) and at 4th day (photo-mixotrophic cultures) of experiment, respectively …….………..55
Figure 1.4 – Time-course of maximum quantum efficiency (Fv/Fm ratio) in C. sorokiniana under
photoautotrophic (full squares), mixotrophic (empty circles) and photo-mixotrophic (empty triangles) grown conditions. A.U. means Arbitrary Unit. Error bars mean standard deviation from the mean (n =
3)… Glucose was added at the beginning (mixotrophic cultures) and at 4th day (photo-mixotrophic cultures) of experiment, respectively ………...………...…56 CHAPTER 2
Figure 2.1 – Values of chlorophyll a concentration in mg.mL-1 in C. sorokiniana under photoautotrophic
(black column), mixotrophic (grey column) and photo-mixotrophic (white column) growth conditions during experimental time. Error bars mean standard deviation from the mean (n = 3). Glucose was added at the beginning (mixotrophic cultures) and at 4th day (photo-mixotrophic cultures) of experiment, respectively …...………..………78
Figure 2.2 – Values of cell density (cells.mL-1) in C. sorokiniana under photoautotrophic (full squares),
mixotrophic (empty circle) and photo-mixotrophic (empty triangle) growth conditions during experimental time. Error bars mean standard deviation from the mean (n = 3). Glucose was added at the beginning (mixotrophic cultures) and at 4th day (photo-mixotrophic cultures) of experiment, respectively
……….79
Figure 2.3 – Values of cell biovolume (μm3) in C. sorokiniana under photoautotrophic (black bars),
mixotrophic (grey bars) and photo-mixotrophic (white bars) growth conditions during experimental time. Error bars means standard deviation from the mean (n = 3). Glucose was added at the beginning (mixotrophic cultures) and at 4th day (photo-mixotrophic cultures) of experiment, respectively ……….80
Figure 2.4 – Total proteins (A) and carbohydrates (B) in pg.μm-3 of C. sorokiniana under
photoautotrophic (black column), mixotrophic (grey column) and photo-mixotrophic (white column) growth conditions at 3rd and 5th days. Error bars mean standard deviation from the mean (n = 3). Glucose
was added at the beginning (mixotrophic cultures) and at 4th day (photo-mixotrophic cultures) of experiment, respectively ...………..81
Figure 2.5 – Proteins:carbohydrates ratio (P:C ratio) of C. sorokiniana under photoautotrophic (black
column), mixotrophic (grey column) and photo-mixotrophic (white column) growth conditions at 3rd and
5th days. Error bars mean standard deviation from the mean (n = 3). Glucose was added at the beginning
(mixotrophic cultures) and at 4th day (photo-mixotrophic cultures) of experiment, respectively……...82
Figure 2.6 – Total lipids per cell volume (pg.μm-3) of C. sorokiniana under photoautotrophic (black
column), mixotrophic (grey column) and photo-mixotrophic (white column) growth conditions at 3rd and
5th days. Error bars mean standard deviation from the mean (n = 3). Glucose was added at the beginning
12 Figure 2.7 – Bacterial density, expressed as colony forming units per mL (CFU.mL-1), in
photobioreactors of microalga C. sorokiniana under photoautotrophic (full squares), mixotrophic (empty
circle) and photo-mixotrophic (empty triangle) growth conditions during experimental time. Error bars mean standard deviation from the mean (n = 3). Glucose was added at the beginning (mixotrophic cultures) and at 4th day (photo-mixotrophic cultures) of experiment, respectively..….……….84 CHAPTER 3
Figure 3.1 – Chlorophyll a concentration (mg.mL-1) in photoautotrophic (A) and mixotrophic (B) growth
conditions at 72 hours as function of the natural log of Cd concentrations. The probability of photoautotrophy being more affected than mixotrophy for each Cd concentration is shown in (C)………...………..……….103
Figure 3.2 – Photosynthetic activity (Fv/Fm) in photoautotrophic (A) and mixotrophic (B) growth
conditions at 72 hours as function of the natural log of Cd concentrations. PAM measurement is reported as arbitrary units (A.U.). The probability of photoautotrophy being more affected than mixotrophy for each Cd concentration is shown in (C).………...………….………...105
Figure 3.3 – Cell viability, expressed in percentage (%), in photoautotrophic (A) and mixotrophic (B) growth conditions at 72 hours as function of the natural log of Cd concentrations. The probability of photoautotrophy being more affected than mixotrophy for each Cd concentration is shown in (C)……….……….…106
Figure 3.4 –Total proteins content, expressed in pg.μm-3, in photoautotrophic (A) and mixotrophic (B
and C) growth conditions at 72 hours as function of the natural log of Cd concentrations. Graph B represents mixotrophic condition on a comparable scale to photoautotrophy (A). The probability of photoautotrophy being more affected than mixotrophy for each Cd concentration is shown in (D)………..………....107
Figure 3.5 –Total carbohydrates content, expressed in pg.μm-3, in photoautotrophic (A) and mixotrophic
(B) growth conditions at 72 hours as function of the natural log of Cd concentrations. The probability of photoautotrophy being more affected than mixotrophy for each Cd concentration is shown in (C)………...………...108
Figure 3.6 – P:C ratio in photoautotrophic (A) and mixotrophic (B) growth conditions at 72 hours as function of the natural log of Cd concentrations. Graph B represents mixotrophic condition on a comparable scale to photoautotrophy (A). The probability of photoautotrophy being more affected than mixotrophy for each Cd concentration is shown in (D)……..………...…109
13
CHAPTER 4
Figure 4.1 – Concentration of chlorophyll a(μg.cell-1) in C. sorokiniana at 72 h of exposed to NP-TiO2
in photoautotrophic and mixotrophic conditions. Error bars mean standard deviation from the mean (n =
3)………..………..……130
Figure 4.2 – Maximum fluorescence of photosystem II (Fv/Fm) of microalga C. sorokiniana at 72 h
exposed to NP-TiO2 in photoautotrophic and mixotrophic conditions. Error bars mean standard deviation
from the mean (n = 3). A.U. means Arbitrary Units..………..………..131
Figure 4.3 – Specific growth rates (d-1) of microalga C. sorokiniana exposed to NPs-TiO 2 in
photoautotrophic and mixotrophic conditions. Error bars mean standard deviation from the mean (n =
3)………....132
Figure 4.4 – Cell density (cell.mL-1) at 72 h of exposed to NPs-TiO
2 in photoautotrophic and mixotrophic
conditions. Error bars mean standard deviation from the mean (n = 3)…….………...133
Figure 4.5 – The percentage of viable cell at 72 hours of exposed to NPs-TiO2 in photoautotrophic and
mixotrophic conditions. Error bars mean standard deviation from the mean (n =
3)………...….133
Figure 4.6 – Biochemical composition of microalga C. sorokiniana at 72 h exposed to NP-TiO2 in
photoautotrophic and mixotrophic conditions. (A) Carbohydrate content (pg.μ-3). (B) Protein content
14
LIST OF TABLES
INTRODUCTION
Table 1 – Studies of mixotrophy in some microalgae species and the organic carbon used in the cultures...32 CHAPTER 1
Table 1.1– Parameters of photosynthesis-irradiance curve (rETRmax, Ik and α) and quenchings (qP and
NPQ) of Chlorella sorokiniana under photoautotrophic, mixotrophic and photo-mixotrophic growth
conditions. For each sample, values are means ± s.d. (n = 3). Different letters means statistical difference by Tukey test, with 5% of significance………....57 CHAPTER 3
Table 3.1 – Cadmium concentrations (mol.L-1) used in the culture medium of Chlorella sorokiniana
grown either under photoautotrophy or mixotrophy. Cadmium concentrations, represented by [Cd], are reported in mol.L-1……….…………...……….101
CHAPTER 4
Table 4.1 – Values of culture pH (72 h NPs-TiO2 exposed cultures). Values are means ± standard
deviation of three replicates (same letters indicate statistical similarity). Statistical analysis was performed separately for the treatments either photoautotrophy or mixotrophy. Ref = reference
15
LIST OF ABBREVIATIONS, ACRONYMS AND SYMBOLS
α Photosynthetic efficiency
e Neperian logarithm
μ Specific growth rate
μm-3 Cubic micrometer
μmol Micromol
τ Parameters that determines the inflection point of the curve
% Percentage
[Cd] Cadmium concentration
~ Approximately
°C Celsius degree
1O
2 Singlet oxygen
AAP medium Algal assay procedure medium ACCase Enzyme acetyl-CoA carboxylase ADP Adenosine diphosphate
Ag Silver
ANOVA Analysis of variance ATP Adenosine triphosphate
ATPase Enzyme that catalyzes the decomposition of ATP A.U. Arbitrary units
B Maximum point of the curve with the same unit of y(t) BG11 medium Blue-green medium
C Carbon
C16:0 Palmitic acid
C18:1 Oleic acid
C18:2 Linoleic acid C18:3 Linolenic acid C6H12O6 Glucose
Ca Calcium
Cd Cadmium
CFU Colony forming units Chl a Chlorophyll a
cm Centimeter
CNPq National Council of Scientific and Technological Development
CO2 Carbon dioxide
Cr Chromium
Cu Cooper
d Diameter
d-1 By day
DNA Deoxyribonucleic acid DOC Dissolved organic carbon
e.g. For example
et al And collaborators
FADH2 Flavin adenine dinucleotide
16
Fm Maximum fluorescence after dark adaptation
Fo Basal fluorescence after dark adaptation
Fv Variable fluorescence after dark adaptation
Fv/Fm Quantum maximum efficiency of Photosystem II
g Grams
h Hour
H+ Hydrogen protons
H2CO3 Carbonic acid
H2O Water
H2O2 Hydrogen peroxide
Hg Mercury
Ik Irradiance saturation
K+ Potassium cation
kJ Kilojoule
L Liters
LHC Light harvesting complex
Ln Natural logarithm
Log Logarithm
m Meters
mg Milligram
min Minutes
mL Milliliter
mol Measurement for amount of substance mRNA Messenger ribonucleic acid
mV Millivolt
n Number of replicas
N Nitrogen
N:C Nitrogen:carbon rate
NADH2 Nicotinamide adenine dinucleotide
NADPH2 Nicotinamide adenine dinucleotide phosphate
Ni Nickel
NPQ Non-photochemical quenching
NPs Nanoparticles
NP-TiO2 Titanium dioxide nanoparticles
O2 Oxygen gas
O2•- Superoxide radical anions
OH• Hydroxyl
OM Organic matter
p p value
P:C ratio Proteins:carbohydrates ratio
PAM Pulse amplitude modulated fluorometry PAR Photosynthetically active radiation PBS Phosphate buffered saline solution PCA Plate count agar medium
pg Picograms
pH Potential of hydrogen
17
PSII Photosystem II
qP Photochemical quenching
Ref Reference culture
rETR Relative electron transport rate RNA Ribonucleic acid
RO• Phenoxy
ROO• Peroxy
ROS Reactive oxygen species rRNA Ribosomal ribonucleic acid
RuBisCO Ribulose-1,5-biphosphate carboxylase/oxygenase
s Second
s.d. Standard deviation
SH Sulfhydryl group
sp Specie
SSU Small-subunit
t Time
TiO2 Titanium dioxide
U.S.A. United States of America UV Ultraviolet light
V Biovolume
vs Versus
y(t) Chlorophyll a concentration (mg.L-1) in the time
18
ABSTRACT
In aquatic environments, phytoplankton consists mostly of photosynthetic microorganisms that serve as the basis of food chains. However, besides photoautotrophy, it is widely reported in the literature that many microalgae can take up dissolved organic matter present in the environment concomitantly with the photosynthesis, a metabolic pathway known as mixotrophy. Little is known about the ecophysiology of mixotrophy in microalgae, and almost all studies are focused on the use of this metabolic pathway to increase the production of algal biomass and stimulate the production of specific biomolecules. Another important issue, considering the current anthropic activity, is that most of the contaminants eliminated in aquatic environments, such as metals and nanoparticles, affect the phytoplankton. However, so far, no ecotoxicological study involving mixotrophic metabolism was found in the literature. To better understand mixotrophy in microalgae, this work chose the chlorophycean freshwater Chlorellasorokiniana as test organism. We divided the study
into two parts: the first focused on the physiological/biotechnological interest through the study of growth, photosynthetic parameters, changes in cellular volume, and production of biomolecules (proteins, carbohydrates and lipids); the second part focused on the ecotoxicological effects of cadmium (Cd) and titanium dioxide nanoparticles (NPs-TiO2). To stimulate mixotrophy, glucose (1.0 g.L-1 or 5 x 10⁻³ mol.L-1) was used
as the organic carbon source. The results showed that during mixotrophy, the microalga
C. sorokiniana presented higher population growth and production of biomolecules,
such as chlorophyll a and lipids, when compared to photoautotrophic cultures. It was
also observed that the photosynthetic parameters were affected by mixotrophy, although they did not interfere in the growth of the microalga, and that the presence of bacteria in the cultures acted as a stimulant factor in the production of algal biomass. Regarding the ecotoxicological effects of contaminants, microalgae in mixotrophy were more resistant to both Cd and NPs-TiO2 than those in photoautotrophy, but with changes in the
19 necessarily relying solely on photosynthesis to survive, so stimulating the growth and production of biomolecules of biotechnological interest, and increased cellular viability in environments contaminated with metals and nanoparticles. This study is a contribution to the understanding of mixotrophy and photoautotrophy metabolisms in a freshwater Chlorophyta with biotechnological potential.
20
RESUMO
Nos ambientes aquáticos, o fitoplâncton é formado basicamente de microrganismos fotossintetizantes que servem como base das cadeias alimentares. Entretanto, além da fotoautotrofia, é vastamente citado na literatura que muitas microalgas alimentam-se de matéria orgânica dissolvida presente no ambiente concomitantemente à realização da fotossíntese, uma via metabólica conhecida como mixotrofia. Sabe-se pouco sobre a ecofisiologia em metabolismo mixotrófico nas microalgas, sendo os estudos, em sua quase totalidade, voltados ao uso dessa via metabólica para aumentar a produção de biomassa algal e estimular a produção de biomoléculas específicas. Outra questão importante, considerando a atividade antrópica atual, é que a maioria dos contaminantes eliminados nos ambientes aquáticos, como metais e nanopartículas, são estudados em fitoplâncton sob metabolismo fotoautotrófico, não sendo encontrados trabalhos ecotoxicológicos envolvendo o metabolismo mixotrófico na literatura. Para entender melhor o metabolismo algal em mixotrofia, este trabalho escolheu a microalga Chlorophyta de água doce Chlorella sorokiniana como organismo-teste. Para melhor
organizá-lo, foi dividido em duas partes: a primeira focou no interesse fisiológico/biotecnológico através do estudo do crescimento, parâmetros fotossintéticos, volume celular, e produção de biomoléculas (proteínas, carboidratos e lipídeos); a segunda parte focou nos efeitos ecotoxicológicos de cádmio (Cd) e de nanopartículas de dióxido de titânio (NPs-TiO2). Para estimular a mixotrofia, glicose (1.0 g.L-1 ou 5 x 10⁻³
mol.L-1) foi utilizada como fonte de carbono orgânico. Os resultados mostraram que
durante a mixotrofia, a microalga C. sorokiniana apresentou maiores crescimento
populacional e produção de biomoléculas, como clorofila a e lipídeos, quando
comparada com as culturas em fotoautotrofia. Também foi observado que os parâmetros fotossintéticos foram afetados em mixotrofia, porém não interferindo no crescimento da microalga, e que a presença de bactérias pode ter atuado como fator estimulante na produção de biomassa algal. Em relação aos efeitos ecotoxicológicos dos contaminantes, as microalgas em mixotrofia foram mais resistentes tanto ao Cd quanto às NPs-TiO2 do que em fotoautotrofia, porém com mudanças na composição
21 carbono orgânico para esses microrganismos. Na mixotrofia, o carbono orgânico funciona como uma fonte extra de carbono estrutural e de energia para as microalgas, não dependendo obrigatoriamente somente da fotossíntese para sobreviver, estimulando o crescimento e produção de biomoléculas de interesse biotecnológico, além de aumentar a viabilidade celular em ambientes contaminados tanto com Cd quanto com NPs-TiO2. Este estudo é uma contribuição ao entendimento dos metabolismos
mixotróficos e fotoautotróficos em uma Chlorophyta de água doce com potencial biotecnológico.
22
23
GENERAL INTRODUCTION
1. Mixotrophy
The diversity of organisms on Earth is a result of the evolution of adaptive strategies for survival of the species over millions of years. Based on rRNA analysis (Woese et al., 1990), nowadays the life is divided in three great domains: Bacteria, Archaea and Eukarya (Fig. 1). The diversity in each domain and environmental
plasticity of the organisms led to a diversification of the metabolic process, many of which are not yet known (Pace, 1997; Raymann et al., 2015).
Figure 1 - Current phylogenetic tree of life based on small-subunit (SSU) rRNA sequences of the organisms (Woose et al., 1990).
24 of different aspects of human activities, such as the production of antibiotics, food, oxygen gas, nitrogen biofixation, poisons, etc (Madigan et al., 2016).
Classically, or at least didactically, the living beings are classified in two groups or categories: the autotrophs (produce their own organic matter using energy from the
environment) and heterotrophs (use carbon and energy through the breakdown of
organic matter from the biomass of other organisms; Dolan & Peréz, 2000; Tittel et al., 2003). These two categories define trophic levels and are the extremes of a continuum of survival strategies well illustrated among planktonic protists (Jones, 1994; Stoecker, 1998). Within these two extremes, many organisms have characteristics of both,
autotrophs and heterotrophs, when they are categorized as mixotrophs (Tittel et al.,
2003; Nelson & Cox, 2014; Madigan et al., 2016).
The mixotrophy is a special nutritional strategy and has been considered as a evolutionary successful to overcome stressing situations (Jones, 1994; Raven, 1997; Stoecker, 1998). Indeed, the mixotrophy is widely found in microorganisms, especially in protists (protozoans and algae), but also occurs in multicellular organisms, such as certain animals. For example, Valmalette et al. (2012) found an insect (Acyrthosiphon pisum) that electron transfer and ATP synthesis in carotenes is induced by light.
Mixotrophic protists differ both qualitatively and quantitatively in their dependence on feeding, light and uptake of dissolved nutrients (Stoecker, 1998). The mixotrophy in protists can be facultative or obligate (McManus et al., 2012). The costs and benefits of mixotrophy in different taxa of protists and environments are still largely a subject of speculation (Boëchat et al., 2007).
Many protozoans, for example, either sequester plastids derived from their prey (kleptoplastids or chloroplast retention), such as the Perispira ovum when it eats Euglena proxima (Johnson et al., 1995; McManus et al., 2012), or keep algal
endosymbionts, such as the Paramecium bursaria that phagocytes the microalga Chlorella sp (Dolan, 1992). Some microalgae species have the ability of switching
between phototrophic and heterotrophic metabolism depending on environmental conditions or perform both, mixotrophy (Kaplan et al., 1986; Lee, 2004).
25 unclassified species are accounted for (Norton et al., 1996; Bhattacharya et al., 2004; Guiry, 2012).
The plasticity of microalgae, of interest in Biotechnology and Ecology (Fig. 2), is a result of environmental selection during the course of evolution (Keeling, 2010) and to possess a rich source of genetic (nuclear, chloroplast and mitochondrial genomes) and chemical diversity (Specht et al., 2010; Gimple et al., 2012).
Figure 2 – Some potential applications of microalgae both in Biotechnology and in Ecology segments of interest. Souce: author.
2. Biotechnological aspects of mixotrophy in microalgae
26 terrestrial plants biomass. The microalgae related advantages are higher photosynthetic efficiency, fast growth, direct carbon dioxide mitigation, and growth in non-arable lands (Juntila et al., 2005; Marchello et al., 2015). In mixotrophic growth conditions, Li et al. (2014) found the production of palmitic acid (C16:0), oleic acid (C18:1), linoleic acid (C18:2) and linolenic acid (C18:3) by the microalga Chlorella sorokiniana, similar to
the fatty acids composition in soybean oil.
From this point of view, the culture of microalgae in mixotrophic conditions (i.e., supplemented with organic carbon) has been greatly used in production of biomass and secondary metabolites (Li et al., 2015). The mixotrophic culture of microalgae has some advantages in relation to autotrophic and heterotrophic ones (Juntila et al., 2005; Li et al., 2014).
Throughout the autotrophic cultures (energy and carbon sources are light and carbon dioxide, respectively), both the increase in number of cells and the formation of biofilm at flask become so dense that create self-shading, reducing drastically the light penetration for photosynthetic activity (Li et al., 2013). Instead, in heterotrophic cultures, the only source of energy and carbon for cells is the organic carbon supplemented in the medium, increasing the production costs (Juntila et al, 2005; Perez-Garcia et al., 2011). Another problem is the growth of other microorganisms, as bacteria, that may consume the organic carbon so fast that limits the microalgal growth, and produce organic acids, such as the lactic and malic, compromising (and inhibiting in some cases) the microalgae growth (Giovanardi et al., 2013).
In mixotrophic cultures of microalgae, the cells can use light and carbon dioxide during photosynthesis and organic carbon during respiration, thus increasing the energy and biomass produced in a short period of time when compared with autotrophic and heterotrophic cultures; an increase the relation cost-benefits is observed in the mixotrophic algae growth (Wan et al., 2011).
The uptake of glucose by microalgae, for example, occurs due to a co-transport system with protons. As can be seen in Figure 3, the hexose/H+ symport system
involves the consumption of one ATP molecule per hexose/H+ transported via
28 Literature concerning mixotrophic cultures of microalgae has shown that different species behave differently, what is positive, because it shows the genetic diversity of this group of microorganisms in relation to the environmental conditions (Rodrígues-Lopoz, 1966; Giovanardi et al., 2014; Juntila et al., 2015).
3. Ecological aspects of mixotrophy in microalgae
Environmentally, the microalgae have a crucial role in aquatic ecosystems, because they are the main components of the phytoplankton, i.e., the basis of aquatic food webs (Reynolds, 2006). During photosynthesis, microalgae produce oxygen gas and organic matter that are used by aerobic heterotrophic organisms for their maintenance and growth (Reynolds, 2006).
The classical theories of food web in ecology do not consider the role of mixotrophy in the relations among the organisms (Elton, 1927; Odum, 1957). However, mixotrophy can influence the food web structure and function (Boëchat et al., 2007; Wilken et al., 2014), taking to competition for dissolved organic matter between bacteria and microalgae in microbial loops (Ptacnik et al., 2004; Bell, 2012). It also allow certain species of phytoplankton to occasionally dominate, and perhaps disrupt microbial food web structure (Stoecker, 1998), particularly in the dark or at low irradiance (Kamjunke et al., 2008).
For example of the mixotrophic role in the structure of the aquatic food web, Boëchat et al. (2007) showed that the microalga Ochromonas sp. during mixotrophy,
can change their fatty acids composition, limiting grazing by zooplankton, changing the biochemical matter composition and energy through food webs (Müller-Navarra et al. 2004).
29 microorganisms potentially utilize organic carbon, such as Cyanobacteria, Chrysophyte, Chlorophytes, Dinophytes, Bacillariophytes, and Xanthophytes (Droop, 1974).
Figure 4 - Scheme of aquatic microbial food web with phytoplankton performing mixotrophy. Mixotrophy (dashed lines) by microalgae may occur via phagotrophy or, most commonly, osmotrophy of organic matter excreted by other organisms, such as bacteria, protozoans, and phytoplankton itself. At the top of the figure, a classical aquatic food web is represented. O.M. means organic matter (lysis of cytoplasm and/or feces). Source: author.
In ecological studies, microalgae have been used in wastewater treatments, bioremediation of metal contaminated environments, atmospheric carbon dioxide fixation, assessment water quality, and others (Fischer et al., 1984; Mehta & Gaur, 2005; Arbib et al., 2014; Marchello et al., 2015).
30 stimulating the mixotrophic growth. So far, one investigation (Subashchandrabose et al., 2013) looked at cyanobacteria and microalgae under mixotrophic growth (glucose, acetate, ethanol, and glycerol as organic carbon source) as distinctive biological agents for the degradation of xenobiotic organic pollutants.
4.
Chlorella sorokiniana
The freshwater green microalga Chlorella sorokiniana is non-motile and
unicellular (Shihira & Kraus, 1965; Huss et al., 1999). Figure 5 shows a photomicrograph of the species, its tallus is formed by spherical or ellipsoidal cells of approximately 3 – 5 µm diameter, but grown on glucose it can became larger (Sorokin, 1959), and glucosamine as a dominant cell wall component (Huss et al., 1999).
Figure 5 – The freshwater microalga Chlorella sorokiniana observed in: A. microscopy with resolution
of 1000x (Photo from Culture Collection of Algae at The University of Texas at Austin, https://utex.org/products/utex-1230. Accessed in May 2017), and B. schematic ultrastructure of genus Chlorella representing different organelles (Safi et al., 2014).
In relation to biotechnological potentials of this microalgae, Sorokin (1959) showed that C. sorokiniana does not produce norspermidine, a natural chemical that is
produced by some algae, bacteria, and terrestrial plants, with antitimoral properties. However, C. sorokiniana can produce lutein. Also, secondary carotenoids are never
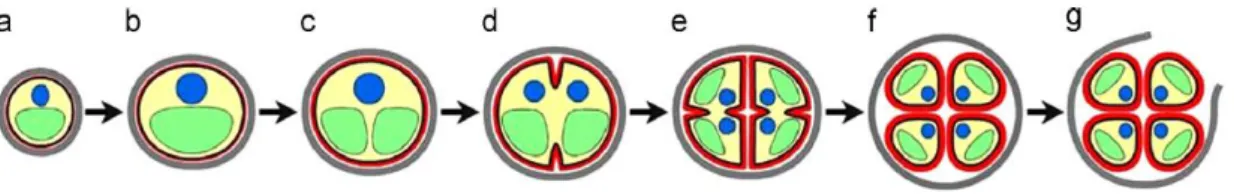
31 Reproduction (Fig. 6) occurs exclusively by asexual cycle by means of autospores production (Kessler & Huss, 1992; Safi et al., 2014).
Figure 6 – Reproduction phases of genus Chlorella sp: a. early cell-growth phase; b. late cell-growth
phase; c. chloroplast dividing phase; d. early protoplast dividing phase; e. late protoplast dividing phase; f. daughter cells maturation phase; g. hatching phase (Safi et al., 2014).
In accordance with international algal taxonomy (http://www.algaebase.org, accessed in May 2017), the specie C. sorokiniana is classified as:
Empire Eukaryota Kingdom Plantae
Subkingdom Viridiplantae
Infrakingdom Chlorophyta Phylum Chlorophyta
Subphylum Chlorophytina Class Trebouxiophyceae
Order Chlorellales
Family Chlorellaceae GenusChlorella
32
Table 1 - Studies of mixotrophy in some microalgae species and the organic carbon used in the cultures.
Microalgae Species Organic Carbon Source Reference
Chlorella sorokiniana Glucose
Wan et al. (2011) Li et al. (2014; 2015);
Juntila et al. (2015)
Chlorella vulgaris Glucose
Glucose and glycerol
Mayo & Noike (1994); Liang et al. (2009)
Chlorella pyrenoidosa Glucose Yang et al (2000);
Kamjunke et al (2008)
Chlorella regularis
Glucose, galactose, acetic acid, etanol, acetaldehyde and pyruvic
acid
Endo et al. (1973)
Chlorella minutissima Glucose, glycerol and acetate Higgins & VanderGheynst
(2014)
Chlamydomonas sp Glucose Kamjunke et al (2008) Neochloris oleoabundans Glucose
Giovanardi et al. (2013); Baldisserotto et al. (2014);
Giovanardi et al. (2014)
Pavlova lutheri Acetate and bicarbonate Guihéneuf et al. (2009) Tisochrysis lutea Glycerol Alkhamis & Qin (2016) Isochysis galbana Glycerol Alkhamis & Qin (2015) Botryococcus braunii Glucose Wan et al. (2011)
Scenedesmus sp Glucose, glycerol and acetate Dittamark et al, (2014) Phaeodactylum tricornutum Glucose, glycerol and acetate Liu et al. (2009)
Nannochloropsis sp Glucose Cheirsilp & Torpee (2012)
It is in reason to its robustness and plasticity, and ability to grow mixotrophically, that we have chosen C. sorokiniana for the present research. In the
pages that follow, we explore the physiology and relationship of the freshwater microalgae C. sorokiniana grown under mixotrophy (glucose as organic nutrition) with
33 REFERENCES
ALKHAMIS, Y.; QIN, J.G. 2015. Comparison of N and P requirements of Isochrysis galbana under phototrophic and mixotrophic conditions. Journal of Applied
Phycology, 2: 2231-2238.
ALKHAMIS, Y.; QIN, J.G. 2016. Comparison of pigment and proximate compositions of Tisochysis lutea in phototrophic and mixotrophic cultures. Journal of
Applied Phycology, 28: 35-42.
ANDERSEN, R.A. 1992. Diversity of eukaryotic algae. Biodiversity and Conservation, 1: 267-292.
ARBIB, Z.; RUIZ, J.; ÁLVAREZ-DÍAZ, P.; GARRIDO-PÉREZ, C.; PERALES, J.A. 2014. Capability of different microalgae species for phytoremediation processes: Wastewater tertiary treatment, CO2 bio-fixation and low cost biofuels
production. Water Research, 49: 465-474.
BALDISSEROTTO, C.; GIOVANARDI, M.; FERRORI, L.; PANCALDI, S. 2014. Growth, morphology and photosynthetic responses of Neochloris oleoabundans
during cultivation in a mixotrophic brackish medium and subsequent starvation. Acta Physiologiae Plantarum, 36: 461-472.
BELL, G. 2012. Experimental evolution of heterotrophy in a green alga. Evolution, 67(2): 468-476.
BHATTACHARYA, D.; YOON, H.S.; HACKETT, J.D. 2003. Photosynthetic eukaryotes unite: endosymbiosis connects the dots. BioEssays, 26: 50-60.
BOËCHAT, I.G.; WEITHOFF, G.; KRÜGER, A.; GÜCKER, B.; ADRIAN, R. 2007. A biochemical explanation for the success of mixotrophy in the flagellate
Ochromonas sp. Limnology and Oceanography, 52(4): 1624-1632.
34 CROPP, R.; NORBURY, J. 2015. Mixotrophy: the missing link in
consumer-resource-based ecologies. Theoretical Ecology, 8: 245-260.
DAVIS, R.; ADEN, A.; PIENKOS, P.T. 2011. Techno-economic analysis of autotrophic microalgae for fuel production. Applied Energy, 88: 3524-3531.
DITTAMART, D.; PUMAS, C.; PEKKOH, J.; PEERAPORNPISAL, Y. 2014. Effects of organic carbon source and light-dark period on growth and lipid accumulation of Scenedesmus sp. AARL G022. Maejo International Journal of Science and
Technology, 8(2): 198-206.
DOLAN, J. 1992. Mixotrophy in Ciliates: A Review of Chlorella Symbiosis and Chloroplasts Retention. Marine Microbial Food Webs, 6(2): 115-132.
DOLAN, J.R.; PÉREZ, M.T. 2000. Costs, benefits and characteristics of mixotrophy in marine oligotrichs. FreshwaterBiology, 45: 227-238.
DROOP, M.R. 1974. Heterotrophy of carbon. In STEWART, W.D.P. [Ed.] Algal
Physiology and Biochemistry. Blackwell, Oxford, UK, pp. 530–59.
ELTON, C.S. 1927. Animal Ecology. The MacMillan Company, New York, 260p.
ENDO, H.; NAKAJIMA, K.; CHINO, R.; SHIROTA, M. 1974. Growth characteristics and cellular components of Chlorella regularis, heterotrophic fast growing
strain. Agricultural and Biological Chemistry, 38, 9-18.
FISHER, N.S.; BOHÉ, M.; TEYSSIÉ, J.L. 1984. Accumulation and toxicity of Cd, Zn, Ag, and Hg in four marine phytoplankters. Marine Ecology, 18: 201-213.
GIMPEL, J.A.; HENRÍQUEZ, V.; MAYFIELD, S.P. 2015. In metabolic engineering of eukaryotic microalgae: potential and challenges come with great diversity. Frontiers in Microbiology, 6: 1-14.
GIOVANARDI, M.; FERRORI, L.; BALDISSEROTTO, C.; TEDESCHI, P.; MAIETTI, A.; PANTALEONI, L.; PANCALDI, S. 2013. Morphophysiological analyses of Neochloris oleoabundans (Chlorophyta) grown mixotrophycally in a
35 GIOVANARDI, M.; BALDISSEROTTO, C.; FERRONI, L.; LONGONI, P.; CELLA, R.; PANCALDI, S. 2014. Growth and lipid synthesis promotion in mixotrophic
Neochloris oleoabundans (Chlorophyta) cultivated with glucose. Protoplasma,
251: 115-125.
GUIHÉNEUF, F.; MIMOUNI, V.; ULMANN, L.; TREMBLIN, G. 2009. Combined effects of irradiance level and carbon source on fatty acid and lipid class composition in the microalga Pavlova lutheri commonly used in mariculture.
Journal of Experimental Marine Biology and Ecology, 369: 136-143.
GUIRY, M.D. 2012. How many species of algae are there? Journal of Phycology, 48(5): 1057-1063.
HARTMANN, M.; ZUBKOV, M.V.; SCANIAN, D.J.; LEPÈRE, C. 2013. In situ
interactions between photosynthetic picoeukaryotes and bacterioplankton in the Atlantic Ocean: evidence for mixotrophy. Environmental Microbiology Reports, 5(6): 835-840.
HIGGINS, B.T.; VANDERGHEYNST, J.S. 2014. Effects of Escherichia coli on
mixotrophic growth of Chlorella minutissima and production of biofuel
precursors. PLoS ONE, 9(5): :e96807.
HILDEBRAND, M.; ABBRIANO, R.M.; POLLE, J.E.W.; TRALLER, J.C.; TRENTACOSTE, E.M.; SMITH, S.R.; DAVIS, A.K. 2013. Metabolic and cellular organization in evolutionarily diverse microalgae as related to biofuels production. Current Opinion in Chemical Biology, 17: 506-514.
HUSS, V.A.R.; FRANK, C.; HARTMANN, E.C.; HIRMER, M.; KLOBOUCEK, A.; SEIDEL, B.M.; WENZELER, P.; KESSLER, E. 1999. Biochemical taxonomy and molecular phylogeny of the genus Chlorella sensu lato (Chlorophyta).
Journal of Phycology, 35: 587-598.
JOHNSON, P.W.; DONAGHAY, P.L.; SMALL, E.B.; SIEBURTH, J.M. 1995. Ultrastructure and ecology of Perispira ovum (Ciliophora: Litostomatea): an
aerobic, planktonic ciliate that sequesters the chloroplasts, mitochondria, and paramylon of Euglena proxima in a micro-oxic habitat. Eukaryotic
36 JONES, R.I. 1994. Mixotrophy in planktonic protists as a spectrum of nutritional
strategies. Marine Microbial Food Webs, 8: 87–96.
JUNTILA, D.J.; BAUTISTA, M.A.; MONOTILLA, W. 2015. Biomass and lipid production of a local isolate Chlorella sorokiniana under mixotrophic growth
conditions. Bioresource Technology, 191: 395-398.
KAMJUNKE, N.; KÖHLER, B.; WANNICKE, N.; TITTLE, J. 2008. Algae as competitors for glucose with heterotrophic bacteria. Journal of Phycology, 44: 616-623.
KEELING, P.J. 2010. The endosymbiotic origin, diversification and fate of plastids. Philosophical Transactions of Royal Society of London B, 365: 729-748.
KESSLER, E.; HUSS, V.A.R. 1992. Comparative physiology and biochemistry and taxonomic assignment of the Chlorella (Chlorophyceae) strains of the Culture
Collection of the University of Texas at Austin. Journal of Phycology, 28: 550–
3.
KOMOR, E. 1973. Proton-coupled hexose transport in Chlorella vulgaris. FEBS
Letters, 38: 16-18.
KOMOR, E.; TANNER, W. 1974. The hexose-proton symport system of Chlorella vulgaris: specificity, stoichiometry and energetics of sugar-induced proton
uptake. European Journal of Biochemistry, 44: 219-223.
LEE, Y.K. 2004. Algal nutrition. Heterotrophic carbon nutrition. In: Richmond, A. (Ed.), Handbook of Microalgal Culture: Biotechnology and Applied Phycology. Blackwell Publishing, Oxford, UK, p. 116.
LI, T.; ZHENG, Y.; YU, L.; CHEN, S. 2013. High productivity cultivation of a heat-resistant microalga Chlorella sorokiniana for biofuel production. Bioresource
Technology, 131: 60-67.
LI, T.; ZHENG, Y.; YU, L.; CHEN, S. 2014. Mixotrophic cultivation of a Chlorella sorokiniana strain for enhanced biomass and lipid production. Biomass &
37 LI, T.; GARGOURI, M.; FENG, J.; PARK, J.J.; GAO, D.; MIAO, C.; DONG, T.; GANG, D.R.; CHEN, S. 2015. Regulation of starch and lipid accumulation in a microalga Chlorella sorokiniana. Bioresource Technology, 180: 250-257.
LIANG, Y.; SARKANY, N.; CUI, Y. 2009. Biomass and lipid productivities of
Chlorella vulgaris under autotrophic, heterotrophic and mixotrophic growth
conditions. Biotechnological Letters, 31: 1043-10-49.
LIU, X.; DUAN, S.; LI, A.; XU, N.; CAI, Z.; HU, Z. 2009. Effects of organic carbon source on growth, photosynthesis, and respiration of Phaeodactylum tricornutum. Journal of Applied Phycology, 21: 239-246.
MADIGAN, M.T.; MARTINKO, J.M.; DUNLAP, P.V.; CLARK, D.P. 2016. Microbiologia de Brock. Artmed Editora S.A., Porto Alegre, 1128p.
MAIER, R.M.; PEPPER, I.L.; GERBA, C.P. 2000. Environmental Microbiology. Academic Press, San Diego, 587p.
MARCHELLO, A.E.; LOMBARDI, A.T.; DELLAMANO-OLIVEIRA, M.J.; de SOUZA, C.W.O. 2015. Microalgae population dynamics in photobioreactors with secondary sewage effluent as culture medium. Brazilian Journal of Microbiology, 46(1): 75-84.
MAKANDAR, M.B.; BHATNAGAR, A. 2010. Biodiversity of microalgae and cyanobacteria from freshwater bodies of Jodhpur, Rajasthan (India). Journal of Algal Biomass Utilization, 1(3): 54-69.
MAYO, A.W.; NOIKE, T. 1994. Effect of glucose loading on the growth behavior of
Chlorella vulgaris and heterotrophic bacteria in mixed culture. Water
Research, 28(5): 1001-1008.
McMANUS, G.B.; SCHOENER, D.M.; HABERLANDT, K. 2012. Chloroplast symbiosis in a marine ciliate: ecophysiology and the risks and rewards of hosting foreign organelles. Frontiers in Microbiology, 3: 1-9.
38 METTING JR, F.B. 1996. Biodiversity and application of microalgae. Journal of
Industrial Microbiology, 17: 477-489.
MONTEIRO, C.M.; FONSECA, S.C.; CASTRO, P.M.L.; MALCATA, F.X. 2011. Toxicity of cadmium and zinc in two microalgae, Scenedesmus obliquus and Desmodesmus pleiomorphus, from Northern Portugal. Journal of Applied
Phycology, 23(1): 97-103.
MÜLLER-NAVARRA, D.C.; BRETT, M.; PARK, S.; CHANDRA, S.; BALLANTYNE, A.P.; ZORITA, E.; GOLDMAN, C.R.. 2004. Unsaturated fatty acid content in seston and tropho-dynamic coupling in lakes. Nature, 427: 69–
72.
NELSON, D.L.; COX, M.M. 2014. Princípios de Bioquímica. Artmed Editora S.A., Porto Alegre, 1298p.
NORTON, T.A.; MELKONIAN, M.; ANDERSEN, R.A. 1996. Algal biodiversity. Phycologia, 35(4): 308-326.
ODUM, H.T. 1957. Trophic structure and productivity of Silver Springs, Florida. Ecological Monographs, 27(1): 55-112.
PACE, N.R. 2012. A molecular view of microbial diversity and the biosphere. Science, 276: 734-740.
PEREZ-GARCIA, O.; ESCALANTE, F.M.E.; de-BASHAN, L.E.; BASHAN, Y. 2011. Heterotrophic cultures of microalgae: metabolism and potential products. Water Research, 45: 11-36.
PTACNIK, R.; SOMMER, U.; HANSEN, T; MARTENS, V. 2004. Effects of microzooplankton and mixotrophy in an experimental food web. Limnology and Oceanography, 49: 1435–1445.
RAYMANN, K.; BROCHIER-ARMANET, C.; GRIBALDO, S. 2015. The two-domain tree of life is linked to a new root for the Archaea. Proceedings of the National Academy of Sciences of the United States of America, 112(21): 6670-6675.
39 RODRÍGUES-LÓPEZ. 1966. Utilization of sugars by Chlorella under various
conditions. Journal of General Microbiology, 43: 139-143.
SAFI, C.; ZEBIB, B.; MERAH, O.; PONTALIER, P.Y.; VACA-GARCIA, C. 2014. Morphology, composition, production, processing and applications of Chlorella vulgaris: a review. Renewable and Sustainable Energy Reviews, 35: 265-278.
SHARMA, N.K.; RAI, A.K. 2011. Biodiversity and biogeography of microalgae: progress and pitfalls. Environmental Reviews, 19: 1-15.
SHIHIRA, I.; KRAUS, R.W. 1965. CHLORELLA – Physiology and Taxonomy of Forty-one Isolates. University of Maryland, 101p.
SOROKIN, C. 1959. Tabular comparative data for the low- and high-temperature strains of Chlorella. Nature, 184: 613-614.
SPECHT, E.; MIYAKE-STONER, S.; MAYFIELD, S. 2010. Micro-algae come of age as a platform for recombinant protein production. Biotechnology Letters, 32(10): 1373-1383.
STOECKER, D.K. 1998. Conceptual model of mixotrophy in planktonic protists and some ecological and evolutionary implications. European Journal of Protistology, 34: 281-290.
SUBASHCHANDRABOSE, S.R.; RAMAKRISSHNAN, B.; MEGHRAJ, N.; VENKATESWARLU, K.; NAIDU, R. 2013. Mixotrophic cyanobacteria and microalgae as distinctive agents for organic pollutant degradation. Environment International, 51: 59-72.
TITTEL, J.; BISSINGER, V.; ZIPPEL, B.; GAEDKE, U.; BELL, E.; LORKE, A.; KANJUMKE, N. 2003. Mixotrophs combine resource use to outcompete specialists: implications for aquatic food webs. Proceedings of the National Academy of Sciences of the United States of America, 100: 12776-12781.
40 WAN, M.; LIU, P.; XIA, J.; ROSENBERG, J.N.; OYLER, G.A.; BETENBAUGH, M.J.; NIE, Z.; QIU, G. 2011. The effect of mixotrophy on microalgal growth, lipid content, and expression levels of three pathway genes in Chlorella sorokiniana. Applied Microbiology and Biotechnology, 91: 835-844.
WILKEN, S.; VERSPAGEN, J.M.H.; NAUS-WIEZER, S.; DONK, E.V.; HUISMAN, J. 2014. Biological control of toxic cyanobacteria by mixotrophic predators: an experimental test of intraguild predation theory. Ecological Applications, 24(5): 1235-1249.
WOESE, C.R.; KANDLER, O.; WHEELIS, M.L. 1990. Towards a natural system of organisms: Proposal for the domains Archaea, Bacteria, and Eucarya. Proceedings of the National Academy of Sciences of the United States of America, 87: 4576-4579.
41
42
GENERAL OBJECTIVES
Considering the importance of mixotrophy in the ecosystems and in biotechnology of microalgae, and the lack of information about this metabolic pathway, the present thesis aimed at studying the influence of mixotrophic metabolism in the freshwater microalga Chlorella sorokiniana (Chlorophyta) in relation to its physiology,
biomass production and toxicity responses in medium with organic carbon addition. Thus, our results fill an important gap in the area of phytoplankton's ecophysiology.
Specific Objectives
To accomplish our goal, we divided this thesis into 4 chapters, each one as being one specific objective and are in article format. These specific objectives are presented as follow:
Chapter 1 – Comparative study of growth and photosynthetic responses
of Chlorella sorokiniana (Chlorophyta) under photoautotrophic and
mixotrophic conditions;
Chapter 2 – An investigation onto the effects of glucose on the
biochemical composition of the freshwater microalga Chlorella sorokiniana;
Chapter 3– An investigation onto Cd toxicity to chlorella sorokiniana in
mixotrophy and photoautotrophy: a Bayesian approach;
Chapter 4 – Effects of TiO2 nanoparticles in different metabolic
pathways in the freshwater microalga Chlorella sorokiniana;
Hypothesis
Based on the review on microalgae mixotrophy, we hypothesize that the physiological responses of Chlorella sorokiniana differ if it is either in mixotrophic or
44
45
Comparative Study of Growth and Photosynthetic Responses of
Chlorella
sorokiniana
(Chlorophyta) Under Photoautotrophic and
Mixotrophic Conditions
ABSTRACT
The variety of products derived from microalgae has stimulated studies in the optimization of their growth and cultivation, especially, in mixotrophic conditions. This study aimed at investigating the biomass production and photosynthetic activity of freshwater microalga Chlorella sorokiniana under mixotrophic (1.0 g.L-1 glucose), the
photo-mixotrophic (glucose added in stationary phase) and photoautotrophic conditions (no glucose). The results showed pH changes after glucose addition, reaching pH 11.62 in mixotrophic and 10.47 in photo-mixotrophic cultures, which limited the microalgal growth. Highest biomass was obtained in the mixotrophic culture in comparison with the photo-mixotrophic one. Rapid light saturation curves showed that α (photosynthetic efficiency, 1.69) and rETR (relative electron transport rate, 565.61) were higher in the mixotrophic cultures, whereas the highest Ik (irradiance saturation, 386.68) was
obtained in the photoautotrophic ones. In the photo-mixotrophic cultures, photosynthetic activity varied during glucose consumption, decreasing the maximum quantum yield Fv/Fm after glucose addition, indicating change in metabolism, from
photoautotrophy to mixotrophy by the microalga.
Key word: physiology, mixotrophy, photosynthetic efficiency, microalgae cultivation.
INTRODUCTION
46 others (Perez-Garcia et al., 2011). They can be grown in cultures that do not require large areas of arable lands, being possible to grow them in non-arable land, and depending on species robustness, it can be cultivated in wastewaters and other residual effluents. This can help reduce the costs of their production and decrease the eutrophication potential of effluents (Wan et al., 2011; Li et al., 2014; Marchello et al., 2015).
During photoautotrophic growth, the microalgae perform photosynthesis and take up inorganic carbon (CO2) from the environment as carbon source while using light
(natural or artificial) as energy source (Perez-Garcia et al., 2011). However, as photoautotrophic cultures get denser, their growth become light limited due to self-shading caused by the neighbor microalgae cells (Yang et al., 2000; Perez-Garcia et al., 2011). Considering that some species have the capacity to grow in the absence of light using organic carbon, such as glucose or acetate as carbon and energy sources, these species can eventually reach higher biomass in cultures than strict photoautotrophic ones (Juntila et al., 2015). However, heterotrophic cultures can have increased costs due to the addition of an organic carbon source at the same time that it can stimulate the growth of undesirable microorganisms (Ip et al., 1982; Giovanardi et al., 2014; Li et al., 2014) that can impair the algal growth.
Due to the capacity of microalgae to adjust their metabolism, most studies have considered mixotrophic cultivation as a method for achieving high biomass densities in a short period of time (Giovanardi et al., 2014; Li et al., 2014). Mixotrophy is a process whereby CO2 and organic carbon are simultaneously used by the microalgae as carbon
source. In mixotrophy, oxidative processes, like photosynthesis and respiration, can occur concurrently, generating energy for the microalgae (Heredia-Arroyo et al., 2010; Gionavardi et al., 2014). In several studies, microalgae cultures in mixotrophic growth outperformed the sum of photoautotrophic and heterotrophic conditions (Li et al., 2014).
47 uptake of organic carbon for the production of ATP (adenosine triphosphate) by oxidative phosphorylation (Heredia-Arroyo et al., 2010).
Mixotrophic growth is less susceptible to photoinhibition and photooxidative damages, especially in closed bioreactors that accumulate oxygen (Li et al., 2014), and light determines the consumption of organic carbon during mixotrophy (Rodríguez-López, 1966). In some species, as Chlorella sorokiniana, cells grew faster under light
intensities between 100 and 500 µmol photons m-2 s-1 (Li et al., 2014), however, in C.
vulgaris, the blue light can inhibits the expression of the hexose/H+ symport protein
genes (Perez-Garcia et al., 2011). One of the advantages of mixotrophy in microalgae cultures is that the excess of oxygen gas released through photosynthesis in closed bioreactors can be used by the cells during the aerobic respiration of the organic carbon added to the medium, reducing the photooxidative damages (Chojnacka & Noworyta, 2004).
In spite of the potential of the mixotrophy approach for microalgae production, studies focusing in the physiology mechanisms during mixotrophy in these organisms are scarce (Wijffels & Barbosa, 2010; Giovanardi et al., 2014). Among the variety of organic carbon sources used for both mixotrophy and heterotrophy in microalgae that can be found in literature, glucose (C6H12O6) has been the most used one (Mayo et al.,
1994; Giovanardi et al., 2014). Glucose molecule carries more energy than other sources of organic carbon, for example, 1 mol of glucose generates approximately 2.8 kJ.mol-1 of energy for the cell compared to ~ 0.8 kJ.mol-1 from acetate (Perez-Garcia et
al., 2011). In Chlorella sp, glucose changes the metabolic pathways of carbon
assimilation, the size of the cells and the volume of storage material (starch, lipids, protein, chlorophyll, RNA and vitamins; Martinez et al., 1991). Chlorella sp possess a
hexose/H+ symport system in its membrane responsible for the uptake of glucose from
the medium, creating an eletrogenic potential (Tanner, 1969; Komor, 1973; Komor & Tanner, 1974, 1976).
Another aspect that influences the health of microalgae and their production is the photosynthetic efficiency. This can be determined by the use of variable chlorophyll
48 heat, or fluorescence. According to Schreiber et al. (2002), the proportion of energy used for photochemical reactions and the amount of fluorescence emission from chlorophyll a is inversely related. To determine the photosynthetic efficiency in
microalgae, a rapid and non-invasive technique known as pulse amplitude modulated (PAM) fluorometry (Schreiber et al., 2002; White et al., 2011) has been widely used. This technique allows the determination of the maximum quantum efficiency of photosystem II, PSII (Fv/Fm, the maximum total energy absorbed by chloroplasts when
exposed to photosynthetically supersaturating light), the photochemical energy (qP,
energy that is directed to photochemical reactions), and non-photochemical energy (NPQ, energy that is dissipated mostly as heat, not used in photosynthesis) by microalgae cells (Müller et al., 2001; Hendrickson et al., 2004).
Among the microalgae commonly investigated in mixotrophy, the genus
Chlorella dominates; because it is robust, shows fast growth and has great importance
in the food industry, as production of lipids (Rodríguez-López, 1966; Rosemberg et al., 2014; Li et al., 2015). Among the species of this genus, it has been shown that Chlorella sorokiniana is a good candidate for mixotrophic growth because of its ability to grow in
organic carbon sources (Wan et al., 2011; Rosenberg et al., 2014). However, details of the physiology of this microalga under mixotrophic conditions are important to optimize its potential for biotechnological applications (Wijffel & Barbosa, 2010).
In the present study, the green microalgae Chlorella sorokiniana (Chlorophyta)
49 MATERIAL AND METHODS
Algal cultures and experimental design
The microalga Chlorella sorokiniana (Chlorophyta); it was obtained from the
freshwater microalgae culture collection at Federal University of São Carlos, Brazil (WDCM 835). Unialgal cultures were performed in 1000 mL Erlenmeyer flasks containing 500 mL of modified rich nutrient BG11 medium (Rippka et al., 1979). Controlled conditions of temperature (24 ± 1 °C), light intensity (190 µmol photons m-2
s-1) and photoperiod (12 h light/12 h dark) were used throughout. Illumination was
applied at the bottom of the flasks, with an optical path inside the flasks of ~ 7 cm, and the intensity used is among the range proposed by Li et al. (2014) for growth of C. sorokiniana, e.g., 100 – 500. Shaking was performed four times daily by hand. The
initial inoculum (105 cells.mL-1) was obtained from exponentially growing cultures
acclimated in the same conditions as they would be submitted to. The inoculum, which was cultivated in photoautotrophic conditions, showed Fv/Fm (maximum quantum
efficiency) of 0.70. This value suggesting healthy cells and agrees with previous literature (Kumar et al., 2014).
Three culture conditions (photoautotrophic, mixotrophic and photo-mixotrophic) with three experimental replicates were performed. The photoautotrophic cultures contained just the modified BG11 (inorganic) medium according to that described in Rippka et al. (1979). In the mixotrophic culture conditions, glucose was added in the concentration of 5 x 10⁻³ mol.L-1 (1 g.L-1) as organic carbon source in the beginning of
50 mixotrophic), the culture was grown first under the photoautotrophy up to stationary phase (4th culture day), after which, 5 x 10⁻³ mol.L-1 glucose was added.
pH and Chlorophyll a
Samples were taken daily and at the same time in the morning. pH was determined with a pH-meter (HANNA® Instruments, USA), while chlorophyll a
concentration was determined by in vivo fluorescence using a fluorimeter (Turner
Designs, Model Trilogy – U.S.A.). The concentration of chlorophyll a was obtained
from a calibration curve performed by plotting fluorescence intensity vs concentration
of chlorophyll a from exponentially growing cultures of Chlorella sorokiniana. This
resulted in a linear curve that was adjusted through linear regression and the equation used for calculating the concentration of chlorophyll a in the samples.
Cell Density and Specific Growth Rate
The number of cells in the culture was quantified daily in a cytometer Muse® Cell Analyzer (Merck Millipore) and the results expressed in cell.mL-1. The specific
growth rates (µ) were calculated through graphic representation of the natural logarithm of the number of cells per mL as function of time. The linear regression from the straight line so obtained was calculated for the exponential growth phase. In this case, the angular coefficient represents the specific growth rate. For its calculation, we used the first 4 points of figure 1.1B, e.g., data points at days 0, 1, 2 and 3.
To determine if the growth curves showed sigmoidal behavior, the Boltzman adjustment (1872) was used, using chlorophyll a (mg.L-1) data measured daily, in
accordance with the equation I:
y(t) = [B/1 + e-(t-τ).μ] + A (I)
where y(t) is the chlorophyll a concentration (mg.L-1), B is the maximum point of the
curve with the same unit of y(t), A is the initial value with the same unit of y(t), t is time, τ is the parameters that determines the inflection point of the curve, and μ is the