musculoskeletal system
Su Ji Kim, Hee Jin Park, So Yeon Lee
Department of Radiology, Kangbuk Samsung Hospital, Sungkyunkwan University School of Medicine, Seoul, Korea
http://dx.doi.org/10.14366/usg.15072 pISSN: 2288-5919 • eISSN: 2288-5943
Ultrasonography 2016;35:104-109
Received: November 5, 2015 Revised: December 21, 2015 Accepted: December 23, 2015
Correspondence to:
Hee Jin Park, MD, Department of Radiology, Kangbuk Samsung Hospital, Sungkyunkwan University School of Medicine, 29 Saemunan-ro, Jongno-gu, Seoul 03181, Korea
Tel. +82-2-2001-1035 Fax. +82-2-2001-1030 E-mail: parkhiji@gmail.com
REVIEW ARTICLE
This is an Open Access article distributed under the terms of the Creative Commons Attribution Non-Commercial License (http://creativecommons.org/ licenses/by-nc/3.0/) which permits unrestricted non-commercial use, distribution, and reproduction in any medium, provided the original work is properly cited.
Copyright © 2016 Korean Society of Ultrasound in Medicine (KSUM)
How to cite this article:
KimSJ, ParkHJ, LeeSY.Usefulness of strain elastography of the musculoskeletal system. Ultrasonography. 2016 Apr;35(2):104-109. Ultrasound elastography is a widely used technique for assessing the mechanical characteristics of
tissues. Although there are several ultrasound elastography techniques, strain elastography (SE) is currently the most widely used technique for visualizing an elastographic map in real time. Among its various indications, SE is especially useful in evaluating the musculoskeletal system. In this article, we review the SE techniques for clinical practice and describe the images produced by these techniques in the context of the musculoskeletal system. SE provides information about tissue stiffness and allows real-time visualization of the image; however, SE cannot completely replace gray-scale, color, or power Doppler ultrasonography. SE can increase diagnostic accuracy and may be useful for the follow-up of benign lesions.
Keywords: Soft tissue neoplasms; Elasticity imaging techniques; Ultrasonography
Introduction
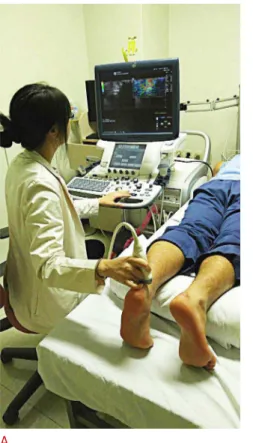
While B-mode and Doppler imaging provide tissue information depending on acoustic impedance and vascular low, ultrasound elastography independently provides information about tissue stiffness [1-7]. By applying a stress to the tissue, the sonographer causes internal tissue changes that are dependent on the elastic properties of the tissue [8]. Strain elastography (SE), shear wave elastography, transient elastography, and acoustic radiation force elastography are the main techniques widely used by clinical practitioners and among those, SE is the most common technique allowing real-time visualization of an image on the display screen [7,9-14]. The stress is usually applied manually via a hand-held ultrasound transducer (free-hand SE), which provides low-frequency compression (Fig. 1) [15-21].
Basic Physics of SE
information is overlapped over the B-mode sonogram and allows for direct visualization of the strain distribution map. This “elastogram” is usually color-coded, unlike the gray-scale sonogram of the B-mode ultrasonography [1-3]. Stress causes tissue deformation, and the consequent elastogram is visualized as a split-screen concurrent with the conventional B-mode sonogram. Tissue stiffness is displayed in a spectrum of colors from red (usually soft tissue, though variable) to blue (hard tissue) (Fig. 2) [8]. Several factors such as the strength of force, different tissue depths, probe alignment, and out-of-plane movements of the transducer are complicating factors that can result from manual compression [1-3]. Therefore, SE is a largely qualitative or semi-quantitative imaging technique, and an elastogram is a relative image to be used for visual comparison only [8].
Plantar Fasciitis
Plantar fasciitis is one of the common causes of non-traumatic heel pain, which can be reduced by applications such as steroid injection [22,23]. Typical ultrasonographic findings of plantar fasciitis are a thickened plantar fascial layer, loss of normal striation, a hypo-echoic lesion within the fascia, and peri-fascial luid. However, these radiologic changes are not always seen [24,25]. Lee et al. [26] retrospectively reviewed SE indings of 18 patients’ feet who were diagnosed based on a clinical history and physical examination but
showed normal findings on conventional ultrasonography, as well as those of 18 asymptomatic feet. The results showed signiicantly softer plantar fascia in patients with plantar fasciitis than in the control group. These findings indicate that fascial softening witnessed on elastography precedes morphologic changes visible on B-mode imaging. Therefore, SE provides information about the mechanical properties of the plantar fascia during the very early stage of inlammation, before macroscopic changes take place (Fig. 3) [26]. SE does not require additional software or hardware and is therefore easy to perform, and may be useful in providing useful information on the plantar fascia [26]. Inter-observer agreement of SE findings is also superb, as the plantar fascia is a superficial structure, with minimal variation in depth from one patient to another [26].
Achilles Tendon
In a study of healthy volunteers and their ultrasonographically normal Achilles tendons using conventional ultrasonography, the normal tendons showed two distinct SE patterns. They were either homogeneously hard or, mostly (more than 60%), considerably inhomogeneous soft structures (longitudinal bands or spots), which did not match any findings in ultrasonography or Doppler ultrasonography [16]. In two studies by the same research group,
Fig. 1. An example of performing strain elastography for musculoskeletal system.
A, B. Strain elastography enables real-time gray-scale ultrasonography and a corresponding color map with detail on various parameters. Frq, frequency; Gn, gain; D, dynamic range; AO%, acoustic output; T, threshold; L/A, line density/frame average; PRF, pulse representative frequency.
A
the authors compared asymptomatic and symptomatic tendons, and the asymptomatic tendons tended to be consistently hard in most cases (86%-93%), and some contained mild softening (7%-12%) and marked softening (0%-1.3%). On the other hand, symptomatic tendons showed significant softening in 57%, mild softening in 11%, and no softening (hard structures) in 32% of cases [17,18]. SE may be superior to B-mode ultrasonography in detecting early histopathologic degeneration of Achilles tendinosis [27]. The reasons for the difference between ultrasonography and SE have not yet been verified, but early changes in the Achilles tendon or false-positive cases could contribute to the difference [27].
Torticollis
Congenital muscular torticollis (CMT) is a common congenital disorder in neonates and infants, showing incidence of 0.3% to 1.9% [28-30]. In previous studies, ultrasonographic findings showed focal or diffuse thickening in the lower two-thirds of the sternocleidomastoid muscle (SCM), with the size of the lesions ranging from 8 to 15.8 mm at the maximal transverse diameter
and the length ranging from 13.7 to 45.8 mm [31]. The lesions were hyper-echoic in 49% and of mixed echogenicity in 49% [32]. However, there are some limitations in evaluating CMT using ultrasonography. First, the size of the SCM can decrease after physical therapy, which can affect its thickness and echogenicity [30,33]. In addition, the echogenicity and the maximum thickness of the SCM range widely, and for those demonstrating subtle changes, the diagnosis of CMT using ultrasonography can be challenging [31-34]. According to Lee et al. [33], the SCM in patients with CMT had decreased elasticity compared to normal muscles, and SE showed stiffness of the tightened SCM in those subjects (Fig. 4). The authors concluded that, in cases with inconclusive results of B-mode ultrasonography, SE may be a subordinate tool to evaluate CMT [33].
Soft Tissue Tumor
According to Lalitha et al. [35], malignant tumors are generally stiffer than benign tumors and appear as blue alterations on SE. Lipomas ranged in color from red to blue on SE, vascular soft tissue tumors such as hemangiomas were red to green (with no blue), and
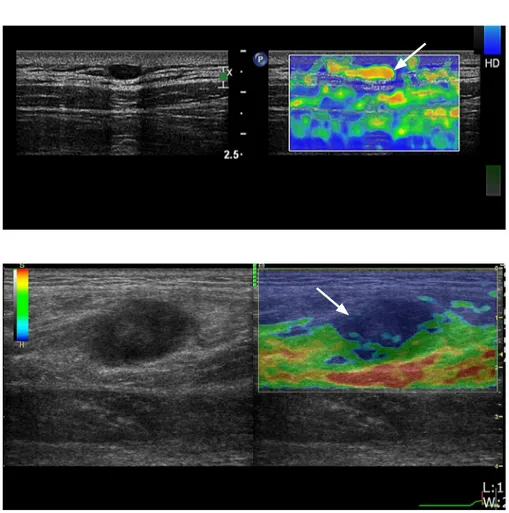
Fig. 2. A case of epidermoid tumor. A 14-year-old boy presented with a palpable mass in the right posterior thigh. Gray-scale sonogram (left) shows a well-defin-ed heterogeneous mass with posterior enhancement. Strain elastography (right) shows a blue color in the mass, suggesting a hard nature (arrow).
neurogenic tumors were green (no blue) [35]. Some areas of the lesions had no color (black sign). These could have been artifacts; however, they correlated with malignant lesions [35]. Park et al. [36] evaluated ultrasonographic features of supericial epidermoid tumors (ET) with an emphasis on SE features that might help differentiate ET from other benign soft tissue tumors and malignant soft tissue tumors. They retrospectively evaluated ultrasonography and SE data of 103 surgically-conirmed supericial soft-tissue tumors and tumor-like lesions. There were signiicant differences in echogenicity between ET and other benign tumors and between malignant and
benign tumors [36]. Malignant tumors showed higher SE scores (3-4, hard nature) than did ET or other benign soft tissue tumors (Figs. 5, 6). There were no differences in SE score between ET and other benign tumors. Superficial ET demonstrates a softer nature than malignant tumors; however, it does not have a different SE pattern from other benign tumors [36].
Technical Aspects and Performing Adequate SE
If a tumor is located near bone, it may show more strain than those
Fig. 4. A case of congenital muscular
torticollis. A 5-month-old boy underwent
ultrasonography due to head tilting to the right side. Short-axis gray-scale sonogram (left) reveals marked thickening of the sternocleidomastoid muscle (arrow) with heterogeneous echogenicity. Simultaneous strain elastography (right) shows a pre-dominantly blue area within the sternocle-idomastoid muscle (arrowhead), represent-ing a stiff consistency.
Fig. 6. A case of lymphoma. A 59-year-old man presented with a mass on his posterior leg. Gray-scale ultrasonogram shows a hypoechoic lesion 20 mm×10 mm in size in the muscle layer, colored blue on strain elastography (arrow).
located far from bone [37]. When examining a subcutaneous tumor, not only the vertical force applied to it, but also the reaction from the adjacent bone to the tumor decreases the lesion’s elasticity as the distance decreases [37]. It is important for the examiner to decide how much pressure to apply to the tissue [8]. Because there is a direct proportion between the pressure applied on the skin and the strain produced, the pressure should be moderate to make the linear elastic properties as expected [6]. Currently, many computerized techniques and software compose SE systems and can provide visual feedback to ensure the correct application of pressure when used in conjunction with sonograms [8]. The evaluator of an elastogram should consider going through the entire cine loops, because the static images have higher chances of intra-observer variation or transient temporal fluctuations [15,18,34]. Most radiologists choose representative images from the compression cycle and from the middle of each cycle from cine loops of at least three compression-relaxation cycles to assess the elastograms, because the calculations of the elastogram at the first and last section of each cycle are often incorrect [16-18].
The lack of quantitative measurements is another major problem in SE [8], and this has led many researchers to develop various methods to assess elastograms. Semi-quantitative measurements such as the strain ratio, qualitative and visual assessment of elastograms using patterns, scores or grades, or commercially available external computer software are used to make assessments [15-18,35,36]. However, these various and complicated systems have led to considerable confusion in interpreting findings of different studies, as well as a lack of reproducibility and difficulty in comparing the results, even if the same technique is applied in all cases [8]. Several issues should be considered when using SE for examining musculoskeletal tissue. In contrast to conventional musculoskeletal ultrasonography, in which the radiologist has to apply minimal pressure to avoid the distortion of underlying tissues (e.g., synovial fluid or bursitis), SE requires a certain amount of pressure to allow the correct application of the technique [8]. The B-mode appearance inluences SE data, so the probe should always be held perpendicular to the tissue to reduce anisotropy [16-18]. It is well known that reproducing images of the Achilles tendon in the longitudinal view is superior to that of the transverse view because of more frequent artifacts at the medial and lateral sides of the image due to unilateral pressure and out-of-plane movements of the transducer [15]. This can also be applied to other tendons, and radiologists should take into account that images of all tendons in transverse images have inferior quality [15]. Non-homogenous application of pressure on a lesion can cause changes in elasticity at the borders [15-18,34]; therefore, in this case, overlapping images can help overcome this problem (Fig. 1) [8]. When examining body
parts with prominent bony projections, for example, superficial protuberant masses, it is difficult to apply uniform compression, which is another limitation of SE [34]. Another standardization problem is the distance between the probe and the tissue we need to examine. The minimum distance needed to evaluate an elastogram is usually 1.2 mm in most ultrasound systems, and gel pads or probe adaptors may help increase the distance between the skin and probe, which is especially important when examining thin people with little subcutaneous fat [8,16-19].
Conclusion
SE provides information about tissue stiffness and allows real-time visualization of the image; however, SE cannot replace gray-scale, color, or power Doppler ultrasonography. SE can increase diagnostic accuracy in combination with those other imaging techniques, and may be useful for the follow-up of benign lesions.
ORCID: Su Ji Kim: http://orcid.org/0000-0002-1721-3489; Hee Jin Park: http://orcid. org/0000-0002-3135-0586; So Yeon Lee: http://orcid.org/0000-0002-0109-0998
Conlict of Interest
No potential conlict of interest relevant to this article was reported.
References
1. Hall TJ. AAPM/RSNA physics tutorial for residents: topics in US: beyond the basics: elasticity imaging with US. Radiographics 2003;23:1657-1671.
2. Garra BS. Imaging and estimation of tissue elasticity by ultrasound. Ultrasound Q 2007;23:255-268.
3. Garra BS. Elastography: current status, future prospects, and making it work for you. Ultrasound Q 2011;27:177-186.
4. Ophir J, Cespedes I, Ponnekanti H, Yazdi Y, Li X. Elastography: a quantitative method for imaging the elasticity of biological tissues. Ultrason Imaging 1991;13:111-134.
5. Lerner RM, Huang SR, Parker KJ. "Sonoelasticity" images derived from ultrasound signals in mechanically vibrated tissues. Ultrasound Med Biol 1990;16:231-239.
6. Itoh A, Ueno E, Tohno E, Kamma H, Takahashi H, Shiina T, et al. Breast disease: clinical application of US elastography for diagnosis. Radiology 2006;239:341-350.
7. Pallwein L, Mitterberger M, Struve P, Pinggera G, Horninger W, Bartsch G, et al. Real-time elastography for detecting prostate cancer: preliminary experience. BJU Int 2007;100:42-46.
fasciitis: sonographic evaluation. Radiology 1996;201:257-259. 24. Wu CH, Chen WS, Wang TG, Lew HL. Can sonoelastography detect
plantar fasciitis earlier than traditional B-mode ultrasonography? Am J Phys Med Rehabil 2012;91:185.
25. Chang JM, Moon WK, Cho N, Kim SJ. Breast mass evaluation: factors influencing the quality of US elastography. Radiology 2011;259:59-64.
26. Lee SY, Park HJ, Kwag HJ, Hong HP, Park HW, Lee YR, et al. Ultrasound elastography in the early diagnosis of plantar fasciitis. Clin Imaging 2014;38:715-718.
27. Klauser AS, Miyamoto H, Tamegger M, Faschingbauer R, Moriggl B, Klima G, et al. Achilles tendon assessed with sonoelastography: histologic agreement. Radiology 2013;267:837-842.
28. Bredenkamp JK, Hoover LA, Berke GS, Shaw A. Congenital muscular torticollis: a spectrum of disease. Arch Otolaryngol Head Neck Surg 1990;116:212-216.
29. Ho BC, Lee EH, Singh K. Epidemiology, presentation and management of congenital muscular torticollis. Singapore Med J 1999;40:675-679.
30. Park HJ, Kim SS, Lee SY, Lee YT, Yoon K, Chung EC, et al. Assessment of follow-up sonography and clinical improvement among infants with congenital muscular torticollis. AJNR Am J Neuroradiol 2013;34:890-894.
31. Dudkiewicz I, Ganel A, Blankstein A. Congenital muscular torticollis in infants: ultrasound-assisted diagnosis and evaluation. J Pediatr Orthop 2005;25:812-814.
32. Chan YL, Cheng JC, Metreweli C. Ultrasonography of congenital muscular torticollis. Pediatr Radiol 1992;22:356-360.
33. Lee SY, Park HJ, Choi YJ, Choi SH, Kook SH, Rho MH, et al. Value of adding sonoelastography to conventional ultrasound in patients with congenital muscular torticollis. Pediatr Radiol 2013;43:1566-1572.
34. Bhatia KS, Rasalkar DD, Lee YP, Wong KT, King AD, Yuen YH, et al. Real-time qualitative ultrasound elastography of miscellaneous non-nodal neck masses: applications and limitations. Ultrasound Med Biol 2010;36:1644-1652.
35. Lalitha P, Reddy M, Reddy KJ. Musculoskeletal applications of elastography: a pictorial essay of our initial experience. Korean J Radiol 2011;12:365-375.
36. Park HJ, Lee SY, Lee SM, Kim WT, Lee S, Ahn KS. Strain elastography features of epidermoid tumours in supericial soft tissue: differences from other benign soft-tissue tumours and malignant tumours. Br J Radiol 2015;88:20140797.
37. Lee SY, Park HJ, Jeh SK. Factors influencing the finding of strain ultrasound elastography in benign subcutaneous tumors. J Korean Soc Ultrasound Med 2013;32:27-32.
Y. Differential diagnosis of thyroid nodules with US elastography using carotid artery pulsation. Radiology 2008;248:662-669. 10. Thomas A, Kummel S, Gemeinhardt O, Fischer T. Real-time
sonoelastography of the cervix: tissue elasticity of the normal and abnormal cervix. Acad Radiol 2007;14:193-200.
11. Saftoiu A, Vilmann P, Hassan H, Gorunescu F. Analysis of endoscopic ultrasound elastography used for characterisation and differentiation of benign and malignant lymph nodes. Ultraschall Med 2006;27:535-542.
12. Janssen J, Schlorer E, Greiner L. EUS elastography of the pancreas: feasibility and pattern description of the normal pancreas, chronic pancreatitis, and focal pancreatic lesions. Gastrointest Endosc 2007;65:971-978.
13. Friedrich-Rust M, Ong MF, Herrmann E, Dries V, Samaras P, Zeuzem S, et al. Real-time elastography for noninvasive assessment of liver fibrosis in chronic viral hepatitis. AJR Am J Roentgenol 2007;188:758-764.
14. Park GY, Kwon DR. Application of real-time sonoelastography in musculoskeletal diseases related to physical medicine and rehabilitation. Am J Phys Med Rehabil 2011;90:875-886.
15. Drakonaki EE, Allen GM, Wilson DJ. Real-time ultrasound elastography of the normal Achilles tendon: reproducibility and pattern description. Clin Radiol 2009;64:1196-1202.
16. De Zordo T, Chhem R, Smekal V, Feuchtner G, Reindl M, Fink C, et al. Real-time sonoelastography: indings in patients with symptomatic achilles tendons and comparison to healthy volunteers. Ultraschall Med 2010;31:394-400.
17. De Zordo T, Fink C, Feuchtner GM, Smekal V, Reindl M, Klauser AS. Real-time sonoelastography findings in healthy Achilles tendons. AJR Am J Roentgenol 2009;193:W134-W138.
18. Klauser AS, Faschingbauer R, Jaschke WR. Is sonoelastography of value in assessing tendons? Semin Musculoskelet Radiol 2010;14: 323-333.
19. Sconienza LM, Silvestri E, Cimmino MA. Sonoelastography in the evaluation of painful Achilles tendon in amateur athletes. Clin Exp Rheumatol 2010;28:373-378.
20. De Zordo T, Lill SR, Fink C, Feuchtner GM, Jaschke W, Bellmann-Weiler R, et al. Real-time sonoelastography of lateral epicondylitis: comparison of indings between patients and healthy volunteers. AJR Am J Roentgenol 2009;193:180-185.
21. Ying L, Hou Y, Zheng HM, Lin X, Xie ZL, Hu YP. Real-time elastography for the differentiation of benign and malignant supericial lymph nodes: a meta-analysis. Eur J Radiol 2012;81:2576-2584.
22. Kamel M, Kotob H. High frequency ultrasonographic findings in plantar fasciitis and assessment of local steroid injection. J Rheumatol 2000;27:2139-2141.