www.atmos-chem-phys.net/13/1569/2013/ doi:10.5194/acp-13-1569-2013
© Author(s) 2013. CC Attribution 3.0 License.
Atmospheric
Chemistry
and Physics
Geoscientiic
Geoscientiic
Geoscientiic
Geoscientiic
Sources of anions in aerosols in northeast Greenland during late
winter
M. Fenger1, L. L. Sørensen2,3, K. Kristensen1, B. Jensen2, Q. T. Nguyen1,2, J. K. Nøjgaard2, A. Massling2, H. Skov2,3,4, T. Becker2, and M. Glasius1
1Department of Chemistry and iNANO, Aarhus University, 8000 Aarhus, Denmark 2Department of Environmental Science, Aarhus University, 4000 Roskilde, Denmark 3Arctic Research Centre, Aarhus University, 8000 Aarhus, Denmark
4Institute of Chemical Engineering, Biotechnology and Environmental Technology, University of Southern Denmark,
5230 Odense M, Denmark
Correspondence to:L. L. Sørensen (lls@dmu.dk)
Received: 4 March 2012 – Published in Atmos. Chem. Phys. Discuss.: 11 June 2012 Revised: 17 December 2012 – Accepted: 8 January 2013 – Published: 7 February 2013
Abstract.The knowledge of climate effects of atmospheric aerosols is associated with large uncertainty, and a better understanding of their physical and chemical properties is needed, especially in the Arctic environment. The objec-tive of the present study is to improve our understanding of the processes affecting the composition of aerosols in the high Arctic. Therefore size-segregated aerosols were sam-pled at a high Arctic site, Station Nord (Northeast Green-land), in March 2009 using a Micro Orifice Uniform De-posit Impactor. The aerosol samples were extracted in order to analyse three water-soluble anions: chloride, nitrate and sulphate. The results are discussed based on possible chemi-cal and physichemi-cal transformations as well as transport patterns. The total concentrations of the ions at Station Nord were 53–507 ng m−3, 2–298 ng m−3 and 535–1087 ng m−3
for chloride (Cl−
), nitrate (NO−3) and sulphate (SO24−), re-spectively. The aerosols in late winter/early spring, after po-lar sunrise, are found to be a mixture of long-range trans-ported and regional to local originating aerosols. Fine parti-cles, smaller than 1 µm, containing SO2−
4 , Cl
−and NO−
3, are
hypothesized to originate from long-range transport, where SO2−
4 is by far the dominating anion accounting for 50–
85 % of the analyzed mass. The analysis suggests that Cl−
and NO−
3 in coarser particles (>1.5 µm) originate from
lo-cal/regional sources. Under conditions where the air mass is transported over sea ice at high wind speeds, very coarse particles (>18 µm) are observed, and it is hypothesized that frost flowers on the sea ice are a source of the very coarse nitrate particles.
1 Introduction
The changing climate is of increasing concern among politi-cians, scientists and the general population. There are still many important climatic subjects, where our understand-ing is insufficient (IPCC, 2007). The largest temperature in-crease, due to climate change, is observed in the high Arctic, where the observed temperature increase is twice as high as at mid-latitudes, and the increase is expected to continue in the future (ACIA, 2004; Quinn et al., 2008). Therefore an en-hanced understanding of the climate dynamics in this parti-cular area is highly needed; however measurements and stu-dies of the atmospheric chemistry at the high Arctic are still very limited due to its remote location and the small number of sites where measurements are made.
The presence of aerosols in the atmosphere affects the environment in multiple ways. One of the most significant effects is the scattering of incoming solar radiation result-ing in a net coolresult-ing of air; thereby offsettresult-ing part of the global warming induced by greenhouse gases (Haywood and Boucher, 2000; Jacobson, 2001). However, climate forcing from aerosols still requires focus and in-depth studies since it is one of the largest uncertainties in predicting future climate by models according to the Intergovernmental Panel on Cli-mate Change (IPCC, 2007). These studies are complicated by the fact that the physical and chemical properties of aerosols are highly variable in both time and space.
scattering efficiency of an atmospheric layer depends on the size segregated chemical composition of the atmospheric aerosol. Water-soluble inorganic anions strongly determine the sub-saturated growth of particles under atmospheric con-ditions, and their ability to form clouds (e.g. Swietlicki et al., 2008).
About three decades ago, it was discovered, that a con-siderable part of the Arctic atmosphere becomes highly pol-luted during winter because of the accumulation of Eurasian pollutants, creating what became generally known as “Arc-tic haze” (Flyger et al., 1980; Barrie et al., 1981; Heidam et al., 2004; Glasow and Crutzen, 2007). Arctic haze aerosols consist primarily of sulphate (SO2−
4 ) and particulate organic
matter in addition to ammonium (NH+4), nitrate (NO−3) and black carbon (BC) (e.g. Li and Barrie, 1993; Quinn et al., 2002). The Arctic haze phenomenon results in a characteris-tic annual variation of SO24−, NO−3 and anthropogenically de-rived elements (e.g. Heidam et al., 2004; Quinn et al., 2007). Concentrations of aerosols in high Arctic air (Polissar et al., 2001) and snow (Douglas and Sturm, 2004) are at their high-est during late winter and early spring when anthropogenic pollution is most efficiently transported from lower latitudes (e.g. Heidam, et al., 2004). Thus combustion sources at other continents influence and partly determine the composition of the aerosols observed in the high Arctic. Late winter and early spring is also accompanied by significant increases in the amount of solar radiation reaching the surface and initi-ating the photochemistry in the Arctic atmosphere and at/in the snowpack. Photochemistry in the snowpack can result in production of e.g. NOxwhich can be emitted from the snow
into the atmosphere (Domine and Shepson, 2002; Grannas et al., 2007), where photochemical oxidation of gases can lead to formation of secondary aerosols such as NO−3 and SO2−
4 (Barrie and Hoff, 1984; Grannas et al., 2007).
There-fore both long-range transport and local processes influence the composition of Arctic aerosols, and subsequently the sys-tem becomes very complex. As a consequence it is important to obtain a better understanding of the physical and chemical dynamics of the particles in the Arctic region.
Studies at Station Nord have reported SOx
(SOx=SO2+SO24−) and total NO
−
3 (total NO
−
3 =NO
−
3
particle + HNO3 gas) with a typical Arctic haze pattern
(Heidam et al., 1999; Heidam et al., 2004, Nguyen et al., 2013). Reported weekly concentrations of total NO−3 during a study period from 1990–2001 range from a few ng m−3to
approximately 130 ng m−3in March while reported weekly
mean concentrations of SOxfor the same period were up to
750 ng m−3(Heidam et al., 2004). A recent study by Nguyen
et al. (2013) for the period from March 2008–February 2010 has indicated the Siberian industries as the largest sources of total SOxwhile Cl−was mostly attributed to marine sources.
In this paper we present the size fractionated main inor-ganic anion components: Cl−, NO−
3 and SO 2−
4 in aerosols
measured at a high Arctic site in northeast Greenland. The
sampling of size-segregated aerosols was performed shortly after polar sunrise. The objective is to improve the under-standing of the processes influencing the chemical composi-tion of aerosols in the high Arctic atmosphere by discussing the results as a function of sources, physical and chemical transformations, and transport patterns.
2 Method
2.1 Logistics
Atmospheric measurements were carried out at Station Nord the first time in the late 1970s (Flyger et al., 1980) and have taken place continuously since the late 1990s (Heidam et al., 2004). Station Nord is located in a remote area in northeast Greenland at 81◦36′N, 16◦40′W (Fig. 1a). It is a small
mil-itary installation inhabited by a permanent staff of five, and with relatively few guests (scientists and others) throughout the year, mainly during summer.
The sampling site, Flygers Hut, is located approximately 2 km south of the main building complex at an altitude of 25 m a.s.l. (Fig. 1b). The area is a fairly flat peninsula of about 10 km×10 km. During winter Station Nord is
recur-rently exposed to Eurasian air masses coming from northern and eastern directions (Heidam et al., 1999).
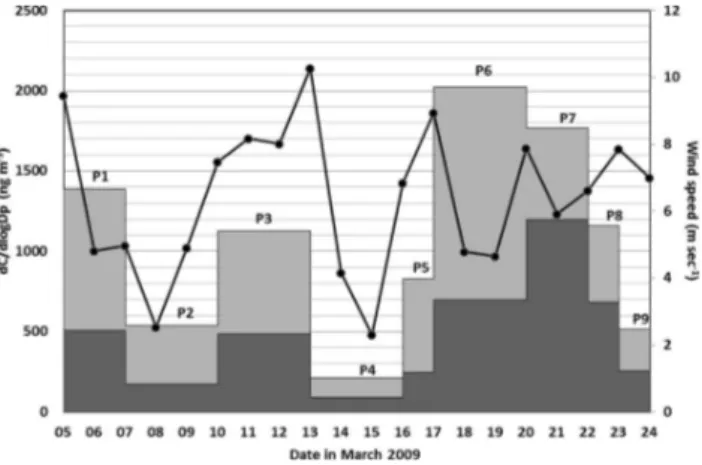
Aerosols were sampled from 5 to 24 March 2009 just af-ter polar sunrise. The length of the days increased rapidly, with the sun above the horizon for a few minutes in the be-ginning of the sampling period, to 20 h a day in the end. Throughout the sampling period the temperature was on av-erage −40◦C, varying between −18◦C and −45◦C. The
wind speed ranged between 1 and 8 m s−1, except during
the night of 13 March, on 16–17 March and on 21 March when the wind speed reached 10 m s−1. The measurement
of wind speed at Station Nord is carried out by the use of cup anemometers, which often freeze at low tempera-tures and therefore the uncertainty of wind speed measure-ments is large. Here we use reanalysis data from NCEP/DOE AMIP-II (Kanamitsu et al., 2002) for wind speed estimates at 1000 mbar (Fig. 2) recognizing that these data are also associated with large uncertainty, especially in the Arctic. Comparing reanalysis data to measured data, using a sonic anemometer (METEK-USA) in spring 2011 (Fig. S1), shows weak correlation (R=0.38). However the measured and modelled data generally show the same trend in the magni-tude of the wind speed. The wind speed data are estimated at 1000 mbar and the ground pressure was at times lower dur-ing the measurement campaign, yet a comparison of wind speeds for 1000, 925 and 800 mbar shows no big difference in the wind speed.
2.2 Sampling and analysis
Fig. 1. (a)Greenland with the location of Station Nord and(b)the position of the air monitoring site Flyger’s Hut at Station Nord (Hei-dam et al., 1999).
Fig. 2.Particle mass collected by the MOUDI during the different sampling periods (Px) in March 2009 shown for particles where D >1.8 µm (dark grey) and D <1.8 µm (light grey). The 24-h mean wind speed (m s−1) at Long 16.5◦W Lat 81.5◦N is also
shown as dots connected by a curve. The wind data are reanalysis data from NCEP/DOE AMIP II.
Corporation, Model 110-R at a flow rate of 30 L min−1. The
sampler was operated with 11 fractionation stages, and the aerodynamic cut-off diameters (particle sizes corresponding to 50 % collection efficiency) of the stages are 18, 10.0, 5.6, 3.2, 1.8, 1.00, 0.56, 0.32, 0.18, 0.100 and 0.056 µm. In or-der to reduce particle bouncing the aluminium sampling foils were coated with silicone spray before sampling. The foils were changed 9 times during the collection period and the length of each sample period varied from 22 to 71 h. Sample blanks were included for each collection period. This was represented by a foil that was handled like a sample foil, ex-cept that it was not placed in the MOUDI. The aerosol sam-ples were stored in clean plastic vials and shipped to the lab-oratory in Denmark under freezing conditions. In the labora-tory samples were stored in darkness at−20◦C until
analy-sis.
The MOUDI foils were ultrasonically extracted in 6 mL distilled water for 2 h. The extracts were filtered with a syringe filter (0.22 µm pore size) followed by analysis of the major anions: Cl−
, NO−3 and SO24− using a Metrohm suppressed ion chromatography system. A Metrosep A Supp 5–250 column was used with an eluent of 3.2 mM Na2CO3/1.0 mM NaHCO3. An auto-sampler was used to
in-troduce 20 µL of sample into the eluent maintained at a flow rate of 0.7 mL min−1. In addition, blank foils were extracted
for each analysis and the blank concentrations were sub-tracted from the sample values. Detection limits for each stage were 0.55 ng m−3for Cl−, 0.40 ng m−3for NO−
3, and
0.32 ng m−3for SO2−
4 for three-day sampling and three times
higher for one-day sampling periods. The size intervals of the sampled aerosol are not equally distributed; thus in or-der to illustrate the aerosol size distribution the tion of particles is normalized. The normalized concentra-tions dC/d logDpare given by Eq. (1).
dC
d logDp
= C
log r
dp,biggerthan dp,smallerthan
(1)
whereC is the concentration found on the stage, anddpis
the diameter for the stage size boundaries used.
A Scanning Mobility Particle Sizer (SMPS, Model: TSI DMA 3081, TSI CPC 3010) was operated during the MOUDI sampling periods. The SMPS inlet was connected to the station inlet system, which is operated by drawing an air flow of 1 m3min−1through a stainless steel tubing
sys-tem with a diameter of 0.10 m into the hut. This inlet has no cut-off for atmospheric particles. The SMPS sampling time was set to 2.5 min. and data were further averaged for the corresponding MOUDI sampling periods. Based on the obtained particle number size distributions, the particle vol-ume size distributions were calculated in the size regime be-tween 10 and 400 nm, assuming spherical particles. The av-erage particle mass concentration for the campaign period is 1044 ng m−3 when using an average particle density of
1.7 g cm−3.
During the field campaign, concentrations of NOx(NO2
and NO) were estimated as half-hour mean based on contin-uous measurements using a chemiluminiscent monitor (API NOx analyzer, model 200AU) at a precision of 5 % and a de-tection limit of 150 ppt. The gas was sampled at a flow rate of 1 L min−1and the monitor was calibrated once a week using
345 ppb NO gas and zero gas was added around 02:00 every night. The NOx concentration during the field campaign is
shown in Fig. 3.
3 Results and discussion
Table 1 displays the concentrations of the major ions (Cl−
, NO−
3 and SO2
−
4 ) for 11 size segregated stages of MOUDI
Fig. 3.Atmospheric concentrations of NOx(ppb) at Station Nord measured as half hour mean during the field campaign in March 2009.
range between 53 and 507 ng m−3, 2–298 ng m−3and 535–
1087 ng m−3for Cl−
, NO−3 and SO24−, respectively, and con-tribute to about 6–39 %, 0.3–25 % and 50–85 % of the an-alyzed mass. The standard deviation ranges between 4 and 15 ng m−3for Cl−
, between 4 and 14 ng m−3for NO−
3 and
between 7 and 25 ng m−3for SO2−
4 . The measured
concen-trations are comparable to findings observed at other Arc-tic sites e.g. at Alert and Svalbard (Kawamura et al., 2007; Teinila et al., 2003). The normalized size-segregated mass distributions of SO2−
4 , Cl
−, and NO−
3 are shown in Figs. 4, 5
and 6.
Several parameters are important with respect to aerosol mass concentration, particle number concentration and size distribution. These include emission strengths, short- and long-range transport, meteorological conditions and physical as well as chemical processes, which control the formation of secondary aerosols and their changes at a later stage.
Submicron particles from 0.1 to 1 µm constitute the main mass of long-range transported particles (Seinfeld and Pan-dis, 2006) and a large part of the particles we collected are associated with this size fraction. The Hybrid Single Parti-cle Lagrangian Integrated Trajectory (HYSPLIT) model was used to generate air-mass back trajectories in order to es-timate the history of the observed aerosols. Back trajecto-ries were calculated arriving at 50 and 500 m a.s.l. every 12 h (Fig. 7).
From the back trajectories, three main classes of air mass origin were observed during the sampling period: (1) west of Station Nord (Canada and West Greenland (P1 and P2) and (2) north of Station Nord (the North Pole and Siberia (P3, P4, P8 and P9)) and (3) along the coast of North Greenland, Alert and North Pole (P5, P6 and P7) (see Figs. 2 and 7). For spatial reference the corresponding sea ice coverage and the conti-nents are provided as background maps, showing first-year-ice (FYI) and multi-year-first-year-ice (MYI). Both background maps are retrieved from data provided by the Jet Propulsion Lab-oratory (JPL) and Brigham Young University (BYU). The
Table 1. Concentrations (ng m−3) of ions in the size-segregated
aerosol samples.
Date ID Size Cl NO3 SO4 Total
µm anions
5 –7 P1-01 18 19.0 13.4 19.3 51.6
March P1-02 10 10.0 9.1 2.1 21.2
P1-03 5.6 8.56 7.2 0.5 16.3
P1-04 3.2 20.4 9.9 3.7 34.0
P1-05 1.8 69.5 24.5 19.2 113.1 P1-06 1 87.1 38.6 27.9 153.7 P1-07 0.56 79.5 39.3 81.1 199.9 P1-08 0.32 27.1 21.4 290.2 338.7 P1-09 0.18 12.4 12.0 83.9 108.3
P1-10 0.1 7.4 6.9 7.8 22.1
P1-11 0.056 6.9 10.2 <DG 16.8 Total 347.7 192.5 535.4
7–10 P2-01 18 14.5 6.8 9.6 30.9
March P2-02 10 7.4 2.4 9.1 18.9
P2-03 5.6 2.2 1.7 ¡DG 3.3
P2-04 3.2 4.4 5.4 1.5 11.3
P2-05 1.8 15.1 12.3 11.1 38.5
P2-06 1 24.0 20.5 17.7 62.2
P2-07 0.56 45.2 47.7 82.1 175.1 P2-08 0.32 10.9 13.6 316.0 340.5 P2-09 0.18 4.5 5.3 106.1 115.9 P2-10 0.1 2.2 2.0 11.44 15.7 P2-11 0.056 4.4 5.8 1.81 12.0
Total 134.8 123.4 565.9
10–13 P3-01 18 12.7 5.6 9.4 27.6
March P3-02 10 3.2 1.6 0.3 5.1
P3-03 5.6 4.2 1.6 <DL 5.8
P3-04 3.2 21.1 6.4 7.6 35.1
P3-05 1.8 80.9 23.0 37.6 141.5 P3-06 1 78.7 31.6 57.3 167.6 P3-07 0.56 48.6 23.0 160.0 231.6 P3-08 0.32 17.2 6.7 473.5 497.5 P3-09 0.18 10.3 6.9 175.0 192.2
P3-10 0.1 3.4 2.5 22.0 27.9
P3-11 0.056 2.5 2.1 7.0 11.7 Total 282.9 111.0 949.6
13–16 P4-01 18 3.6 3.0 2.4 8.9
March P4-02 10 2.4 2.0 ¡DL 4.3
P4-03 5.6 2.3 2.6 1.5 6.4
P4-04 3.2 4.2 3.6 1.4 9.2
P4-05 1.8 10.5 9.4 7.6 27.5
P4-06 1 10.2 12.5 12.9 35.6
P4-07 0.56 8.7 16.4 83.1 108.2 P4-08 0.32 2.9 4.3 427.1 434.3 P4-09 0.18 2.6 6.3 136.6 145.5
P4-10 0.1 2.2 2.5 13.3 18.0
P4-11 0.056 3.4 2.3 2.3 7.9
Total 53.0 64.9 688.0
Table 1.Continued.
Date ID Size Cl NO3 SO4 Total
µm anions
16–17 P5-01 18 17.0 10.4 7.9 35.4
March P5-02 10 7.0 19.7 ¡DL 25.2
P5-03 5.6 7.8 40.1 ¡DL 47.9
P5-04 3.2 10.0 42.7 0.3 52.8 P5-05 1.8 20.0 22.4 5.3 47.7 P5-06 1 34.6 59.4 13.8 107.9 P5-07 0.56 52.7 29.1 94.4 176.2 P5-08 0.32 16.7 12.3 441.7 470.7 P5-09 0.18 11.1 16.9 104.0 132.0 P5-10 0.1 15.1 8.5 9.644 33.2 P5-11 0.056 15.5 36.8 ¡DL 52.1
Total 207.4 298.4 675.4
17–20 P6-01 18 32.8 5.5 5.8 44.1
March P6-02 10 3.9 2.0 ¡DL 5.6
P6-03 5.6 3.0 2.6 <DL 5.2
P6-04 3.2 20.2 3.7 2.1 26.0
P6-05 1.8 115.8 12.4 17.3 145.5 P6-06 1 149.9 23.4 31.8 205.1 P6-07 0.56 140.7 29.2 108.4 278.3 P6-08 0.32 22.7 6.2 393.6 422.5 P6-09 0.18 12.2 5.2 117.9 135.2
P6-10 0.1 3.9 2.8 13.7 20.4
P6-11 0.056 2.4 2.6 2.0 6.9
Total 507.6 95.4 692.0
20–22 P7-01 18 154.2 29.8 58.1 242.1
March P7-02 10 19.0 5.2 4.0 28.2
P7-03 5.6 6.1 4.2 <DL 10.7
P7-04 3.2 33.3 7.2 6.1 46.6
P7-05 1.8 88.8 22.4 27.8 139.0 P7-06 1 73.6 32.5 40.7 146.7 P7-07 0.56 53.7 32.4 169.3 255.5 P7-08 0.32 5.0 4.0 620.8 629.8 P7-09 0.18 4.2 4.2 145.5 153.8
P7-10 0.1 3.3 3.4 11.3 17.9
P7-11 0.056 3.4 2.8 3.7 9.9
Total 444.5 148.1 1087.6
22–23 P8-01 18 27.7 2.6 5.1 35.4
March P8-02 10 10.6 6.1 <DL 15.6 P8-03 5.6 17.6 <DL <DL 13.4 P8-04 3.2 33.2 <DL 6.7 40.9 P8-05 1.8 82.7 22.5 30.4 135.5 P8-06 1 57.5 28.1 39.1 124.6 P8-07 0.56 27.9 20.6 179.6 228.1 P8-08 0.32 6.9 10.8 605.1 622.8 P8-09 0.18 7.2 <DL 122.8 125.4 P8-10 0.1 11.8 <DL 8.0 14.0 P8-11 0.056 8.2 <DL <DL 1.3
Total 291.3 70.9 994.8
an active microwave radar scatterometer launched in June 1999 and operative until November 2009. Apparent bright-ness temperature for each scatterometer pulse was modelled
Table 1.Continued.
Date ID Size Cl NO3 SO4 Total
µm anions
23–24 P9-01 18 11.6 <DL <DL 5.3 March P9-02 10 8.2 <DL <DL 1.9 P9-03 5.6 7.0 <DL <DL 7.8
P9-04 3.2 15.1 6.0 5.9 27.0
P9-05 1.8 22.0 4.9 16.4 43.35
P9-06 1 16.8 4.6 20.5 41.9
P9-07 0.56 10.9 <DL 111.1 121.2 P9-08 0.32 8.9 <DL 321.0 328.0 P9-09 0.18 8.1 4.1 70.0 82.2 P9-10 0.1 11.4 <DL 36.3 46.3 P9-11 0.056 8.7 <DL 22.7 29.6
Total 129.1 2.1 603.4
from the instrument noise measurements, providing informa-tion of open water and ice (JPL, 2006). The data quality is sufficient to distinguish between first-year-ice (FYI) and multi-year-ice (MYI). Sea ice classification and extraction of the continents was carried out in ArcGIS (ESRI, 2011) based on gridded polar-stereographic Level 3 Sigma-0 QuikSCAT data over the Arctic Polar region. The three classes of air masses are all characterized by transport over sea ice and/or snow covered terrestrial areas, however, transport over sea ice was longer during the sampling periods P3, P4, P8 and P9 and according to the HYSPLIT trajectories the atmosphere also seemed to have less vertical mixing for those periods indicating more stable stratification.
Sources of local pollution can be considered to be negligi-ble because of the remote location and the minimum of influ-ence from inhabitants at Station Nord throughout the year.
The particle mass size distributions of SO24− have a pre-dominant mode in the fine fraction (1 µm), peaking approx-imately at a mean geometric diameter (Dg) of 0.32 µm. In
contrast to Cl−
and NO−3 the SO24− mass size distributions are constant in terms of shape but not magnitude. This sug-gests that the majority of the SO24−is long range-transported and originates from combustion sources, which also supports previous conclusions from Heidam et al. (2004) and is in agreement with the correlation between SO2−
4 and black
car-bon at Alert (Gong et al., 2010). SO2−
4 is by far the
dom-inating anion during the collection period. This size may have a considerable climatic effect depending on its mix-ing state with other species, since visible solar radiation is scattered very efficiently within this size range (Wallace and Hobbs, 2006). The coarser mode (>1 µm) SO24− particles, found with smaller mass concentrations, may originate from sea spray and/or SO24−formed on coarse sea salt or soil par-ticles via oxidation of SO2 (Barrie and Hoff, 1984). The
large particle size suggests that this is not long-range trans-ported but is originating from a nearby source. The contri-bution from sea salt sulphate (ss-SO2−
Fig. 4.Normalized size-segregated mass distribution of SO24− dur-ing the sampldur-ing periods P1–P9 listed in Table 1.
small according to Heidam et al. (2004), which is consis-tent with other studies (Rankin et al., 2002), where it was found that sulphate is depleted in freezing ice due to forma-tion of mirabilite (Na2SO4·10 H2O). Studies in Alaska have
found about 30 % of the total mass being SO2−
4 in Arctic
aerosols during winter-time (Barrie et al., 1981), but obser-vations by Frossard et al. (2011), during a cruise in the Arc-tic ocean showed that non-sea salt sulphate represents 61 % of the total particle mass <1 µm. Our data set shows, that the mass fraction of SO2−
4 in the size range 56–560 nm
com-prise around 60 % of the total aerosol mass, which is cal-culated based on SMPS measurements. This is estimated as an average for the whole campaign, but for the periods P3 and P4 the masses obtained from the SMPS measurements are smaller than the masses of the anions sampled by the MOUDI. The particle density used in the SMPS based cal-culations is set to 1.7 g cm−3 due to an overall dominance
of SO2−
4 for the whole campaign. Submicron SO2
−
4 particles
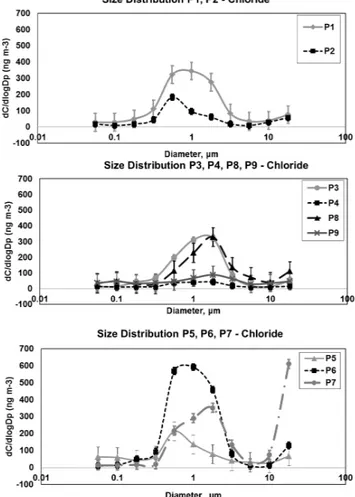
Fig. 5.Normalized size-segregated mass distribution of Cl−during
the sampling periods P1–P9 listed in Table 1.
consist primarily of non-sea-salt sulphate formed by gas-to-particle conversion of the photo-oxidation products of e.g. SO2 and dimethylsulphide. However P3 and P4 are
origi-nating from the sea ice and are likely to have a large con-tent of sea salt, which have a higher density (2.2 g cm−3).
If we leave out the measurement periods originating from the sea ice, then SO2−
4 constitute 48 % of the total air mass.
These numbers are a higher fraction than observed by Barrie et al. (1981) but in accordance with the numbers found by Frossard et al. (2011).
As described previously, Station Nord is placed on a peninsula and surrounded by sea. The fact that the surround-ing ocean was covered with ice dursurround-ing the samplsurround-ing period excludes the likelihood of atmospheric direct sea spray emis-sions reaching Station Nord. The lifetime of coarse aerosols is confined due to gravitational settling so only aerosols with diameters slightly below 1 µm make their way to Station Nord from distant sources. The ice-cover extent does not change considerably during the sampling period in the Arctic area, thus the distance from the sampling site to open water remains constant at approximately 1000 km during the field study. The size distributions of Cl− and NO−
Fig. 6.Normalized size-segregated mass distribution of NO−3 dur-ing the sampldur-ing periods P1–P9.
from SO2−
4 and are generally found in the large particle
frac-tion. This indicates that Cl−
and NO−3 have more local ori-gins. However, splitting the sampling period into three ma-jor episodes, reveals size distribution profiles more compara-ble for all the ions in air masses originating from west (P1 and P2), with less exposure to FYI. For these episodes the NO3−and Cl−associated with particles<1 µm is
dominat-ing, which suggests that part of the Cl− and NO−
3 is also
long-range transported.
The particle mass size distributions of Cl− consist of at
least 3 modes, with maxima at diameters ofD=0.56 µm, 1–1.8 µm and>18 µm. It is expected that the aerosols un-dergo transformation during their transport to Station Nord. Cl−
in the fine fraction can originate from Cl−
on coarser particles, which is released into the gas phase as HCl during transport, due to reactions between sea salt and acidic species like HNO3or H2SO4or their precursors (e.g. Barrie and
Bar-rie, 1990; Hillamo et al., 1998; Fischer, 2001; Teinila et al., 2003; Quinn et al., 2009). The gas phase HCl can condense
on smaller particles and in this way Cl−is redistributed from
the coarse to the fine fractions. A closer analysis of Cl−
size distributions (Fig. 5) shows that during transport from Canada and west Greenland (P1 and P2), Cl−
is mainly associated with long-range trans-ported submicron particles, shifting to dominance of super micron particles when the air mass arrives directly from the sea ice (P3 and P4). Then the wind direction changes, and air masses are again transported along the coast from west Greenland, revealing a mixture of submicron and super-micron Cl−particles, with very coarse particles (>18 µm) in
P7. The Cl− distributions change into dominance from
su-per micron particles when the air mass again arrives from the frozen ocean (P8 and P9). The observed mass concen-trations of Cl−in the different size regimes could be caused
by redistribution, as explained above, during transport across the ice-covered ocean, combined with new contribution of aerosols/gases from frost flowers and refreezing leads. This is consistent with the more varying size distribution for the samples P3, P4, P8 and P9, where the air mass has been trans-ported over sea ice for a longer time and, according to HYS-PLIT back trajectories, had less vertical mixing. It has been suggested by Wolff et al. (2003) that frost flowers can con-tribute to wind transport of sea salt and Domine et al. (2004) found wind transported Cl− from open sea to snow.
How-ever, the measurements by Domine et al. (2004) were car-ried out in areas with a short distance to open water. The sample collected from 20 to 22 March (P7) revealed a large amount of Cl−on the very coarse particles. On 20 March the
wind speed was high and the air mass was transported over sea ice. These very coarse particles can only originate from local sources as their sedimentation velocity does not allow transport over thousands of kilometres. We hypothesize that Cl−
on the very coarse particles originates from frost flow-ers possibly torn at high wind speeds. Roscoe et al. (2011) found that frost flowers grown in the laboratory do not break even at high wind speeds (12 m s−1), but the atmospheric
hu-midity in the laboratory experiments was not low as in the Arctic, and there were no blowing snow, or other particles, in the laboratory tank either. Another possible explanation could be that Cl−is taken up by wind blown snow when the
air mass is passing over frost flowers or over brine from the ice surface. Yang et al. (2008) and Obbard et al. (2009) also suggested this to be a more likely mechanism than tearing of frost flowers.
The size distributions of NO−
3 are dominated by at least
4 modes with maxima at geometric mean diameter ofDg=
0.18 µm, 0.56–1.8 µm, 3.2–5.6 µm, and>18 µm. Over the oceans the particle mass size distribution of NO−3 typically follows the surface area distribution of sea salt (Prospero, 2002). Like SO24−and Cl−
the fine mode of NO−3 is likely to originate from long-range transport, and mass contributions in the coarser size regime to originate from local sources. Recent studies by Douglas et al. (2012) show high NO−
3
Fig. 7.Air mass back trajectories from the model HYSPLIT. The back trajectories are calculated for arrival at 50 m and 500 m a.s.l. every 12 h. The trajectories are shown for three typical cases:(a)west of Station Nord,(b)along the coast of North Greenland and(c)north of Station Nord. For spatial reference the corresponding sea ice coverage and the continents are provided as background maps, showing first-year-ice (FYI) and multi-year-ice (MYI) listed in Table 1.
that NO−
3 can be emitted from frost flowers or simply from
the ice surface. In contrast to Cl− and SO2−
4 , NO
−
3 shows
a significant mode in the size regimeDg=3.2−5.6 µm be-tween 16 and 17 March (P5). During these days the wind was higher than average (7–9 m s−1), which may be too low to
de-stroy frost flowers, but could influence the snowpack, lead-ing to enhanced emissions from the snowpack. Accordlead-ing to Domine and Shepson (2002) and Douglas et al. (2012) the snow contains NO−3; thus NO−3 could be released directly as particles in wind blown snow under conditions with increas-ing wind speeds. However Cl−is also found at elevated
con-centrations in the surface snow over sea ice (Douglas et al., 2012) and if the increased NO−
3 concentration in the larger
particles were due to wind blown snow we would expect an increase in Cl−concentration in this size range as well.
According to Grannas et al. (2007) high concentrations of NOx(NO2+NO) can be found in the snowpack. It is
possi-ble that NO2is emitted from the snow due to wind pumping
at high wind speed followed by oxidation in the atmosphere producing gaseous HNO3. The HNO3 is then taken up by
sea salt particles forming NO−3in the larger particle fraction
and depleting Cl−
as HCl (Rankin and Wolff, 2003). Prior to episode P5, the NOxconcentration in the atmosphere was
in-creased (see Fig. 3), thus we hypothesize that these processes can be a potential explanation for the higher concentration of NO−
3 relative to Cl
−associated with the large particle
frac-tion.
4 Conclusions
The primary objective of this study was to improve the current understanding of composition and origin of Arctic aerosols through analysis of mass size distributions of ma-jor anions in late winter Arctic aerosols at Station Nord, northeast Greenland. It was found that aerosols in late win-ter/early spring just after polar sunrise are a mixture of long-range transported and regional to locally originating aerosols. Fine particles, smaller than 1 µm containing SO2−
4 , Cl
−and
NO−3, most probably originate from long-range transport, which appears to be the most important source of major in-organic anions at Station Nord, where SO24−is by far dom-inating, accounting for 50–85 % of the analyzed mass. The analysis suggests that Cl− and NO−
3 in coarser particles
(>1.5 µm) originate from local/regional sources. Under con-ditions where the air mass is transported over sea ice at high wind speeds, very coarse particles (>18 µm) are found, and it is hypothesized that frost flowers on the sea ice are a po-tential source to Cl− and NO−
3 particles. This is supported
by Shaw et al. (2010), who found that particles in the Arctic in winter clearly had a sea spray profile despite the frozen polar ocean. The uncertainties of the NO−3 sources are still substantial and further studies on nitrogen processes in the high Arctic are needed.
Supplementary material related to this article is
Acknowledgements. This work was financially supported by the Aarhus University Research Foundation and The Danish Environmental Protection Agency with means from the Dancea funds for environmental support to the Arctic Region (Grant no M 112 00270). The findings and conclusions presented here do not necessarily reflect the views of the Agency. The Royal Danish Air Force is gratefully acknowledged for providing transport to Station Nord and the authors wish in particular to thank the staff at Station Nord for excellent support during sampling. The presented study is part of the Nordic Centre of Excellence CRAICC.
Edited by: J. W. Bottenheim
References
ACIA (Arctic Climate Impact Assessment): Overview Report, Cambridge Univ. Press, Cambridge, 140 pp., 2004.
Barrie, L. A. and Barrie, M. J.: Chemical-Components of Lower Tropospheric Aerosols in the High Arctic – 6 Years of Observa-tions, J. Atmos. Chem., 11, 211–226, 1990.
Barrie, L. A. and Hoff, R. M.: The oxidation rate and residence time of sulphur dioxide in the Arctic atmosphere, Atmos. Environ., 18, 2711–2722, 1984.
Barrie, L. A., Hoff, R. M., and Daggupaty, S. M.: The influence of mid-latitudinal pollution sources on haze in the Canadian arctic, Atmos. Environ., 15, 1407–1419, 1981.
Domine, F. and Shepson, P. B.: Air-snow interactions and atmo-spheric chemistry, Science, 297, 1506–1510, 2002.
Domine, F., Sparapani, R., Ianniello, A., and Beine, H. J.: The origin of sea salt in snow on Arctic sea ice and in coastal regions, At-mos. Chem. Phys., 4, 2259–2271, doi:10.5194/acp-4-2259-2004, 2004.
Douglas, T. A. and Sturm, M.: Arctic haze, mercury and the chem-ical composition of snow across northwestern Alaska, Atmos. Environ., 38, 805–820, 2004.
Douglas, T. A., Domine, F., Barret, M., Anastasio, C., Beine, H. J., Bottenheim, J., Grannas, A., Houdier, S., Netcheva, S., Rowland, G., Staebler, R., and Steffen, A.: Frost flow-ers growing in the Arctic ocean-atmosphere-sea ice-snow inter-face: 1. Chemical composition, J. Geophys. Res., 117, D00R09, doi:10.1029/2011JD016460, 2012.
ESRI: ArcGIS Desktop: Release 10. Redlands, CA: Environmental Research Institute, 2011.
Fischer, H.: Imprint of large-scale atmospheric transport patterns on sea-salt records in northern Greenland ice cores, J. Geophys. Res.-Atmos., 106, 23977–23984, 2001.
Flyger, H., Heidam, N. Z., Hansen, K. A., Rasmussen, L., and Megaw, W. J.: The background levels of the summer tropospheric aerosol and trace gases in Greenland, J. Aerosol Sci., 11, 95–110, 1980.
Frossard, A. A., Shaw, P. M., Russel, L. M., Kroll, J. H., Cana-garatna, M. R., Worsnop, D. R., Quinn, P. K., and Bates, T. S.; Springtime Arctic haze contributions of submicron organic par-ticles from European and Asian combustion sources, J. Geophys. Res., 116, D05205, doi:1029/2010JD015178, 2011.
Glasow, R. von and Crutzen, P. J.: Tropospheric Halogen Chem-istry in: The Atmosphere, edited by: Russel and Keeling, ISBN:9780080450919, Elsevier, 2007.
Gong, S. L., Zhao, T. L., Sharma, S., Toom-Sauntry, D., Lavou´e, D., Zhang, X. B., Leaitch, W. R., and Barrie, L. A.: Identification of trends and interannual variability of sulfate and black carbon in the Canadian High Arctic: 1981–2007, J. Geophys. Res., 115, D07305, doi:10.1029/2009JD012943, 2010.
Grannas, A. M., Jones, A. E., Dibb, J., Ammann, M., Anastasio, C., Beine, H. J., Bergin, M., Bottenheim, J., Boxe, C. S., Carver, G., Chen, G., Crawford, J. H., Domin´e, F., Frey, M. M., Guzm´an, M. I., Heard, D. E., Helmig, D., Hoffmann, M. R., Honrath, R. E., Huey, L. G., Hutterli, M., Jacobi, H. W., Kl´an, P., Lefer, B., McConnell, J., Plane, J., Sander, R., Savarino, J., Shepson, P. B., Simpson, W. R., Sodeau, J. R., von Glasow, R., Weller, R., Wolff, E. W., and Zhu, T.: An overview of snow photochemistry: evi-dence, mechanisms and impacts, Atmos. Chem. Phys., 7, 4329– 4373, doi:10.5194/acp-7-4329-2007, 2007.
Haywood, J. and Boucher, O.: Estimates of the direct and indirect radiative forcing due to troposheric aerosols: A review, Rev. Geo-phys., 38, 513–543, doi:10.1029/1999RG000078, 2000. Heidam, N. Z., W˚ahlin, P., and Christensen, J. H.: Tropospheric
Gases and Aerosols in Northeast Greenland, J. Atmos. Sci., 56, 261–278, 1999.
Heidam, N. Z., Christensen, J., W˚ahlin, P., and Skov, H.: Arctic at-mospheric contaminants in NE Greenland: levels, variations, ori-gins, transport, transformations and trends 1990–2001, Sci. Total Environ., 331, 5–28, 2004.
Hillamo, R., Allegrini, I., Sparapani, R., and Kerminen, V. M.: Mass size distributions and precursor gas concentrations of major in-organic ions in Antarctic aerosol, Int. J. Environ. An. Ch., 71, 353–372, 1998.
IPCC: Climate Change 2007: Contribution of Working Group I to the Fourth Assessment Report of the Intergovernmental Panel on Climate Change, edited by: Solomon, S., Qin, D., Manning, M., Chen, Z., Marquis, M., Averyt, K. B., Tignor, M., and Miller, H. L., Cambridge University Press, Cambrigde, UK and New York, NY, USA, 996 pp., 2007.
Jacobson, M. Z.: Strong radiative heating due to the mixing state of black carbon in atmospheric aerosols, Nature, 409, 695–697, 2001.
Jet Propulsion Laboratory (JPL): QuikSCAT Science Data Prod-uct, User Manual. Version 3.0, California Institute of Technol-ogy, September 2006.
Kanamitsu, M., Ebisuzaki, W., Woollen, J., Yang, S. K., Hnilo, J. J., Fiorino, M., and Potter, G. L.: Ncep-Doe Amip-Ii Reanalysis (R-2), B. Am. Meteorol. Soc., 83, 1631–1643, 2002.
Kawamura, K., Narukawa, M., Li, S. M., and Barrie, L. A.: Size distributions of dicarboxylic acids and inorganic ions in atmospheric aerosols collected during polar sunrise in the Canadian high Arctic, J. Geophys. Res.-Atmos., 112, D10307, doi:1029/2006JD008244, 2007.
Li, S. M. and Barrie, L. A.: Biogenic Sulfur Aerosol in the Arctic Troposphere .1. Contributions to Total Sulfate, J. Geophys. Res.-Atmos., 98, 20613–20622, 1993.
Lungu, T. (Ed.): QuickSCAT Science Data Product, User’s Man-ual, Version 2.2, D-18053; Jet Propulsion Laboratory, California Institute of Technology, 2001.
Chem. Phys., 13, 35–49, doi:10.5194/acp-13-35-2013, 2013. Obbard, R. W., Roscoe, H. K., Wolff, E. W., and Atkinson,
H.: Frost flower surface area and chemistry as a function of salinity and temperature, J. Geophys. Res., 114, D20305, doi:10.1029/2009JD012481, 2009.
Polissar, A. V., Hopke, P. K., and Harris, J. M.: Source regions for atmospheric aerosol measured at Barrow, Alaska, Environ. Sci. Technol., 35, 4214–4226, 2001.
Prospero, J. M.: The chemical and physical properties of marine aerosols: An introduction: Springer-Verlag Berlin, Berlin, Ger-many, 82 pp., 2002.
Quinn, P. K., Miller, T. L., Bates, T. S., Ogren, J. A., Andrews, E., and Shaw, G. E.: A 3-year record of simultaneously measured aerosol chemical and optical properties at Barrow, Alaska, J. Geophys. Res.-Atmos., 107, 4130, doi:10.1029/2001JD001248, 2002.
Quinn, P. K., Shaw, G., Andrews, E., Dutton, E. G., Ruoho-Airola, T., and Gong, S. L.: Arctic haze: current trends and knowledge gaps, Tellus B, 59, 99–114, 2007.
Quinn, P. K., Bates, T. S., Baum, E., Doubleday, N., Fiore, A. M., Flanner, M., Fridlind, A., Garrett, T. J., Koch, D., Menon, S., Shindell, D., Stohl, A., and Warren, S. G.: Short-lived pollu-tants in the Arctic: their climate impact and possible mitigation strategies, Atmos. Chem. Phys., 8, 1723–1735, doi:10.5194/acp-8-1723-2008, 2008.
Quinn, P. K., Bates, T. S., Schulz, K., and Shaw, G. E.: Decadal trends in aerosol chemical composition at Barrow, Alaska: 1976– 2008, Atmos. Chem. Phys., 9, 8883–8888, doi:10.5194/acp-9-8883-2009, 2009.
Rankin, A. M. and Wolff, E. W.: A year-long record of size-segregated aerosol composition at Halley, Antarctica, J. Geo-phys. Res., 108, 4775, doi:10.1029/2003JD003993, 2003. Rankin, A. M., Wolff, E. W., and Martin, S.: Frost flowers:
Impli-cations for tropospheric chemistry and ice core interpretation, J. Geophys. Res.-Atmos., 107, 4683, doi:10.1029/2002JD002492, 2002.
Roscoe, H. K., Brooks, B., Jackson, A. V., Smith, M. H., Walker, S. J., Obbard, R. W., and Wolff, E. W.: Frost flowers in the lab-oratory: Growth, characteristics, aerosol, and the underlying sea ice, J. Geophys. Res., 116, D12301, doi:10.1029/2010JD015144, 2011.
Seinfeld, J. H. and Pandis, S. N.: Atmospheric Chemistry and Physics – From Air Pollution to Climate Change, 2nd Edn., Wi-ley, 2006.
Shaw, P. M., Russell, L. M., Jefferson, A., and Quinn, P. K.: Arctic organic aerosol measurements show particles from mixed com-bustion in spring haze and from frost flowers in winter, Geophys. Res. Lett., 37, L10803, doi:10.1029/2010GL042831, 2010. Swietlicki, E., Hansson, H. C., Hameri, K., Svenningsson, B.,
Massling, A., McFiggans, G., McMurry, P. H., Petaja, T., Tunved, P., Gysel, M., Topping, D., Weingartner, E., Baltensperger, U., Rissler, J., Wiedensohler, A., and Kulmala, M.: Hygroscopic properties of submicrometer atmospheric aerosol particles mea-sured with H-TDMA instruments in various environments – a review, Tellus B, 60, 432–469, 2008.
Teinila, K., Hillamo, R., Kerminen, V. M., and Beine, H. J.: Aerosol chemistry during the NICE dark and light campaigns, Atmos. Environ., 37, 563–575, 2003.
Wallace, J. M. and Hobbs, P. V.: Atmospheric Science – An Intro-ductory Survey, Academic Press, Elsevier, 2006.
Wolff, E. W., Rankin, A. M., and Rothlisberger, R.: An ice core indicator of Antarctic sea ice production, Geophys. Res. Lett., 30, 2158, doi:10.1029/2003GL018454, 2003.