Vortex-averaged Arctic ozone depletion in the winter 2002/2003
Texto
Imagem


Documentos relacionados
Accumulated chemical loss in column ozone for di ff erent altitude intervals and di ff er- ent months in winter 1991–1992, derived using ER-2 aircraft measurements, HALOE
1) The structure and position of the wake vortex was different depending on the rear shape. For convenience, the upper clockwise vortex was defined as vortex
Energetic particle induced inter-annual variability of ozone inside the Antarctic polar vortex observed in satellite data2.
Correlation of a time series (1992–2009) of vortex mean ozone mixing ratios in early winter at 525–575 K and a time series of the fraction of air in the vortex in early winter
Using the tight correlation observed between PSC areas and total vortex ozone deple- tion and taking into account the decreasing amounts of ozone depleting substances, we predict
In the present study, a reaction scheme representing the chemistry of ozone depletion and halogen release is pro- cessed with two different mechanism reduction approaches, namely,
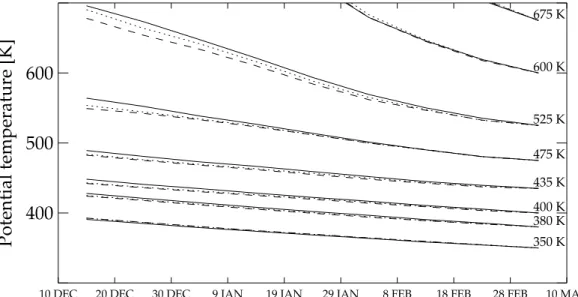
shown above. The figure again shows the early chemical loss in December 2002 due to the low temperature and early chlorine activation.. 4.3 and 4.4), which differ only in the
in ozone depletion (once ozone is depleted it cannot be depleted again), S is set to OMD/OMD 150 , where OMD 150 is the value OMD would have if total ozone everywhere inside the
