Asian Journal of Conservation Biology, July 2014. Vol. 3 No. 1, pp. 8–18 AJCB: FP0033 ISSN 2278-7666 ©TCRP 2014
Demography and Ecology of Indian Sarus Crane (G
rus antigone
antigone
) in Uttar Pradesh, Northern India
Kaushalendra Kumar Jha1,*& Craig Roy McKinley2
1Indian Institute of Forest Management, Nehru Nagar, PB No 357, Bhopal, 462 003, MP, India 2
Department of Natural Resource Ecology and Management , Oklahoma State University, Stillwater, OK, USA
(Accepted 6 June, 2014)
ABSTRACT
Uttar Pradesh (UP) has nine different Agro-climatic Zones in which the Indian Sarus Crane (ISC, Grus anti-gone antianti-gone) is potentially located. A census of this species was performed in 2010 in UP at potential ISC habitats such as ponds, rivers, canals, agricultural fields and others. Data were collected regarding habitat types, threats, ownership, and other characteristics. In addition to the in-field census, subjective, qualitative data were obtained through a questionnaire survey. The total population of ISC was observed to be 11,905 and the population demonstrated a recruitment rate of 13%. No evidence supporting a declining population status was found. Some Agro-climatic Zones indicated a high population of cranes. For example, the Cen-tral Plain and the South Western Semi-Arid Plain had over 4,300 individuals each. Conversely, a very low population was observed in the Tarai Agro-climatic Zone, and no cranes were observed in Vindhyan Zone. ISC appear to form social organization and demonstrate omnivorous feeding habits. Their habitats were considered to be under various categories and degrees of threats. The most common threats appeared to be the result of pollution and agricultural development. The data collected could be useful in further planning of research and conservation efforts in the state and elsewhere.
Keywords: Adult- juvenile ratio, conservation strategy, density, distribution, habitat threat.
INTRODUCTION
The Indian Sarus Crane (Grus antigone antigone) is one of the 15 known species of cranes in the world and is the only resident breeding crane found in India and south-east Asia. It is the tallest flying bird of the world with 1.5 to 1.8 m height (Ali and Ripley, 1980; Meine and Archibald, 1996b, Singh and Tatu, 2000). The Indian Sarus Crane (ISC) is the most sedentary and tallest of the three Sarus Crane subspecies and has been estimated to have a worldwide population of 8,000 – 10,000 (Meine and Archibald, 1996b). It has been noted in several publications that the number of ISC has de-clined, and its geographical distribution has shrunk over time (Gole, 1989; Meine and Archibald, 1996a). Habi-tat degradation is suspected to be one of the significant factors in the species’ decline. This crane is known to be one of the threatened avian species and has been so rec-ognized by the government of India and International Union for Conservation of Nature (IUCN). Thus the crane has been given protection in India under schedule IV of the Wildlife Protection Act of 1972 and is now categorized as endangered by IUCN. Birdlife Interna-tional has designated this species as globally threatened (Sundar, 2002). Generally, the ISC is found near water bodies, but is also frequently seen in agricultural fields within the Sarus-dominated areas. The mosaic land-scape of UP supports the highest number of ISC indi-viduals in India (Sundar et al., 2000a, 2000b). Due to various anthropogenic activities, crane habitats are un-der threat of degradation and alteration, and conse-quently, the cranes’ ultimate survival is also threatened.
*Corresponding Author’s E-mail: jhakk1959@gmail.com 8
The future of the ISC is closely tied to the quality of small wetlands in India that now experience heavy hu-man use and have high rates of sewage inflow, exten-sive agricultural runoff, high levels of pesticide resi-dues, and intensification of agricultural systems (Nandi, 2006). A review of literature suggests that there had been only a few attempts to study the demography and ecology of ISC on large scale in Uttar Pradesh (UP).
Uttar Pradesh is considered to be the stronghold of this species within India with the largest population and consequently the largest potential source of data. Un-fortunately intensive data collection and reporting is not available for the state. The present study was intended to examine the following aspects of ISC in UP and the state’s different Agro-climatic Zones (ACZ).
i. Population and distribution ii. Habit and habitat use
iii. Threats to ISC habitats and their severity iv. Possible conservation strategies
MATERIALS AND METHODS
Study Sites
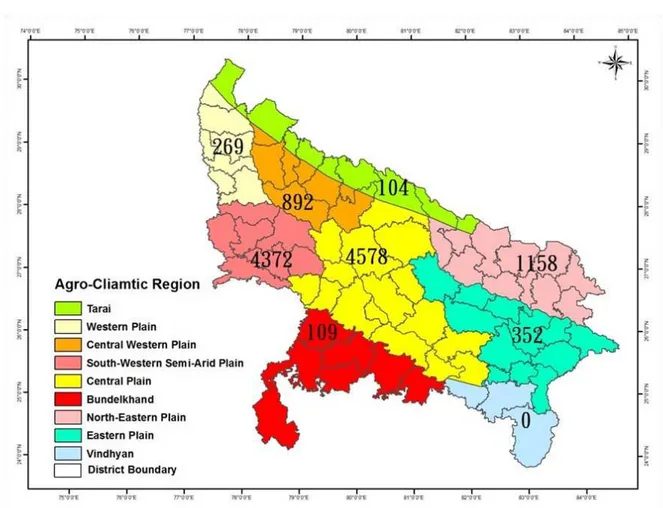
season. Winter temperatures may reach as low as 2 o C and summer temperatures may be as high as 48 oC. Var-ied edaphic-climatic factors and cropping patterns divide UP into nine different Agro-climatic Zone (ACZ) namely, Bundelkhand (BKD), Central Plain (CPL), Cen-tral Western Plain (CWP), Eastern Plain (EPL), North Eastern Plain (NEP), Tarai Bhabar (TAR), Western Plain (WPL), South Western Semi-Arid Plain (SAP), and Vindhyan (VDN). Distinguishing features of the indi-vidual zone are given in Table 1, with geographical de-marcation shown in Figure 1.
Data Collection and Analysis
The various Forest Divisions of the state were designated as the independent administrative units for data collec-tion. Wetlands and rural agriculture areas historically known for ISC presence comprised the study/count sites. The Uttar Pradesh Forest Department provided the pri-mary source of personnel resources for this study. Non-governmental organization members and public volun-teers were also involved in the census operation. All personnel were provided training in the methodology of crane counting and data collection.
Crane counts were completed during the sum-mer, as it is during this time that cranes remain confined around the wetlands in search of water. This counting protocol facilitates clear sightings and easier counts. Counts were accomplished on single day to eliminate possible double counting caused by local movement/ migration of the birds to neighboring habitats (ISC
inhabiting sites). For administrative reasons, Sunday, June 20, 2010 was selected to ensure maximum involve-ment of the people who were normally busy during week-days. This particular date was also selected as it is one of the longer days of the year, which enabled the same teams to cover a broad area during the daytime hours. Morning counts were done during the crane feeding period (06.00h – 07.30h). Evening counts (17.00h – 19.30h) were also accomplished at the same sites, as the cranes returned to the watering and/or feeding areas. The count was accom-plished in both the morning and evening to avoid possibly missing cranes due to early flights that may occur prior to sunrise.
As the count involved a limited number of per-sonnel the cranes could only be identified broadly into adults and juveniles. A point (head) count method was utilized. Highest of the two counts (morning and eve-ning) of ISC adults and juveniles observed at the same site was considered the population at that site. The ob-served ISC were classified according to different forest divisions and later were classified further into districts and Agro-climatic Zones (ACZ).
A predesigned form was used to record observa-tions, which included number of adult and juvenile cranes at each observation period, type of habitat used, potential threats to the habitat, ownership of the habitat, etc. A questionnaire was also used after following field observa-tion to collect addiobserva-tional informaobserva-tion such as habitat use, severity of the habitat degradation, possible reasons for mortality, potential conservation attempts, etc. The
AJCB Vol. 3 No. 1, pp. 8–18, 2014
9
10
SN
Agro-Climatic zone
Rain-fall (mm)
Tempera-ture (oC)
Soil type
Crop-ping
inten-sity %
Principal crops
Constraints
Max Min 1 Tarai
Bha-bar (TAR)
1400 38.4 4.3 In general alluvial. Bhabar soils mixed with coarse gravel and stones
146 Sugarcane, rice, wheat, maize, potato
Bhabar soils are drought prone on account of rapid water infiltration 2 Western
Plain (WPL)
950 43.3 1.5 Alluvial deposits by the Ganga, the Ya-muna and their tributaries
157 Sugarcane, rice, wheat, maize, potato
Water- logging and salinity
3 Central Western Plain (CWP)
800 45.4 4.5 Alluvial soils 150 Rice, wheat, maize, potato, sugarcane
Salinity and alkalin-ity
4 South West-ern Semi-Arid Plain (SAP)
770 47.0 4.0 Alluvial and Ara-valis
146 Bajra, wheat, mustard, pi-geon pea, rice, wheat
Brakish water alka-linity, undulating ravines
5 Central Plain (CPL)
1020 45.0 5.5 Mainly alluvial, some Vindhyan
155 Rice, wheat, maize, potato, mustard
Usar soils
6 Bundelk-hand (BKD)
1000 47.8 3.0 Four broad soil groups – Rakar, Parwa, kabar and Mar
111 Linseed, horse gram, lentil, wheat, millet, pigeon pea
Inferior soils, lack of resources and improved imple-ments
7 North East-ern Plain (NEP)
1470 44.2 4.9 Mainly alluvial some calcareous
152 Rice, wheat, maize, potato, sugarcane
Flood prone
8 Eastern Plain (EPL)
800 41.4 5.7 Alluvial soils with varying proportion of silt and clay, sandy loam in south east part
138 Rice, wheat, maize, potato, mustard, sun-flower
Large areas alka-line/ saline and siz-able areas under diara lands
9 Vindhyan (VDN)
1100 45.2 5.0 Loam in south east part, soils vary from light to heavy
133 Millet, mus-tard, wheat, pigeon pea
Undulating and rocky areas Table 1. Characteristic features of different Agro-climatic Zones of Uttar Pradesh, India
questionnaires were distributed among the field level workers of the forest departments (forest guards and watchers) and the public of Sarus-inhabiting areas who were expected to have direct or indirect knowledge of the Sarus crane. In addition to the questionnaire survey, several key resource persons were also interviewed to gather additional data for the purpose of completing information gaps.
Geographical description of the districts and the wetland areas in those districts were obtained from
the Remote Sensing Application Centre (2009) and used in this study for density calculation and other purposes. Characteristics of the Agro-climatic zone (ACZ) of UP were derived from Singh et al. (2003). Crane demogra-phy-related definitions of ‘pair’ (two), ‘family’ (three to four), ‘group’ (five to 20), and ‘congregation’ (>20), were used following the convention of Sundar (2000b). The term ‘fresh recruitment’ or simply ‘recruitment’ was adopted from Mukherjee et al. (2002a) as the percentage of juveniles in total population. The ratio of juveniles to
adults was calculated on the basis of the number of juve-niles per hundred adults. Crude density ratio (number of individuals per square kilometer of the district, zone, or state) was employed as used by Singh and Tatu (2000). Likewise the improved density ratio was calculated as the number of individuals per square kilometer of wet-land area in each of those geographical classifications. These ratios were calculated to assess the habitation pat-tern in different sections of the state. The improved den-sity ratio was further defined by adding rice paddy area (km) to the wetland area, signifying the density over total available habitat area. Sundar (2009) reported that Sarus cranes, though primarily a wetland species, have been increasingly observed to nest in flooded rice paddies, a crop field that closely resembles wetlands, and to use rice fields for maintaining their territory. Areas of agri-culture fields in paddy rice production in different dis-tricts in the 2009-10 farming year were provided by Singh, J. (personal communication).
Habitat threat value (index) was calculated by assigning a value of 1 to each type of threat with respect to habitat alteration by any mode or method. Thus, any given habitat could have an index value ranging from 0 to13, as thirteen types of threats/alterations were re-corded for the ISC habitats. These index values were totaled for the districts and the district totals were summed to determine the zone value. This technique was used to quantify the degree of habitat threat in each zone. As the data came from a total count, extrapola-tion was not required for populaextrapola-tion assessment.
RESULTS
Habit, Population and Distribution
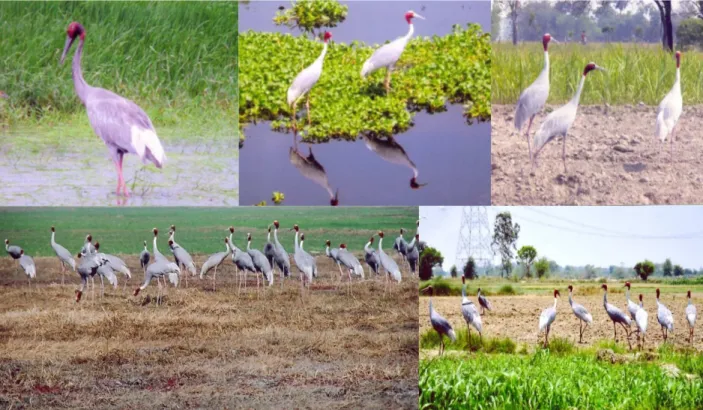
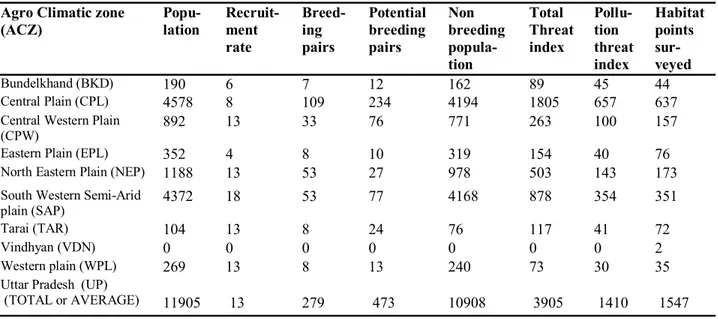
Habit: Demographic results indicated a well-defined social organization in the ISC (Figure 2). Demographic features and habitat threat values of this species in differ-ent ACZs are presdiffer-ented in Table 2. With the exception of eleven isolated cases of solo individuals in CPL (five), EPL (three), CWP (two), and BKD (one), cranes were found in pairs, families, groups, or congregations. In total, 473 pairs (adults without chicks), 279 families (83 pairs with one chick and 196 pairs with two chicks), 486 groups, and 147 congregations were observed. The high-est number of pairs (234), families (109), groups (242), and congregations (60) were seen in the Central Plain (CPL). The largest congregation, 156 birds, was re-corded in Mahamayanagar district in the South Western Semi-Arid Plain (SAP). As observed, the state’s ISC population inhabited impounded water bodies (52%), in and around running water bodies (26%), agriculture fields (14%), and non-designated habitats (8%).
The ISC were observed to select vegetative ma-terials, food grains, insects, fish, snails, and others as food sources. Insects (29%), fish (25%), food grains (18%), snails (16%) and vegetation (9%) were reported to be preferred. The favorite food grains were paddy rice (48%) and wheat (23%) followed by maize (12%), mus-tard (6%), soybean (4%), and others (7%). The others category included chick pea, green pea and millet.
Population: The majority of potential ISC habitats were
populated with cranes. The entire state was surveyed for ISC presence, and a total of 11,905 individuals were ob-served. Male and females could not be distinguished but 10,394 adults and 1,511 juveniles were counted. ISC were observed in 55 districts, with cranes not observed in 14 districts. The population was observed to be more con-centrated in the south and western districts of the state around common flood plains of the Ganga, Yamuna, and Chambal rivers.
In assessing the crane population over the past 10 -15 years, 49% of questionnaire respondents were of the view that the crane population in the state had increased. Fifteen percent of respondents believed a decrease had occurred, 21% said no change and 15% were not aware of the issue. It was interesting to find that perceived in-creases in population were reported in the identified very high and high density districts and the perceived decreases in population were noted in those districts categorized as very low and zero. These perceptions are considered as possible indicators of a positive growth in ISC population in certain parts of the state while in other parts a decline may be occurring.
Distribution: Indian Sarus Cranes were observed
through-out, almost the entire state. Figure 3 shows their distribu-tion based upon a density classificadistribu-tion (0: absent, 1-50: very low, 51-100: low, 101-500: high, >500: very high). Of the 69 total districts, 14 were in the absent category, 21 were classified as very low, 6 were considered low, 23 were high, and 5 districts were classified as very high. The percentage distribution of the total population in these categories was 0, 4.3, 3.5, 43.9 and 48.3, respectively. Although the whole population was distributed in 55 dis-tricts, approximately half of the population (51%) was confined to only six districts (Auraiya, Etah, Etawah, Kanpurdehat, Mahamayanagar, and Mainpuri). The popu-lation distribution within districts ranged from two (Azamgarh) to 2,180 (Mainpuri). The crane population within populated zones varied from 104 (TAR) to 4,578 (CPL). The population percentage distributions in the various zones were 38% (CPL), 37% (SAP), 10% (NEP), 7% (CWP), 3% (EPL), 2% (WPL), 2% (BKD), 1% (TAR) and 0% (VDN). The percentages of adults and juveniles in each zone with respect to the State’s total population were 40% and 24% (CPL), 34% and 53% (SAP), 10% and 10% (NEP), 7% and 8% (CWP), 3% and 1% (EPL), 2% and 2% (WPL), 2% and 1% (BKD), 1% and 1% (TAR), and 0% and 0% (VDN). The total population (11,905) of the State was distributed as 10,394 adults and 1,511 juveniles. Almost all of the population was observed in the agricul-ture-dominated districts of the state. Only 2.5% of the population was observed in the forested districts of TAR, BKD, and VDN zone. Moreover, this population was observed in open agricultural field or wetlands in the vi-cinity of forests and not in the forests themselves. An-other interesting observation was that only 1.6 % of ISC population was found in highly protected habitats such as bird sanctuaries and wildlife sanctuaries. Fifty two per-cent of the total population was observed in ponds, 14% in agricultural fields, 15% in canals, 11% in rivers and 8% in other habitats.
11
12
Figure 2. Clockwise from left: solo, pair, family, group and congregation of sarus crane (Grus antigone) showing distinct social organization within the population (Photo courtesy: UP Forest Department).
Figure 3. Density distribution of ISC in UP. Absent <1, Very low 1-50, Low 51- 100, High 101- 500, Very high >500. Blue circles are the two nuclei, N1 and N2, within red broken circle i.e., ISC popula-tion concentrapopula-tion zone of the state.
13
Agro Climatic zone (ACZ)
Popu-lation
Recruit-ment rate
Breed-ing pairs
Potential breeding pairs
Non breeding popula-tion
Total Threat index
Pollu-tion threat index
Habitat points sur-veyed
Bundelkhand (BKD) 190 6 7 12 162 89 45 44
Central Plain (CPL) 4578 8 109 234 4194 1805 657 637
Central Western Plain (CPW)
892 13 33 76 771 263 100 157
Eastern Plain (EPL) 352 4 8 10 319 154 40 76
North Eastern Plain (NEP) 1188 13 53 27 978 503 143 173
South Western Semi-Arid plain (SAP)
4372 18 53 77 4168 878 354 351
Tarai (TAR) 104 13 8 24 76 117 41 72
Vindhyan (VDN) 0 0 0 0 0 0 0 2
Western plain (WPL) 269 13 8 13 240 73 30 35
Uttar Pradesh (UP) (TOTAL or AVERAGE)
11905
13
279
473
10908
3905
1410
1547 Table 2. Demographic features of Indian Sarus Crane and habitat threat index in different Agro-climatic zone of Uttar Pradesh, India
impounded water bodies (ponds, lakes, and reservoirs), 2) rivers, 3) canals, 4) agriculture fields, and 5) others (mainly Usar wastelands, grasslands and temporarily waterlogged fields or jhabar). Percentage of use in-cluded the following; ponds (45%), agriculture fields (33%), canals (10 %), rivers (9 %), and others (2).
The observed habitats had varying types of ownership and, thus were categorized into government (54%), private (24%), and not-known (22%) owner-ships. Varying ownership types suggest the need for differing conservation strategies if such efforts are to be implemented. However, 17% of the observed habitats were reported to be protected, 69% were unprotected, and the status of 14% was not known.
Threats to the habitats: All observed habitats were found to be under some threat of maintaining their original or unaltered state as a result of one or more anthropogenic activities. A total of nine types of threat were observed; 1) pollution, 2) agricultural expansion, 3) removal of soil for various purposes, 4) removal of vegetation (extraction of consumable products), 5) ex-pansion of vegetation (spread of weeds), 6) land en-croachment, 7) fishing, 8) siltation and 9) others (category not known to the data collectors but during a post-survey interview they indicated that habitat condi-tion was not normal. In certain cases water quality was very bad and in some others visitors’ pressure was high). Pollution in the habitats was further categorized into five different types, namely; 1) disposal of house-hold waste, 2) drainage of industrial discharge, 3) solid waste disposal, 4) use of excess fertilizers, and 5) pesti-cides that drained into the habitats. Primary threats to potential and actual habitats of Sarus were observed in the following order; pollution (36%), expansion of agri-culture (17%), fishing (9%) others (9%), siltation (8%), land encroachment (8%), removal of useful vegetation (6%), expansion of nonutility vegetation (4%) and de-silting or soil removal (3%).
The crude density of individuals within the ACZs ranged from 0.007/ km2 to 0.213/km2 while improved den-sity was 0.194/km2 and 9.096/km2, respectively. Both densities were the lowest in the BKD Zone and the highest in the SAP Zone. Average crude and improved density of ISC (per 100 km2) in the state was 6 and 200, respectively. The state level crude density distribution of adults and juveniles was 5 and 1, respectively, while improved den-sity for adults and juveniles was 168 and 29, respectively. When paddy area was added to the wetland area, improved density, the “further improved density”, ranged from 13 to 152 among the ACZs. The further improved density was observed to be 34 for the total population across the entire state. On average, ten to twelve ISC were supported by each habitat in the state, though population on the habitats varied from one (single) to 156 (the largest congregation) cranes.
The adult to juvenile ratio (juveniles per 100 adults) in each of the categories were observed to be 0 (absent), 9 (very low), 16 (low), 15 (high), and 15 (very high). Class limits were the same as defined previously for the density distribution of the total population. Within the various ACZ, the adult to juvenile ratios were 0 (VDN), 4 (EPL), 7 (BKD), 9 (CPL), 14 (NEP), 15 (TAR), 15 (WPL), 15 (CWP) and 22 (SAP).For the overall state, this ratio was 15.
Fresh recruitment (percentage of juveniles in the total population) was similar to the adult to juvenile ratio in VDN (0%) and EPL (4%), and with marginal variation in BKD (6%), CPL (8%), TAR (13%), NEP (13%), WPL (13%), CWP (13%), and SAP (18). The overall state fresh recruitment ratio was observed to be 13%.
Habitats and Threats
Habitat use: The ISC survey counted 1,547 potential habitats or ISC inhabiting sites. Cranes were encountered at 87% of the habitats observed. The survey indicated that the cranes were using five different groups of habitats; 1)
Primary threats due to pollution were classified as pesticide inflow/use (36%), fertilizer run-in/use (28%), household waste (24%), solid waste disposal (6%) and industrial discharge (5%). Qualitative assessment through the use of the questionnaireindicated pollution and expan-sion of agriculture into the habitats, mainly wetlands, as two most important factors of habitat degradation, fol-lowed by habitat encroachment and fishing in wetlands. Use of pesticides and fertilizers in agricultural crops and disposal of domestic and industrial waste were also men-tioned as concerns for habitat degradation as indicated through the questionnaire survey.
By summing the total of all 13 threats (leading to index values), the ACZ were ranked from most severe to lowest as follows; with total index values in parenthesis: CPL (1805), SAP (878), NEP (503), CWP (263), EPL (154), TAR (117), BKD (89), WPL (73), and VDN (0). In reviewing pollution threat values only, the resulting rank-ings were almost in the same order; CPL (657), SAP (354), NEP (143), CWP (100), BKD (45), TAR (41), EPL (40), WPL (30), and VDN (0).
Conservation Strategy
As indicated earlier, 69% of the observed 1,547 ISC in-habiting sites were unprotected, 17% were protected and the protection status of the remaining 14% was not known. A majority of respondents to the questionnaire (89%) indicated that the villagers should be encouraged to save the ISC through some form of monetary assistance. Such assistance would be focused such that villagers do not destroy the nests, steal eggs and/or hunt the cranes themselves. However, the few respondents (18%) who had seen dead cranes identified the reason for death as natural phenomenon and not human-caused.
The survey indicated that ISC is believed by a large number of respondents (97%) to be useful because the crane is attached to social beliefs (51%), is a symbol of love and affection and/or religious sentiments (38%), and is of practical utility (11%), primarily due to its abil-ity to kill snakes.
DISCUSSION
Population demography and habitat use by Sarus crane was provided in earlier reports (Gole,1989; Chauhan and Kumar, 2000; Sundar et al., 2000a; Vyas, 2002; Aryal et al., 2009). The present study appeared to confirm some of the earlier findings with reference to the state of Uttar Pradesh, but differed in some others. These discrepancies were attributed partially to different methodologies adopted for the study. In previous studies, sampling and mathematical extrapolation were, necessarily, adopted. The present study involved an extensive “point counting method” covering 1,547 points spread over the entire state. This count was a complete count involving some 500 front line workers, thereby avoiding the need for ex-trapolation of data. A total count of the population and the evaluation of habitat threats were considered an im-provement over previous studies.
The ISC census and habitat data collection re-ported here was accomplished in summer, the non-breeding period, on a particular day to enhance data accu-racy. Data collection was designed to coincide with a time
that most juveniles have not yet departed from the terri-tories, which provides the most accurate population esti-mates (Sundar and Chaudhary, 2008). Several individu-als found difficulty in getting exact head counts of the cranes during field observation. These difficulties were encountered mainly with the groups (<20 cranes) that flew due to disturbance just before the count could be completed and counting of larger groups or congrega-tions (>20 cranes) due to overcrowding and movements within the group. Obviously, such difficulties may have affected the accuracy of the count for the total number of cranes.
Post-census interviews with various partici-pants indicated possible variation in the count by 10 to 15%. One of the observers also reported perceived un-derestimation by 10%. Chaudhary, B.C. (personal com-munication) suggested that a 10% error is possible in this kind of survey. However, all the results and discus-sions in the present paper are based on the count as re-ported from the field.
Of the 1,380 questionnaires circulated in 69 districts, 819 responses (59%) were received from 34 districts. Responses were received from over the entire state and represented all of the ACZs. Thus, the response can be treated as fair assessment of the parameters by qualitative methods since 50% of return of questionnaire or response rate and 30% of random coverage of an area is considered adequate representation for this methodol-ogy (Gillham, 2000).
Habit, Population and Distribution
Habit: Indian Sarus Cranes were mostly observed in pairs, families, groups, congregations, with very few as single cranes, which is considered by the authors as a healthy sign of a growing population as these population habits indicate the presence of potential breeders (pairs), breeding populations (families), mixture of potential breeders and breeding populations (groups), and non-breeding but potential breeders (congregations and solo cranes). This assemblage also reflects the period of a year when cranes do not face the scarcity of food and water resources, generally pre-monsoon and winter (Singh and Tatu, 2000; Sundar and Chaudhary, 2008). However, false congregation cannot be fully ruled out as cranes were seen together in this study on a very hot day during a water-scarce summer period, thereby forcing cranes to assemble near water bodies to meet their water needs. There are earlier records of social organizational behavior of Sarus Cranes seen in pairs, or family groups, and congregation up to 200 birds during non-breeding season for mate finding (Gole, 1991a & b; Vyas, 1999; Singh and Tatu, 2000; Sundar et al., 2000b).
In this study, ISC were observed to rely on both vegetarian and non-vegetarian food materials. Although paddy rice and wheat were the most-liked food grains cranes also consumed other seasonal and regional crops like maize, millets, peas, beans, mustard etc. Insects, small fish and aquatic vegetation were the regular food. This result further confirms earlier reports that cranes are omnivorous (Singh and Tatu, 2000), opportunistic feeders (Sundar and Chaudhary, 2008) and that their diets include aquatic plants, invertebrates and grains (Johnsgard, 1983; Meine and Archibald, 1996b). In drier
regions where paddy rice and wheat are not common, cranes survive on maize, pearl millet, soybean and mus-tard (Vyas, 2002).
Population: Relative to the Sarus Cranes counted during present study in UP, earlier mention by Sundar (2002) that “IUCN estimates that there are about 8,000-10,000 ISC left in the world today”, appears a slight underestimation. Our counts indicate that UP, one of the leading states in ISC population (Sundar, 2002), has 11,905 adults and juveniles. Likewise Gujarat is estimated to have 1,730 (Singh and Tatu, 2000), Rajasthan with 332 (Vyas, 2002) and other states 183 (Sundar et al., 2000a). An additional 168 were reported in trans Indian Nepal Tarai (Aryal et al., 2009). These estimates should be considered a mini-mal numbers as they were derived from encounter counts rather than total counts, as performed in this study. The estimate of a 1989 survey suggesting 13,000 cranes (Gole, 1989) and that by Meine and Archibald (1996a) of 10,000 cranes in the entire country may be possibly underestima-tions. While it has been reported that the Sarus crane population has diminished by 2.5% to 10% from the 1850’s (Bird Base, 2001), the 1850s estimate (14,444) is not greater than the total estimated at the current time (14,518). This result suggests the need for further to as-certain the ISC number in India and to verify the asser-tions of a declining population of this species (Chauhan et al., 2004). An earlier report by Sundar et al. (2000a) men-tioned ISC populations in only 19 selected districts of UP with a total of 1,398 cranes from 57 sites. In the same districts, a 2008 census by the UP Forest Department esti-mated 3,966 cranes (file records, UP Forest Department). These two reports have estimates well below the present finding of 6,195 ISC recorded at 673 sites in the same districts of UP. Chauhan and Kumar (2000) reported ISC number to be 3,000 in Etawah and Mainpuri districts which appears to be a minor underestimation as compared to the present count of 3,692 ISC in these two districts. Based upon these findings, the hypothesis of a declining ISC population in the state of UP should be subjected to a more critical examination. Moreover, there is a mention in the literature (Mukherjee et al., 2002a; Sundar, 2009) that ISC population has stabilized in UP, which is more in concert with the findings of the study reported here. Distribution: Six contiguous districts of UP, three from CPL (Auraiya, Etawah and Kanpurdehat) and three from SAP (Etah, Mahamayanagar and Mainpuri) have the high-est population of cranes in the state and can be considered as the nucleus/core zone of the ISC population in Uttar Pradesh, India. This observation supports previous obser-vations of the highest crane density and encounter rate in Etawah and Mainpuri districts (Chaudhary et al., 1999; Sundar et al., 1999, Chauhan and Kumar, 2000; Sundar et al., 2000a; Sundar, 2002; Archibald et al., 2003; Sundar, 2005). Sundar (2010) suggests that ISC are very widely distributed in Uttar Pradesh, and can be reasonably ex-pected to be encountered in every district at some time during the year. In this study, 16 districts, mainly in the south eastern part of the state, comprising 19% of geo-graphical and 21% of wetland areas of the state were found to be devoid of ISC populations. Although the counts in this study were made on a single day, the
previously-assumed occurrence of cranes across the en-tire state may not be valid, as long-range migration has not been reported for this species.
Population density indicates the concentration of the population with reference to space and is consid-ered useful in understanding the resource utilization of that space. Since ISC populations are generally confined in and around wetlands and the resources of whole geo-graphical area is not utilized, crude density (population size divided by surface area of the district, zone, or state) as suggested by Singh and Tatu (2000) may not be as useful as the refined or improved density (ratio of popu-lation to the wetland area in the district, zone, or state). This latter ratio should be considered for analytical pur-poses as it estimates the number of ISC per unit of habit-able area.
In this study, the Bundelkhand Zone had the largest wetland area (110,760 ha), but the lowest im-proved population density (0.2/ km2). Conversely the South Western Semi-arid Plain had the lowest wetland area (60,606 ha) and the highest improved population density (9.1/ km2). This result suggests that water avail-ability for ISC is not the only factor that controls habitat selection. Type and abundance of food material outside the water body may also play a role as this species is a selective grain eater. Paddy rice, wheat, bajra and jowar are considered the most favored food grains, while pi-geon pea, mustard, soybean etc. are less favored.
The agricultural landscape could also play a role in distribution of the crane population as sugarcane and pigeon pea stands appear to be avoided, perhaps due to the impenetrability or obstruction in the cranes’ free movement, coupled with the non-palatability of the crop. Flood-affected plains are not suitable for crane habita-tion since breeding period and flood incidence often coincide. Additionally, sugar cane cultivation surround-ing ISC habitat is reported to be one of the threats to conservation of this species (Aryal et al., 2009).
Absence of ISC in surveyed forested areas could be explained to the fact that this bird prefers open area for easy take offs and landings (Mukherjee et al., 2002b), due to its large size and almost regular, local and diurnal flights for foraging and thermal needs (Meine and Archibald, 1996b). Also, increased height of vegetation hampers the crane’s movement (Mukherjee et al., 2002b).
Low populations of cranes in highly protected and open wetland habitats (bird sanctuaries and the wildlife sanctuaries) appears to be the result of a lack of shallow or marshy area in such wetlands, in turn reduc-ing food availability and nestreduc-ing environments. Sarus cranes avoid deep reservoirs and other wetlands for habitation (Borad et al., 2001) and, although ISC is wet-land bird, it prefers nesting in marshwet-land and paddy rice (Sundar 2009) of water depth varying between 25 and 65 cm (Mukherjee et al., 2000).
The proportion of young in the population is an important parameter that indicates the rate of recruit-ment and the extent of breeding success in a particular year (Sundar and Chaudahry, 2008). Adult and juvenile proportion (juveniles per hundred adults: jpha) or fresh recruitment (juvenile percentage in total population: jptp) are used as indicators of population growth.
Juvenile proportions and fresh recruitment in the present study averaged 15 jpha and 13 jptp, respectively, for the state. These values are well within the reported range of 11 – 19 jpha and 4 – 13 jptp, respectively, for Uttar Pradesh, Rajasthan, Gujarat and Madhya Pradesh (Sundar et al., 2000b). For Rajasthan these values are 19 jpha and 16 jptp (Vyas, 2002). Johnsgard (1983) considered a fresh recruitment rate of 16.7% in Grus antigone very high, while Archibald et al. (1981) reported presence of 10-15% juveniles as a healthy population. Based on reported values, the jpha of 13% indicates a healthy population of ISC in UP.
However, fresh recruitment rates were not uni-form across the various ACZs of the state. Western ACZs such as WPL (13%), CWP (13%), SAP (18%), northern zone like TAR (13%) and eastern zone like NEP (13%) had encouraging rates of breeding while eastern zone like EPL (4%); and southern zone like BKD (6%) were of concern. The zone which merits the greatest concern is the Central Plain where the rate of recruitment was low (8%) and population of cranes was the highest (4,578) among all ACZs. If the recruitment rate does not improve in near future, immediate efforts of conservation may be war-ranted. The species has a relatively low recruitment rate across the entirety of India (Meine and Archibald, 1996a). Given this lower rate in the most heavily populated zone, the overall effect, in the long run, may be a decline of ISC within the country.
Habitats and Threats
Habitat use: At one time, Sarus were considered as wet-land cranes (Johnsgard, 1983). Later, this notion was modified based upon the observation that cranes were using agriculture fields as both nesting and foraging grounds (Sundar, 2003). Vyas (2002) and Gole (1989) reported that the most favored habitat were wetlands (73-85%) as compared to crop fields (27-15%). Sundar et al. (2000b) reported that most of the ISC were seen in agri-cultural fields (53%) in both summer as well as winter in UP. In the present study, cranes were found mainly asso-ciated with the wetlands (77%) and agriculture fields (14%). This result is similar to earlier reports of Archibald and Lewis (1996) that Sarus cranes feed in both uplands and wetlands during breeding as well as non-breeding seasons. It is recognized that the present observation in favor of wetlands may partially be biased due to the counting during the summer season when the birds tend to stay near a water body. As recorded by Mukherjee (1999) population fluctuations across habitats by Sarus is highly season dependent.
Habitat threats: Apart from the crop composition and edaphic-climatic factors, alterations in the physical quality or quantity of crane habitats could also be a controlling factor of population distribution across Agro-climatic Zones. Decline in Sarus populations is mainly attributed to the loss of wetland habitat (RDB, 2003). Wetlands have been lost and degraded due to agricultural expansion, in-dustrial development and pollution throughout southern and southeast Asia (Meine and Archibald, 1996b). In this study, the most densely ISC-populated zones such as SAP and CPL have the highest general and pollution threats (values) to crane habitats. The most sparsely ISC-
populated zones such as BKD, TAR and WPL have mini-mum habitat threats. This apparent contradiction may possibly be that the level of threat in the higher-ranking zone has not reached the extent which could adversely affect the ISC population. While not often considered, it is also possible that pollution could provide habitat bene-fits. For example, a high population of insects due to household pollution may increase food availability for the cranes.
Conservation Strategy
Government owned wetlands are regulated for conserva-tion of species found therein by generally not allowing hunting and providing some habitat improvement meas-ures. Indian Sarus Cranes get protection in these wet-lands but the number of such habitats is limited in UP and the populations of ISC on these wetlands are rela-tively low. Management of community-owned reserves where the use of resources is relatively uncontrolled is also an issue. However, the greatest concern for ISC habitat management is on privately owned property where the bird is exposed to a number of risks due to its pest nature.
Four out of nine ACZ of the state, which harbor 43% of UP’s ISC population have a lower recruitment rate than the state average. Habitat loss, modification, and degradation in these zones are major concerns from conservation point of view. Crane population declines may also be attributed to agriculture-related activities like crop management, fertilizer and pesticide use, etc. (Borad et al., 2002; Pain et al., 2004). Conservation improve-ment measures previously discussed in different publica-tions are legislation, creation of reserves and education. The first two measures are believed to have limited effec-tiveness due to the lack of implementation of legal provi-sions in third world countries. The third measure, educa-tion, would likely have longer lasting impacts as it would generate self-involvement of the people in conservation efforts. The success of education was earlier confirmed by Kaur et al. (2008) in their findings that it is possible to re-establish a bond between farmers and nature by educa-tional campaigns relative to Sarus conservation. Sundar and Chaudhary (2008) have also argued that educating private wetland owners will help reduce deterioration of wetlands and in turn enhance conservation efforts.
Results of the questionnaire survey in this study indicated that 90% of respondents believe that Sarus con-servation could be improved by government compensa-tion for crop damage by the cranes. Borad et al. (2002) and Mukherjee et al. (2002a) drew similar conclusions that financial assistance to the farmers for conservation in lieu of paying for crop damage during nesting would reduce egg-chick damage, and, in turn, would improve breeding performances of the cranes. During informal interviews in this study, it was suggested that such pay-ments for conservation was a short term gain as the monetary assistance by the state could not be perpetual. Likewise, it was believed that such payments would re-sult develop a dependency attitude in the populace. Parasharya et al. (1996) advocated that education of farmers through religious teaching may bring dividends in the effort of co-existence of Sarus with human habita-tion and surrounding agricultural systems.
CONCLUSION
Data collected during the count survey presents current Sarus demography and ecology in UP. The population of ISC was determined to be 11,905; and though based on a spatial study and not temporal one. These results, while believed to be significant, can and should be strengthened by collecting additional temporal data. An improved un-derstanding of the on-site situations could be used in for-mulating specific conservation plans for the species in the state of UP and for specific ACZs.
Recruitment rates, higher than what is considered as the healthy range in some ACZs and lower in others, suggests the need of priority in terms of management in-tervention. Such intervention would allow the mainte-nance of desired recruitment rates where they currently exist, and would enhance rates when current recruitment is less than desired.
One of the conservation improvement strategies is that of promoting education efforts on long-term basis by focusing on the emotional attachment of the people to the crane and by emphasizing the importance of this spe-cies in the ecosystem. Habitat improvement by arresting and reducing threats such as pollution, agricultural expan-sion, etc. in order to provide favorable surroundings could be a complementary strategy of conservation.
These strategies would necessarily be applied to differently and to varying degrees depending upon whether the landowner/manager is a governmental agency/community group, or private entity.
ACKNOWLEDGEMENTS
The authors wish to thank Dr G A Kinhal, IIFM Director for encouragement and financial support. We also thank the Principal Chief Conservator of Forests, Wildlife UP for initiating the ISC census in the state under the auspices of Sarus Protection Society, UP. Forestry personnel, local participants and volunteers are also acknowledged for their commitment in crane counting and data collection. Special thanks are due to Anand Prakash who entered the large amount of data and Dr Ompraksh, IIFM for redraw-ing the maps.
REFERENCES
Ali, S. and S.D. Ripley. 1980. Handbook of the birds of India and Pakistan. Vol. 2. Megapodes to Crab Plovers. Oxford University Press, Delhi.
Anonymous. 2009. Kharif faslon ki saghan padhatiyan. Krishi Vibhag, Uttar Pradesh, Lucknow.
Archibald, G.W. and J.C. Lewis. 1996. Crane Biology. Pages 1-30 in Cranes: their biology, husbandry and conservation.(D.H. Ellis,G.F.Gee and C.M. Mirande, Eds.). Department of the Interior, Na-tional Biological Service. Washington DC. Archibald, G.W., Y. Shigeta, K. Matsumoto and K.
Mo-mose. 1981. Endangered cranes around the world. Pages 1-12 in Proceedings of International Crane Symposium at Sapporo, Japan. 1980.(J.C. Lewis and M. Matsatomi, Eds.). International Crane foundation. Baraboo, USA.
Archibald, G.W., K.S.G. Sundar, and J. Barzen. 2003. A review of the three subspecies of sarus crane Grus antigone. Journal of Ecological Society, India.
16:5-15.
Aryal, A., T.K. Shrestha, D.S.Sen, B. Upreti and N. Gautam. 2009. Conservation regime and local population ecology of sarus crane (Grus anti-gone antianti-gone) in west central region of Nepal. Journal of Wetland Ecology. 3:1-11.
BirdBase 2001. Sarus Crane: Threatened birds of Asia. http://birdbase.hokkaido-ies.go.jp/rdb/rdb-en/ grusanti.pdf, accessed 12 November 2010. Borad, C.K., A. Mukherjee and B.M. Parasharya.2001.
Nest site selection by the Indian sarus crane in the paddy crop agro-ecosystem. Biological Con-servation. 98: 89-96.
Borad, C.K., A. Mukherjee, S.B. Patel and B.M. Parasharya. 2002. Breeding performance of In-dian Sarus Crane Grus antigone antigone in the paddy crop agro-ecosystem. Biodiversity and Conservation. 11:797-805.
Chaudhary, B.C., J. Kaur and K.S.G. Sundar. 1999. Sa-rus crane count – 1999. Wildlife Institute of India, Dehradun, India.
Chauhan, R. and D. Kumar. 2000. A survey of Sarus cranes (Grus antigone) in Etawah and Mainpuri districts, Uttar Pradesh, India. Society for Con-servation of Nature Etawah (UP), India. Techni-cal Report.
Chauhan, R., J. Bose, N. Agarwal, B. Dutt and A.Mookerjee. 2004. Crane Capital. Conserva-tion strategy for Sarus crane (Grus antigone) habitats in Etawah and Mainpuri districts, Uttar Pradesh.
Gillham, B. 2000. The research interview. Continuum. 1 -52 and 91-94 pp.
Gole, P. 1991a. Welfare of the tallest flying bird in the world. Journal of Ecological Society. 4:29-42. Gole, P. 1991b. The life and times of the tallest flying
bird in the world. Sanctuary Asia. 11:26-35. Gole, P. 1989. The status and ecological requirement of
Sarus crane. Phase I. Paper presented in the Asian Crane Congress at Rajkot, Gujrat, India. Johnsgard, P.A. 1983. Cranes of the world: Sarus Crane
(Grus antigone). http://digitalcommons.unl.edu/ bioscicranes/26, accessed 12 September 2010. Kaur, J., A. Nair and B.C. Chaudhary. 2008.
Conserva-tion of vulnerable Sarus crane, Grus antigone antigone in Kota, Rajasthan, India: a case study of community involvement. Oryx 42:452-455. Meine, C.D. and G.W. Archibald (Eds.). 1996a. The
cranes: - status survey and conservation action plan. IUCN Gland, Switzerland and Cambridge, UK. http://www.npsc.nbs.gov/resource/distr/ birds/cranes/cranes.htm#contents, accessed on 24 August 2010.
Meine, C. and G.W. Archibald. 1996b. Ecology, status and conservation. in cranes: their biology, hus-bandry, and conservation (D.H. Ellis, G.E. Gee and C.M. Mirande, Eds.). Department of the Interior, National Biological Service, Washing-ton DC. Pages 263-292.
Mukherjee, A. 1999. Ecological study on the Indian Sarus Crane Grus antigone in the central Guja-rat. Ph. D. Dissertation, Saurashtra University, Rajkot, Gujarat.
Mukherjee, A., V.C. Soni,C.K. Borad and B.M. Parasharya. 2000. Nest and eggs of Sarus crane (Grus antigone antigone Linn.). Zoo’s Print Jour-nal. 15:375-385.
Mukherjee, A., C.K. Borad and B.M. Parasharya. 2002a. Breeding performance of Indian Sarus Crane in the agricultural landscape of western India. Bio-logical Conservation. 105:263-269.
Mukherjee, A., C.K. Borad and B.M. Parasharya. 2002b. Comparative account of population and breeding pair density of the Indian Sarus Crane (Grus anti-gone antianti-gone) in Kheda district, Gujarat. Zoo’s Print Journal. 17:839-843.
Nandi, P.K. 2006. Protection of habitat of Sarus crane Grus antigone in Bhoj wetland, India. In: Water-birds around the world: a global overview of con-servation (G.C. Boere, C.A. Galbraith and D.A. Stroud Eds.). The Stationery Office, Edinburgh, UK. Pages 309-310.
Pain, D.J., R. Gargi, A.A. Cunningham, A. Jones and V. Prakash. 2004. Mortality of globally threatened Sarus cranes Grus antigone from monocrotophos poisoning in India. Science of the Total Environ-ment. 326:55-61.
Parasharya, B.M., K.L. Mathew and A.G. Sukhadia. 1996. Relevance of agricultural ecosystem to birds and their conservation. Pan Asian Ornitho-logical Congress and XII BirdLife Asia Confer-ence, Coimbatore, India.
Red Data Book (RDB) . 2003. Threatened birds of Asia. http://www.rdb.or.id/index.html.
Remote Sensing Application Centre (RSAC). 2009. Wet-lands of Uttar Pradesh. Scientific Report of Re-mote Sensing Application Centre, Lucknow, Uttar Pradesh.
Singh, H.S. and K. Tatu. 2000. A study on Indian Sarus Crane (Grus antigone antigone) in Gujarat state. Gujarat Ecological Education and Research (GEER) Foundation, Gandhinagar, India.
Singh, G.B., J.P. Jaiswak, I.B. Singh and A.K. Singh. 2003. Constraints and priorities for research and development in agriculture and allied sectors of Uttar Pradesh. UPCAR, Lucknow.
Sundar, K.S.G. 2010. Sarus cranes in Uttar Pradesh. Kat’s Eye. 2: 2-4.
Sundar, K.S.G. 2009. Are rice paddies suboptimal breeding habitat for Sarus cranes in Uttar Pradesh India? Condor. 111:611-623.
Sundar, K.S.G. 2005. Effectiveness of road transacts and wetland visits for surveying black necked storks Ephippiarhynchus asiaticus and Sarus crane Grus antigone in India. Forktail. 21:27-32.
Sundar, K.S.G. 2003. Using road transact to monitor abundance, demography and habitat use of Sa-rus cranes, Grus antigone: A case study from Etawah and Mainpuri districts, Uttar Pradesh. Unpublished report submitted to ICF, USA. Sundar, K.S.G. 2002. Conservation of the Sarus crane
in India: A life history perspective. The Na-tional Science Magazine. June 2002, 34-37. Sundar, K.S.G. and B.C. Chaudhary.2008. Impact of
land use changes on the ecology and habitat of the Sarus crane (Grus antigone antigone) in the Indo-Gangetic flood plains. Part II: Uttar Pradesh. Wildlife Institute of India.
Sundar, K.S.G., B.C. Chaudhary and J. Kaur. 2000a. Sarus crane count – 2000. Wildlife Institute of India, Dehradun, India.
Sundar, K.S.G., J. Kaur and B.C. Chaudhary. 2000b. Distribution, demography and conservation status of the Indian Sarus Crane (Grus antigone antigone) in India. Journal Bombay Natural History Society. 97:319-339.
Sundar, K.S.G., J. Kaur, and B.C. Chaudhary. 1999. Distribution, general ecology and conservation status of the Indian Sarus Crane (Grus antigone antigone) in India. Report of an all India sur-vey. 1998-99. Wildlife Institute of India, De-hradun.
Vyas, R. 1999. Breeding success and chick mortality in Sarus cranes. Newsletter for Birdwatchers. 39:5 -7.
Vyas, R. 2002. Status of Sarus crane Grus antigone antigone in Rajasthan and its ecological re-quirements. Zoos’ Print Journal. 17:691-695.