Assay for All
Plasmodium falciparum
Gametocyte Stages
Zenglei Wang1, Min Liu1,2, Xiaoying Liang1, Salil Siriwat1, Xiaolian Li1, Xiaoguang Chen2, Daniel M. Parker1, Jun Miao1*, Liwang Cui1*
1Department of Entomology, Pennsylvania State University, University Park, Pennsylvania, United States of America,2Department of Parasitology, School of Public Health and Tropical Medicine, Southern Medical University, Guangzhou, Guangdong, P.R. China
Abstract
Background: Malaria elimination/eradication campaigns emphasize interruption of parasite transmission as a priority strategy. Screening for new drugs and vaccines against gametocytes is therefore urgently needed. However, current methods for sexual stage drug assays, usually performed by counting or via fluorescent markers are either laborious or restricted to a certain stage. Here we describe the use of a transgenic parasite line for assaying drug sensitivity in all gametocyte stages.
Methods:A transgenic parasite line expressing green fluorescence protein (GFP) under the control of the gametocyte-specific genea-tubulin IIpromoter was generated. This parasite line expresses GFP in all gametocyte stages. Using this
transgenic line, we developed a flow cytometry-based assay to determine drug sensitivity of all gametocyte stages, and tested the gametocytocidal activities of four antimalarial drugs.
Findings:This assay proved to be suitable for determining drug sensitivity of all sexual stages and can be automated. AZ’
factor of 0.7960.02 indicated that this assay could be further optimized for high-throughput screening. The daily sensitivity of gametocytes to three antimalarial drugs (chloroquine, dihydroartemisinin and pyronaridine) showed a drastic decrease from stage III on, whereas it remained relatively steady for primaquine.
Conclusions:A drug assay was developed to use a single transgenic parasite line for determining drug susceptibility of all gametocyte stages. This assay may be further automated into a high-throughput platform for screening compound libraries againstP. falciparumgametocytes.
Citation:Wang Z, Liu M, Liang X, Siriwat S, Li X, et al. (2014) A Flow Cytometry-Based Quantitative Drug Sensitivity Assay for AllPlasmodium falciparum
Gametocyte Stages. PLoS ONE 9(4): e93825. doi:10.1371/journal.pone.0093825
Editor:Georges Snounou, Universite´ Pierre et Marie Curie, France
ReceivedJune 13, 2013;AcceptedMarch 9, 2014;PublishedApril 15, 2014
Copyright:ß2014 Wang et al. This is an open-access article distributed under the terms of the Creative Commons Attribution License, which permits unrestricted use, distribution, and reproduction in any medium, provided the original author and source are credited.
Funding:This work was supported by grants (U19 AI089672) from the National Institute of Allergy and Infectious Diseases, NIH (http://www.niaid.nih.gov/Pages/ default.aspx). The funders had no role in study design, data collection and analysis, decision to publish, or preparation of the manuscript.
Competing Interests:The authors have declared that no competing interests exist.
* E-mail: [email protected] (JM); [email protected] (LC)
Introduction
Malaria remains a major public health menace throughout the tropics and subtropics and is responsible for nearly one million deaths annually. The past decade has witnessed increased investment in malaria control, and extensive international efforts have led to a considerable reduction of malaria incidence even in sub-Saharan Africa. With improved financial and technical supports, there are renewed interests in malaria elimination [1]. However, the current malaria control tools might not be sufficient for achieving this ambitious goal, and there are key knowledge gaps in our understanding of the tripartite interactions among malaria parasites, vectors and humans.
Of the four human malaria parasites,Plasmodium falciparumis the most prevalent species and causes the most severe malaria. In human red blood cells (RBCs), asexual replication of the parasite is associated with the morbidity and mortality of the disease, whereas the sexual stages, or gametocytes, are essential for continued transmission of the parasites from humans to mosquitoes [2,3]. Consequently, control measures that target gametocytes need to
Most assays for measuringin vitrodrug susceptibility of asexual
P. falciparum parasites rely on the detection of DNA replication, which are apparently not suitable for gametocyte stages due to the lack of DNA replication during gametocytogenesis. Gametocyte
development in P. falciparum is a lengthy process with five
morphologically distinctive stages, and it takes 10–12 days for gametocytes to reach maturity. Earlier attempts to assess gametocytocidal activities of drugs used microcopy [12,13]. This method, however, is laborious and it is difficult to distinguish early gametocyte stages from asexual stages. Recently, new methods were developed based on the use of alamarBlue or hydroethidine as fluorescent markers of metabolic activities [6,14,15] and
bioluminescence measurement of intracellular ATP levels
[16,17]. However, these methods are mostly developed for late gametocyte stages and the requirement for large numbers of gametocytes limits their uses for high-throughput screening (HTS) purposes. To circumvent this limitation, reporter lines with gametocyte-specific green fluorescent protein (GFP) and luciferase expression were developed, allowing for more accurate measure-ment of gametocytocidal activities of antimalarial drugs using flow cytometry (FCM) and chemiluminescence, respectively [18,19]. Yet, these transgenic lines were generated using different promoters in order to obtain maximum reporter gene expression in early, middle, or late gametocyte stages. Therefore, it requires up to three transgenic lines for monitoring drug sensitivity during the entire period of gametocytogenesis. In this study, we report a robust FCM-based method for quantitative measurement of responses ofP. falciparumgametocytes to antimalarial drugs based on the combination of a transgenic GFP-expressing line and synchronous gametocyte culture technique. This transgenic line is suitable for determining drug sensitivity of all gametocyte stages and may be fully automated and used for HTS of compound libraries against P. falciparum gametocytes. Using this assay, we analyzed the daily dynamics of sensitivity of gametocytes to several antimalarial drugs.
Materials and Methods
Ethics
RBCs were purchased from Biological Specialty Co. (Colmar, PA, USA, http://www.biospecialty.com/), and human serum was purchased from Interstate Blood Bank Inc. (Memphis, TN, USA, http://www.interstatebloodbank.com/). Since both RBCs and human serum were purchased from commercial sources with no personal information associated with the products, ethical approval from the Pennsylvania State University Institutional Review Board was exempted.
Generation of a Stable GFP-expressing Line
To establish a parasite line with gametocyte-specific GFP expression, we generated a reporter cassette with the GFP open reading frame flanked by a,1155 bp fragment of the 59sequence
ofa-tubulin IIgene as the promoter and the 39sequence of theP.
bergheidihydrofolate reductase/thymidylate synthase (dhfr/ts) gene (pDT39). The a-tubulin II promoter was amplified using primer
pairs Tub 59F and Tub 59R (Table S1 in File S1). This reporter construct was cloned into the plasmid pCC4 atSpeI andNotI sites to replace the drug selection cassette of cytosine deaminase [20]. The resulting construct pCC4/a-tubII-GFP was transfected into
3D7 parasites using the method of RBC loading [21]. The transfected parasites were selected using 2.5mg/ml of blasticidin (BSD) until parasites re-appeared in the culture. Two cycles of BSD drug on/off with 3 weeks of intervals were performed in order to enrich parasites with the plasmid integrated into the
parasite genome. The integration site was determined by integration-specific PCR, with the parental line 3D7 as the control. Based on three possible scenarios of integration (Figure. 1A), three sets of primers (F16R1, F26R2, and F36R3)
were used to detect the integration of the plasmid at thea-tubulin II
promoter, calmodulin promoter and hrp2 39 region, respectively (Table S1 in File S1). Accessibility of the potential sites for homologous recombination was assessed with additional primers R1-1, R2-1 and F3-1 (Table S1 in File S1). Subsequently, parasites were cloned and the positive clones were confirmed by the visualization of GFP expression in gametocytes under a fluores-cence microscope. Quantitative PCR (qPCR) was performed in order to evaluate the copy number of the GFP construct using a published method [22].
Gametocyte Induction
P. falciparum parasite lines were routinely cultured in type O+ RBCs in complete medium supplemented with 10% human AB
serum under an atmosphere of 90% N2/5% O2/5% CO2[23].
Synchronous gametocytes were induced using a previously described scheme with modifications [24]. Asexual parasites were synchronized twice in two successive life cycles by 5% D-sorbitol treatment of ring-stage parasites for 10 min at 37uC. Synchronous cultures at the trophozoite stage were set up at a parasitemia of 2.5–3.2% and a hematocrit of 3% in 50 ml of complete medium in T75 flasks. On the second day (day -2), ring-stage parasitemia typically reaches to 8–12%. To induce gametocytogenesis, a part of spent medium was replaced by fresh medium. The volume of spent medium replaced depended on the parasitemia: for a parasitemia of approximately 8, 10, and 12%, 20, 25 and 30 ml of spent medium was replaced by fresh medium, respectively. On the third day (day -1), stressed schizont cultures including spent medium were transferred into T225 flasks and adjusted with fresh
RBCs and medium to a parasitemia of,2% and a hematocrit of
3%. Cultures on day 1 were exposed to 5% D-sorbitol followed by 70% Percoll (v/v) gradient centrifugation to eliminate asexual stage parasites. From day 1 onward, 20 units/ml of heparin were added to the culture to block invasions of RBCs from residual contaminating asexual stages [25]. Medium were changed daily and Giemsa-stained smears were examined to monitor develop-ment.
FCM
FCM analysis was performed on a Beckman Coulter XL-MCL system with 15 mW continuous laser power at 488 nm. Two band pass filters, 525 nm for the fluorescein isothiocyanate (FITC) channel and 575 nm for the phycoerythrin (PE) channel, were used to define green-emitting-only signals. Fluorescence of gametocytes was determined by documentation of green (fluores-cence 1, FITC channel) and red fluores(fluores-cence (fluores(fluores-cence 2, PE channel). To choose a gate for quantification of green-emitting-only signals in the FITC channel, gametocytes of the transgenic GFP-expressing line 3D7a-tubII/GFP
(FI) of the amount of fluorescence cells by the following formula:
FI = normalized gating count6MnX.
Characterization of the Assay Parameters
To compare the sensitivity of microscopy and FCM for quantifying gametocytemia, stage III gametocytes were purified by Percoll gradient centrifugation [26] to remove dead parasites, which may interfere with the assay. After purification, thin smears were made and stained by Giemsa, and 20,000 RBCs were counted by microscopy to determine gametocytemia. Then, gametocytes were diluted with RBCs to the range of 0.025– 0.2%. After dilution, gametocytemia was determined in parallel by
counting,50,000 RBCs under a microscope and counting half a
million events with FCM. The results of measured gametocyte levels were plotted against the calculated values in a linear regression.
To determine whether GFP in the dying or dead cells might interfere with the assay, the ratios of signals with and without PMQ treatment were calculated using gametocytes at stages I–V. Gametocyte cultures of 3D7a-tubII/GFP
at stages I–V were seeded in wells at 1% hematocrit and 0.02% gametocytemia. Eight wells
were treated with a lethal dosage of 625mM PMQ, and GFP
fluorescence intensities were compared with corresponding posi-tive control wells without drug treatment. The total volume of each well was 200ml. After incubation for 48 h at 37uC, the cultures were applied to FCM, and the data for each pair at the same stage were collected in order to calculate the FI. The values of control wells without drug treatment were the maximum signals, and those of the drug treated wells were the minimum signals. The maximum/minimum signal ratios were calculated and analyzed. All experiments included two biological replicates each with three technical replicates. To differentiate live from dying or dead parasites, stage V gametocytes were first treated with 100mM PMQ at 37uC for 48 h and then stained with the red fluorescent dye JC-1, a mitochondrial probe, to allow real-time visualization of live (extensive staining), dying (faint staining) or dead (no staining) gametocytes [27]. To quantify GFP and JC-1 signals by FCM, stage V gametocytes were treated with 500, 250,
125 and 62.5mM of PMQ at 37uC for 24 h. Untreated
gametocytes were used as a control. The parasites were stained with JC-1 and applied to FCM. Green fluorescence of GFP was documented by the FITC channel as described above, and afterwards red fluorescence of JC-1 was documented by the PE channel. Data were collected and shown as histograms of values of fluorescence.
Determination of the Assay Z’ Factor
To determine the robustness of the assay, the Z’-factor statistic was determined by using uRBCs as background, and gametocytes at stage III of the PMQ treated and untreated transgenic line as negative and positive controls, respectively [28]. Negative controls
were treated by 500mM of PMQ. In a 96-well plate, uRBCs were
seeded in 8 wells with a hematocrit of 1%, cultures of the negative control were seeded in 40 wells, and cultures of positive control were seeded in 48 wells. The plate was then incubated at 37uC for 48 h and analyzed by FCM. Three independent experiments were performed. The Z’ factor was calculated using the equation Z’ = 1–3 (SDpositive+SDnegative)/(Meanpositive2Meannegative), where
SDpositiveand SDnegativewere the standard deviations of positive
and negative controls, respectively, while Meanpositiveand
Mean-negative represented the mean FI values of positive and negative
controls, respectively.
In vitroDrug Sensitivity Assay
A final 0.02% gametocytemia was used for the drug assay in order to minimize the cost in parasite culture. To determine drug sensitivity of gametocytes, 100ml of the cultures from day -1 to 11 were diluted in a complete medium with fresh human erythrocytes to a 2% hematocrit and 0.04% gametocytemia, and placed into each test well of 96-well plates prefilled with the test drugs to a final volume of 200ml and final hematocrit of 1%. Because young gametocytes at day -1 (stressed schizonts) and day 0 could not be separated, gametocytemias were determined by counting with FCM the fluorescent gametocytes in culture, which contained asexual stage parasites. The plates were incubated at 37uC for 48 h. Chloroquine (CQ), PMQ and dihydroartemisinin (DHA) were purchased from Sigma (St Louis, MO, USA), while pyronaridine (PND) was obtained from Kunming Pharmaceutical Co. (Kunming, Yunnan, China). The stock solutions of CQ (100 mM), PMQ (100 mM), and PND (20 mM) were prepared in RPMI 1640, and DHA (143 mM) was dissolved in DMSO. Two-fold serial dilutions of each drug were made in a complete medium, with the concentration range of each drug shown in Table 1. For each parasite isolate and drug concentration, the assay was performed with at least three biological replicates, each with two technical replicates.
Data Analysis
Raw FCM data were processed using the FlowJo software. An analysis of variance (ANOVA) was done by R [29]. Half maximal inhibitory concentration (IC50) values of the drugs were calculated
by using GraphPad Prism 5.
Results
Generation of Transgenic Parasites Expressing GFP in Gametocytes
In order to generate a transgenic parasite line with GFP expression in gametocytes, we transfected 3D7 with the pCC4/a
-tub II-GFP construct (Figure 1). After two cycles of drug on/off selection, parasites were cloned without drug. One parasite line designated as 3D7a-tubII/GFP
with strong GFP expression was selected for further characterization. This parasite line was cultured for over half a year without drug and remained GFP positive in gametocytes. Plasmid rescue from this parasite line did not yield positive clones, indicating that this parasite line contained no episomal copies of the transfected plasmid. qPCR analysis showed that there were,2.2 copies of the plasmid in the genome
(data not shown), suggesting that the plasmid might have been integrated as a dimer. We used integration-specific PCR to determine the genomic locus of the integration. Based on the presence of threeP. falciparumgenomic fragments in the pCC4/a
-tub II-GFP plasmid, namely, the 1a-tubulin IIpromoter,calmodulin
promoter, and the hrp2 39 region, three sets of primers were
gametocytogenesis, or from asexual parasites expressing the reporter [31]. The gametocyte-specifica-tubulin IIwas previously
considered to be male specific [30,32], but recently found to have promiscuous expression in both male and female gametocytes [31]. Consistently, GFP expression was observed in both sexes of gametocytes in the 3D7a-tubII/GFP
line by microscopy (Figure S1 in File S1).
Use of the Transgenic Line for Quantitation of Gametocytes by FCM
For its extraordinary abilities of signal detection and potential
for automation, FCM was used to determine whether the 3D7a
-tubII/GFP
line is suitable for quantifying gametocytes. The FITC channel (fluorescence 1) and PE channel (fluorescence 2) were used for detecting green and red fluorescence, respectively. Gating parameters were selected to specifically detect GFP fluorescence of stage I–V 3D7a-tubII/GFP
gametocytes in the FITC channel (Figure 3A). In comparison, the selected gates did not detect green fluorescence in the FITC channel in uRBCs (Figure 2B), aiRBCs (Figure 2C) or 3D7 gametocyte-infected RBCs (giRBCs, Figure 2D). These cells only emitted background autofluorescence, which appeared on the diagonal line of both FITC and PE channels. For detecting GFP gametocytes, gating in the FITC channel was chosen based on the performance of these negative controls. To affirm that the selected gating specifically detects GFP-expressing gametocytes, RBCs sorted based on autofluores-cence and FITC gating were examined by microscopy of Giemsa-stained smears. The results confirmed that the autofluorescent compartment only consisted of uRBCs and aiRBCs, whereas the FITC-gated part only contained gametocytes (data not shown). Under a fluorescent microscope, GFP signal appeared to increase from stage I to V (Figure 2). Using the defined FCM gating parameters, we determined the MnX of gametocytes, which increased from stage I through IV (Figure 3E). Yet, a decrease in MnX was observed in stage V gametocytes, which was reflected in the increase of cells emitting low levels of GFP fluorescence (Figure 3A). This might be due to the increase of dying and dead gametocytes in the stage V gametocyte population after being cultured for an extended period of time. This trend in GFP fluorescence during gametocyte development was confirmed in a separate experiment when FI of gametocytes was quantified under the conditions for drug assay at a 0.02% gametocytemia (Figure S2 in File S1).
To determine whether FCM quantification provides readouts directly proportional to the number of gametocytes, we compared
the FCM readout with the gametocytemia measured by micros-copy. Both methods showed a linear relationship between the
measured and calculated gametocytemias with an R2 value of
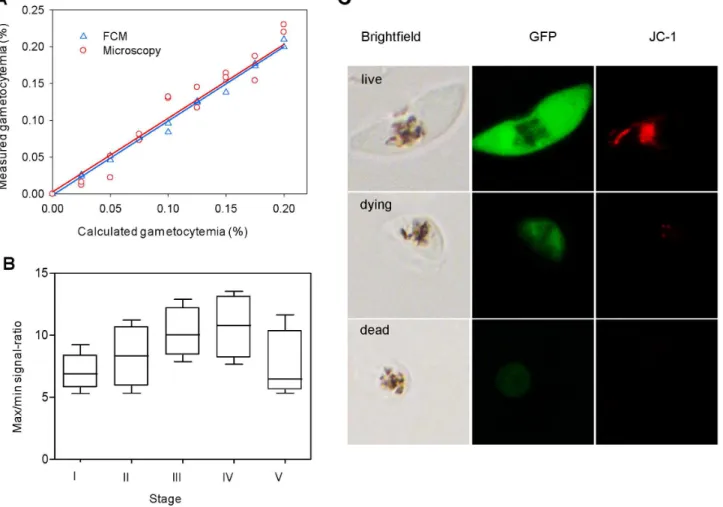
0.9953 for FCM and 0.9641 by microscopy. Further, there was no significant difference between the average gametocytemias from the results of ANOVA (F= 0.027;P= 0.871), demonstrating that the FCM method for calculating gametocytemia was highly precise (Figure 4A).
Given the possibility that marker proteins such as GFP may persist for an extended period of time in dying and dead gametocytes, which may interfere with the assay, we compared the GFP fluorescence in the control and PMQ-treated gameto-cytes. After a lethal dose of PMQ treatment, the dying and dead gametocytes showed a.7-fold decrease in GFP fluorescence, and this change in fluorescence intensity was more pronounced in gametocyte stage III and IV (Figure 4B). Under a fluorescent microscope, treated gametocytes were smaller, with only traces of GFP fluorescence that did not completely fade away (Figure 4C). To verify that these treated gametocytes were indeed dying or dead, we stained the cells with the mitochondrial probe JC-1. The results showed that the intensities of GFP fluorescence and JC-1 staining agreed well. Live gametocytes showed both strong green fluorescence and strong red fluorescence. In contrast, parasites showing weak green fluorescence displayed weak or no red fluorescence, indicating these parasites were dead or dying. To further quantify these changes, stage V gametocytes were subjected to increasing concentrations of PMQ treatment and the GFP and JC-1 fluorescence was quantified by FCM. For the untreated control, the gametocytes emitted strong GFP and JC-1 fluorescence. With increasing PMQ concentrations, the fluores-cence intensities for both GFP and JC-1 showed a similar trend of gradual decrease (Figure S3 in File S1). Parasites treated with
500mM of PMQ (presumably dead) showed a.11-fold reduction
in both GFP and JC-1 fluorescence. The contrasting FI of GFP in untreated and dying and dead gametocytes suggested that the remaining weak fluorescence should not have a significant influence on the drug assay.
Development of an Antimalarial Drug Assay of Gametocytes
The feasibility of the 3D7a-tubII/GFP
transgenic line for quanti-fication of gametocytes prompted us to further evaluate its potential for assaying drug sensitivity in gametocytes. We used four antimalarial drugs for this purpose: CQ, PMQ, DHA and PND; the latter three were reported to have gametocytocidal
Table 1.The concentration ranges of tested drugs.
Days in gametocyte development Drugs
Chloroquine (nM) Primaquine (mM) Dihydroartemisinin (nM) Pronaridine (nM)
21 to 0 2.44–10 000 0.03–500 0.39–400 0.61–5000
1 2.44–10 000 0.03–1000 0.49–1000 0.61–5000
2 3.05–100 000 0.07–5000 0.61–5000 0.19–50 000
3 3.05–100 000 0.07–10 000 0.61–10 000 0.19–50 000
4 3.80–500 000 0.15–20 000 0.38–200 000 0.38–100 000
5 3.80–500 000 0.15–20 000 0.38–200 000 0.38–100 000
6 3.80–1000 000 0.15–20 000 0.38–200 000 0.76–200 000
7–13 3.80–1000 000 0.15–20 000 1.9–500 000 0.76–200 000
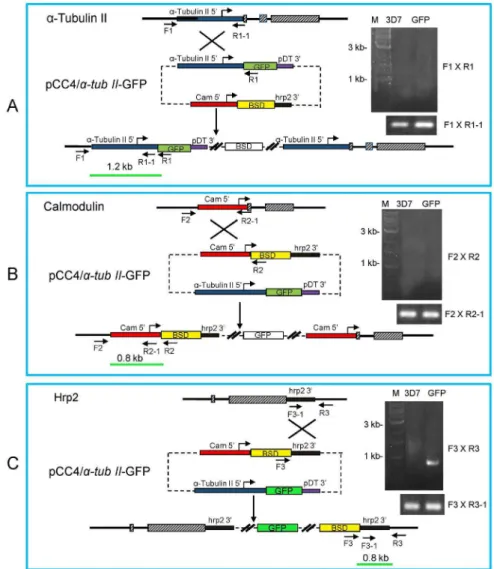
Figure 1. Generation of a GFP-expressingP. falciparumline.Schematic drawing shows the three genomic loci ata-tubulin II,calmodulin, and
hrp2 gene and the plasmid pCC4/a-tubII-GFP used for transfection, and three possible integration events. The plasmid contains the BSD drug
selection cassette and the GFP expression cassette with the GFP expression directed by thea-tubulin IIpromoter. Shown are the predicted possible
single crossover integration events into thea-tubulin II59region (A),calmodulin59region (B), andhrp239region (C). The positions and orientations
of the primers on chromosomes and the plasmid are marked. The expected sizes of PCR products are shown as the green bars. Solid lines represent introns or intergenic regions, and hatched boxes the exons. The primer pairs F16R1, F26R2, and F36R3 were used for identification of the integration events, while F16R1–1, F26R2–1 and F3–16R3 were used for genomic DNA control. PCR results of the integration event are shown on the right. PCR was done with the genomic DNA from wild type (3D7) and transfected parasites (GFP). The results indicate that the integration event occurred at thehrp2locus (C).
doi:10.1371/journal.pone.0093825.g001
Figure 2. Representative images showing GFP expression in stage I–V gametocytes in the transgenic line 3D7a-tubII/GFP.Upper panel – bright field microscopic images; lower panel, GFP fluorescence.
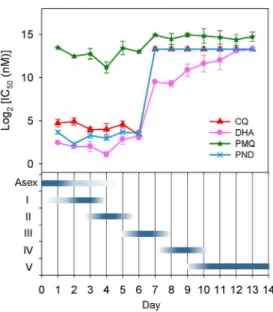
activities against mid- or late-stage gametocytes [15,33,34]. In order to assess the suitability of this transgenic line for a drug assay during the entire period of gametocytogenesis, we determined the IC50values of the four drugs in gametocytes for 13 consecutive
days from the stressed schizont stage (day -1 to 1) to stage V gametocyte (day 11 to 13). Gametocytes were treated with these drugs for 48 h, followed by measurement of FI by FCM. Gametocytes of the 3D7a-tubII/GFP
reporter line were first exposed to wide ranges of drug concentrations for estimating the IC50s,
which were then accurately measured using a narrower range of drug concentrations. As illustrated in Figure 5 and the Figure S4 in File S1, DHA, PND and CQ displayed strong inhibition activities against early gametocyte stages, with their IC50s being similar or
slightly higher than those of asexual stages assessed by the standard SYBR Green I-based fluorescence assay. However, their cytocidal activities decreased sharply against stage III–V gameto-cytes. Specifically, sensitivity in stage III and mature gametocytes to DHA decreased by more than 70 and 1000 folds, respectively. Such a stage-specific effect was even more pronounced for CQ
and PND. For PMQ, the IC50s of early stage (I and II)
gametocytes were similar to or slightly lower than the IC50 of
asexual stage parasites [18], which were,10-fold higher than the
maximum plasma concentration of PMQ in the human body [35,36]. The level of sensitivity to PMQ was only decreased by
,3-fold from stage III and remained more or less consistent
throughout the entire gametocytogenesis process.
With the verification of the transgenic line 3D7a-tubII/GFP
for drug sensitivity assay in gametocytes, we further evaluated the robustness of the assay. The Z’ factor of the assay, determined from replicates in three 96-well plates, was 0.7960.02 (values between 0.5 and 1.0 indicate an excellent assay [28], suggesting that the assay was robust and could be adapted for HTS of compounds againstP. falciparumgametocytes.
Discussion
Certain laboratory isolates ofP. falciparumcan readily produce
gametocytes in vitro, among which clone 3D7 and its parental
isolate NF54 are widely used as gametocyte-producer lines [37]. In this study, we generated a transgenic GFP-expressing parasite line in 3D7, 3D7a-tubII/GFP
, which was driven by the promoter of thea
-tubulin IIgene. This gene has been shown to be a male gametocyte-specific gene, which was found highly expressed in all gametocyte stages [30,32]. However, recent research has documented its expression in both sexes ofP. falciparum gametocytes [31], albeit the expression level was higher in male gametocytes. In the 3D7a -tubII/GFP
line, robust expression of GFP was detected in all gametocyte stages, in both males and females. We adapted this reporter system to determine the drug sensitivity of allP. falciparum
gametocyte stages.
In this assay, we used two fluorescence channels in a flow cytometer to detect GFP-positive gametocytes (FITC channel) and to rule out false-positive RBC signals (PE channel). These false positive RBCs signals normally come from autofluorescence of RBCs due to oxidative damage [38], advanced glycation end products of hemoglobin [39] and heme formation [40]. By using those two channels, the noise in our assay was almost completely removed, whereas a previous assay using a single channel for the Pfs16-GFP parasites showed high background levels of fluores-cence [18]. Since the use of double channels could effectively gate the GFP-positive-only gametocytes, the actual readout from FCM was almost equal to the gametocytemia obtained by microcopy. Furthermore, we showed that the 3D7a-tubII/GFP
parasite line provides sufficiently strong signals that could be detected by FCM from stage I to V gametocytes. A potential complication might arise if GFP protein had a long half-life and persisted in the dying and dead gametocytes, which may interfere with the drug assay [15]. Our results showed that the ratios of FI between control and PMQ-treated gametocytes were at least 7 folds, which proved
Figure 3. Establishment of the FCM method for GFP detection in gametocytes.(A) Scatter plots showing the gating signals of GFP-positive stage I–V gametocytes. Counting of gametocytes was done at relatively higher gametocytemias (%). Similar results were obtained when FCM counting of gametocytes were done at,0.02% gametocytemia (Figure S2 in File S1). (B) Uninfected RBCs (uRBC); (C) Asexual stages and (D) Gametocytes of the parental line 3D7 as negative controls. None of these controls emitted green fluorescence in the FITC channel. (E) Fluorescence intensity (FI) of gametocytes at different developmental stages.
sufficient for discriminating dead (and or dying) gametocytes from live ones. Another potential limitation of the parasite line is the differential expression of GFP in male and female gametocytes, which may confound data analysis if the drug is effective against only one sex of the gametocytes.
For validation of this drug assay, we found credible experimen-tal evidence that early stages of gametocytes displayed similar drug susceptibilities to those of asexual parasites and were quite sensitive to the antimalarial drugs DHA, PND and CQ, whereas drastic decreases in sensitivity to these drugs occurred from stage III. This result is consistent with earlier findings [19,41,42]. In contrast, PMQ is effective in all gametocyte stages, although it also showed a slight, ,3-fold decrease in gametocytocidal activity from stage
III, implying that the mechanism of PMQ in killing gametocytes might be different from those of other drugs. Thus, stage III is an important turning point of drug susceptibility during gametocy-togenesis. Coincidentally, hemoglobin digestion ceases possibly between stage III and IV gametocytes [43]. It was also observed that in late gametocyte stages there was decreased expression of genes involved in glycolysis and protein biosynthesis [44], indicating reduced metabolic activities in mature stages.
Mean-while, stage III–V female gametocytes also showed structural changes in mitochrondrion with numerous tubular cristae [42,45– 47], which is in sharp contrast to no or few cristae in both asexual parasites and early-stage gametocytes. While it is considered that the gametocytocidal activities of CQ and DHA for early gametocytes are due to their inhibition of hemoglobin digestion [13,37,48–50], and the similarity in structure between PND and CQ suggests that PND may also target the same pathway [19]. The molecular target of PMQ, however, seems unique and specific to gametocytes. Though its mode of action is still unknown, there is evidence that it might target mitochondrial function [37,51]. Therefore, a better understanding of the molecular mechanisms underlying decreased sensitivity to antimalarials during the transition to stage III gametocytes is needed to develop future gametocytocidal drugs.
There is an urgent need for the development of additional antimalarial drugs with gametocytocidal activities, especially against late stage gametocytes. Several assays based on the GFP or luciferase marker [18,19] or metabolic activities (ATP or oxidoreduction) [15,17] have been developed and could be applicable in HTS of compounds against gametocyte stages.
Figure 4. Optimization of assay parameters and characterization of gametocyte-specific GFP reporter line.(A) Comparison between microscopy and FCM for quantifying parasitemia. Gametocytes were serially diluted and each data point was determined in duplicates by microscopy and analyzed in parallel by FCM. The correspondingR2values are 0.9641 by microscopy and 0.9953 by FCM. (B) The maximum/minimum signal ratios at different gametocyte stages. Stage I–V gametocytes at 0.02% gametocytemia were seeded in 96-well plates and,half a million events were counted for each well. The box-and-whisker plot represents the ratio of fluorescence intensity (FI) for control wells to FI of these wells treated with 625mM of PMQ. (C) Assessment of GFP levels in stage V gametocytes after drug treatment by fluorescence microscopy. Gametocytes emitting strong
Our FCM-based drug assay has proved that a single transgenic parasite line may be used for assaying drug susceptibility in all gametocyte stages. This system allows for precise determination of both drug potency and kinetics of inhibition, albeit a BSD cassette in the transgenic parasite line may affect the sensitivity of compounds with similar structures. In addition, a gametocyte induction scheme with the use of heparin to eliminate asexual stages allows us to procure synchronized gametocytes at relatively high numbers [25], which are needed for adapting this assay for the HTS purpose. Furthermore, this assay, with a high Z’ factor of 0.79, is very robust, and has the potential for HTS. The capability of full automation of FCM further highlights the potential of this assay as an excellent platform for HTS. For example, to screen a
library of 1000 compounds in duplicates using a setting of 0.02% gametocytemia, 1% hematocrit and 200ml of final volume/well, it requires a total of 8 million gametocytes. A 50 ml gametocyte culture in one T75 flask would be sufficient for this even if a gametocytemia as low as 0.1% is achieved. The FCM screening
process will take ,33 hours. In addition, the time can be
significantly reduced by increasing the seeded gametocytemia and decreasing the counting events. Future optimization of the conditions is needed for adaptation of this assay for HTS studies.
Supporting Information
File S1 Supporting table and figures. Table S1, Primers
used in this study. Figure S1, Mature gametocytes of the
transgenic line 3D7a-tubII/GFP
. The graphs show strong GFP expression in both male and female gametocytes. Upper panel, GFP fluorescence. Lower panel: Bright field image showing a male gametocyte (left) with dispersed chromatin and a female gametocyte (right) with condensed chromatin.Figure S2, Scatter plots showing the gating signals and fluorescence intensity at
0.02% gametocytemia of stage I to V gametocytes.Figure S3,
Comparative quantitation of GFP and JC-1 signal intensity after treatment with PMQ. The areas under curves in the histogram show the fluorescence intensities (FI) of GFP (A) and JC-1 (B) of stage V gametocytes with or without PMQ treatment. PMQ
treatment was done at 62.5–500mM.Figure S4, Drug response
curves of stage I–V gametocytes to chloroquine (CQ), dihydroar-temisinin (DHA), primaquine (PMQ) and pyronaridine (PND). The graphs show the fluorescence intensity (FI) values of the gametocytes with the error bars representing the standard error of the FI from three biological replicates.
(PPTX)
Author Contributions
Conceived and designed the experiments: JM LC. Performed the experiments: ZW ML XYL SS XLL. Analyzed the data: ZW DP JM XC. Contributed reagents/materials/analysis tools: ZW. Wrote the paper: ZW JM LC.
References
1. Feachem RG, Phillips AA, Hwang J, Cotter C, Wielgosz B, et al. (2010) Shrinking the malaria map: progress and prospects. Lancet 376: 1566–1578. 2. Carter R, Graves PM (1988) Gametocytes. In: Wernsdorfer WH, Sir McGregor
I, editors. Malaria: Principles and Practice of Malariology. London: Churchill Livingstone. 253–305.
3. Sinden RE (2009) Malaria, sexual development and transmission: retrospect and prospect. Parasitology 136: 1427–1434.
4. Alonso PL, Brown G, Arevalo-Herrera M, Binka F, Chitnis C, et al. (2011) A research agenda to underpin malaria eradication. PLoS Med 8: e1000406. 5. Butcher GA (1997) Antimalarial drugs and the mosquito transmission of
Plasmodium. Int J Parasitol 27: 975–987.
6. Peatey CL, Skinner-Adams TS, Dixon MW, McCarthy JS, Gardiner DL, et al. (2009) Effect of antimalarial drugs on Plasmodium falciparum gametocytes. J Infect Dis 200: 1518–1521.
7. Wilairatana P, Tangpukdee N, Krudsood S (2010) Long term primaquine administration to reduce Plasmodium falciparum gametocyte transmission in hypoendemic areas. Southeast Asian J Trop Med Pub Health 41: 1306–1311. 8. Baird JK, Hoffman SL (2004) Primaquine therapy for malaria. Clin Infect Dis
39: 1336–1345.
9. Graves PM, Gelband H, Garner P (2012) Primaquine for reducing Plasmodium falciparum transmission. Cochrane Database Syst Rev 9: CD008152. 10. Baird JK (2010) Eliminating malaria–all of them. Lancet 376: 1883–1885. 11. White NJ (2008) The role of anti-malarial drugs in eliminating malaria. Malar J
7 Suppl 1: S8.
12. Chavalitshewinkoon-Petmitr P, Pongvilairat G, Auparakkitanon S, Wilairat P (2000) Gametocytocidal activity of pyronaridine and DNA topoisomerase II inhibitors against multidrug-resistant Plasmodium falciparum in vitro. Parasitol Int 48: 275–280.
13. Smalley ME (1977) Plasmodium falciparum gametocytes: The effect of chloroquine on their development. Trans R Soc Trop Med Hyg 71: 526–529.
14. Chevalley S, Coste A, Lopez A, Pipy B, Valentin A (2010) Flow cytometry for the evaluation of anti-plasmodial activity of drugs on Plasmodium falciparum gametocytes. Malaria Journal 9.
15. Tanaka TQ, Williamson KC (2011) A malaria gametocytocidal assay using oxidoreduction indicator, alamarBlue. Mol Biochem Parasitol 177: 160–163. 16. Peatey CL, Spicer TP, Hodder PS, Trenholme KR, Gardiner DL (2011) A
high-throughput assay for the identification of drugs against late-stage Plasmodium falciparum gametocytes. Mol Biochem Parasitol 180: 127–131.
17. Lelievre J, Almela MJ, Lozano S, Miguel C, Franco V, et al. (2012) Activity of clinically relevant antimalarial drugs on Plasmodium falciparum mature gametocytes in an ATP bioluminescence ‘‘transmission blocking’’ assay. PLoS One 7: e35019.
18. Buchholz K, Burke TA, Williamson KC, Wiegand RC, Wirth DF, et al. (2011) A high-throughput screen targeting malaria transmission stages opens new avenues for drug development. J Infect Dis 203: 1445–1453.
19. Adjalley SH, Johnston GL, Li T, Eastman RT, Ekland EH, et al. (2011) Quantitative assessment of Plasmodium falciparum sexual development reveals potent transmission-blocking activity by methylene blue. Proc Natl Acad Sci U S A 108: E1214–E1223.
20. Maier AG, Braks JA, Waters AP, Cowman AF (2006) Negative selection using yeast cytosine deaminase/uracil phosphoribosyl transferase in Plasmodium falciparum for targeted gene deletion by double crossover recombination. Mol Biochem Parasitol 150: 118–121.
21. Deitsch K, Driskill C, Wellems T (2001) Transformation of malaria parasites by the spontaneous uptake and expression of DNA from human erythrocytes. Nucleic Acids Res 29: 850–853.
22. Ferreira ID, do Rosario VE, Cravo PVL (2006) Real-time quantitative PCR with SYBR Green I detection for estimating copy numbers of nine drug resistance candidate genes inPlasmodium falciparum. Malar J 5: e1.
23. Trager W, Jensen JB (1976) Human malaria parasites in continuous culture. Science 193: 673–675.
24. Fivelman QL, McRobert L, Sharp S, Taylor CJ, Saeed M, et al. (2007) Improved synchronous production of Plasmodium falciparum gametocytes in vitro. Mol Biochem Parasitol 154: 119–123.
25. Miao J, Wang Z, Liu M, Parker D, Li X, et al. (2013) Plasmodium falciparum: Generation of pure gametocyte culture by heparin treatment. Exp Parasitol 135: 541–545.
26. Kariuki MM, Kiaira JK, Mulaa FK, Mwangi JK, Wasunna MK, et al. (1998) Plasmodium falciparum: Purification of the various gametocyte developmental stages from in vitro-cultivated parasites. Am J Trop Med Hyg 59: 505–508. 27. Pasini EM, van den Ierssel D, Vial HJ, Kocken CHM (2013) A novel live-dead
staining methodology to study malaria parasite viability. Malar J 12: e190. 28. Zhang JH, Chung TDY, Oldenburg KR (1999) A simple statistical parameter
for use in evaluation and validation of high throughput screening assays. J Biomol Screening 4: 67–73.
29. Team RDC (2011) R: A language and environment for statistical computing. 30. Eksi S, Suri A, Williamson KC (2008) Sex- and stage-specific reporter gene
expression in Plasmodium falciparum. Mol Biochem Parasitol 160: 148–151. 31. Schwank S, Sutherland CJ, Drakeley CJ (2010) Promiscuous Expression of
alpha-Tubulin II in Maturing Male and Female Plasmodium falciparum Gametocytes. Plos One 5.
32. Rawlings DJ, Fujioka H, Fried M, Keister DB, Aikawa M, et al. (1992) Alpha-tubulin-II is a male-specific protein in Plasmodium-falciparum. Mol Biochem Parasitol 56: 239–250.
33. Fidock DA (2010) DRUG DISCOVERY Priming the antimalarial pipeline. Nature 465: 297–298.
34. Chavalitshewinkoon-Petmitr P PG, Auparakkitanon S, Wilairat P (2000) Gametocytocidal activity of pyronaridine and DNA topoisomerase II inhibitors against multidrug-resistantPlasmodium falciparumin vitro. Parasitol Int 48: 275– 280.
35. Mihaly GW, Ward SA, Edwards G, Orme ML, Breckenridge AM (1984) Pharmacokinetics of primaquine in man: identification of the carboxylic acid derivative as a major plasma metabolite. Br J Clin Pharmacol 17: 441–446. 36. Kim YR, Kuh HJ, Kim MY, Kim YS, Chung WC, et al. (2004)
Pharmacokinetics of primaquine and carboxyprimaquine in Korean patients with vivax malaria. Arch Pharm Res 27: 576–580.
37. Baker DA (2010) Malaria gametocytogenesis. Molecular and Biochemical Parasitology 172: 57–65.
38. Khandelwal S, Saxena RK (2007) Age-dependent increase in green autofluo-rescence of blood erythrocytes. J Biosci 32: 1139–1145.
39. Vigneshwaran N, Bijukumar G, Karmakar N, Anand S, Misra A (2005) Autofluorescence characterization of advanced glycation end products of
hemoglobin. Spectrochimica Acta Part a-Mol Biomol Spectroscopy 61: 163– 170.
40. Bellemare MJ, Bohle DS, Brosseau CN, Georges E, Godbout M, et al. (2009) Autofluorescence of condensed heme aggregates in malaria pigment and its synthetic equivalent hematin anhydride (beta-Hematin). J Phys Chem B 113: 8391–8401.
41. Chutmongkonkul M, Maier WA, Seitz HM (1992) A new model for testing gametocytocidal effects of some antimalarial drugs on Plasmodium falciparum in vitro. Ann Trop Med Parasitol 86: 207–215.
42. Lang-Unnasch N, Murphy AD (1998) Metabolic changes of the malaria parasite during the transition from the human to the mosquito host. Annu Rev Microbiol 52: 561–590.
43. Hanssen E, Knoechel C, Dearnley M, Dixon MW, Le Gros M, et al. (2012) Soft X-ray microscopy analysis of cell volume and hemoglobin content in erythrocytes infected with asexual and sexual stages of Plasmodium falciparum. J Struct Biol 177: 224–232.
44. Young JA, Fivelman QL, Blair PL, de la Vega P, Le Roch KG, et al. (2005) The Plasmodium falciparum sexual development transcriptome: A microarray analysis using ontology-based pattern identification. Mol Biochem Parasitol 143: 67–79.
45. Krungkrai J, Prapunwattana P, Krungkrai SR (2000) Ultrastructure and function of mitochondria in gametocytic stage of Plasmodium falciparum. Parasite 7: 19–26.
46. Krungkrai J, Burat D, Kudan S, Krungkrai S, Prapunwattana P (1999) Mitochondrial oxygen consumption in asexual and sexual blood stages of the human malarial parasite, Plasmodium falciparum. Southeast Asian J Trop Med Public Health 30: 636–642.
47. MacRae JI, Dixon MWA, Dearnley MK, Chua HH, Chambers JM, et al. (2013) Mitochondrial metabolism of sexual and asexual blood stages of the malaria parasitePlasmodium falciparum. BMC Biology 11: e67.
48. Klonis N, Crespo-Ortiz MP, Bottova I, Abu-Bakar N, Kenny S, et al. Artemisinin activity against Plasmodium falciparum requires hemoglobin uptake and digestion. Proc Natl Acad Sci U S A 108: 11405–11410.
49. Dixon MW, Peatey CL, Gardiner DL, Trenholme KR (2009) A green fluorescent protein-based assay for determining gametocyte production in Plasmodium falciparum. Mol Biochem Parasitol 163: 123–126.
50. Czesny B, Goshu S, Cook JL, Williamson KC (2009) The Proteasome Inhibitor Epoxomicin Has Potent Plasmodium falciparum Gametocytocidal Activity. Antimicrob Agents Chemother 53: 4080–4085.