Vol. 11, No. 2, May/Aug., 2014 pp. 257-276
ISSN online: 1807-1775
DOI: 10.4301/S1807-17752014000200003
_____________________________________________________________________________________________ Manuscript first received/Recebido em: 10/10/2013 Manuscript accepted/Aprovado em: 16/03/2014. We thank Fapergs and Fundação Carolina.
Address for correspondence / Endereço para correspondência
Angel Cobo, Doctor’s Degree in Applied Mathematics, University of Cantabria. Avda. Los Castros s/n 39005 Santander (Spain). Email: [email protected]
Adolfo Alberto Vanti, Doctor’s Degree in Business Administration. Universidade do Vale do Rio dos Sinos. Escola de Gestão de Negócios. Av. UNISINOS, 950, Cristo Rei, 93022000 - São Leopoldo, RS - Brasil,: Email: [email protected]
Rocío Rocha, Doctor’s Degree in Business Administration, University of Cantabria. Avda. Los Castros s/n 39005 Santander (Spain). Email: [email protected]
A FUZZY MULTICRITERIA APPROACH FOR IT GOVERNANCE
EVALUATION
Angel Cobo
University of Cantabria, Santander, Spain Adolfo Alberto Vanti
Universidade do Vale do Rio dos Sinos, Brasil Rocío Rocha
University of Cantabria, Santander, Spain
_____________________________________________________________________
ABSTRACT
This work seeks to provide a new multi-criteria approach to assess IT Governance (ITG) in the area of Strategic Alignment. The complete methodological development process is described. The evaluation model uses Fuzzy Analytic Hierarchy Process (FAHP) and it is targeted to IT processes, more specifically to the COBIT© IT maturity levels, domains and processes, thus providing a differentiated analysis of importance for each item. Its relevance is related to addressing isolated and individual evaluation criteria that are normally practiced in audits of processes. The model allows generating information that extends the guarantees of compliance and corporate governance from different organizations. This research demonstrates that the combined use of multi-criteria decision methodologies and soft computing proves to be particularly suitable for Strategic Alignment such as the focal area of COBIT. The model was applied in a big retail Brazilian company.
Keywords: Corporate Governance, IT Governance, Strategic Alignment, COBIT,
1. INTRODUCTION
The multidisciplinary process of Corporate Governance (CG) and of IT Governance (ITG) (Weill & Ross, 2004; Van Grembergen & Haes, 2004) reduce agency conflicts in aspects such as informational asymmetry and help to reach fundamental principles related to disclosure, compliance, fairness, accountability and transparency (Jensen & Meckling, 1976). These principles are supported by good governance codes aligned with the Information Systems that support business processes, as the codes established by the Cadbury Report (1992), OECD (2011) and IBGC (2012).
Information Systems (IS) develop operational and managerial activities in internal control, increasing the guarantee of CG mainly related to the measurement requirement of confidentiality, integrity, availability and compliance. These aspects are present in different evaluation frameworks related to information security processes (Kwok & Longley, 1999; Taylor & Fitzgerald, 2007) and COBIT (ITGI, 2013). This paper focuses specifically on the analysis of the strategic alignment focal area, using the COBIT framework and seeking to reduce the problems between business and IT.
The lack of a strategic alignment between IT and business causes competitiveness losses as established by (Hirschheim & Sabherwal, 2001; Weiss & Thorogood, 2011) and also a limited improvement in strategic information systems (SIS) planning (Lederer & Sethi, 1992) that supports the achievement of the organizational objectives (Zviran, 1990), as well as the impacts and performance of the organization (Lederer & Mendelow, 1989; Chen, 2010; Li & Tan, 2013; Tiwana & Konsynski, 2010). These studies emphasize that alignment and IT Governance (ITG) must be studied together, because they are strongly related and complementary concepts. ITG guides the use of IT in the company in strategic control and adds value to business, improving decision-making processes (Van Grembergen & De Haes, 2010; Zarvi´c, Stolze, & Thomas, 2012).
In this direction of alignment between business and IT through the ITG, we propose a COBIT based model for assessing IT processes, integrating business and fuzzy aspects that will reduce the limitation detailed above.
In Marnewick & Labuschagne (2011) it became obvious that CG fails in the decision of IT projects in organizations. The study considered ITG models such as COBIT, ISO 35000, PRICE2 and PMBoK©. In the case of IT Governance using the COBIT, the companies in the study stated that they did not meet the requirements, postponing goals.
In this context, this paper aims to contribute to the improvement of ITG by applying a methodology for fuzzy multi-criteria evaluation, namely FAHP (Chang, 1996), and focuses on assessing the level of strategic alignment according to the COBIT 4.1 framework. This FAHP application expands the traditional IT audit process in which the valuation is produced using maturity levels in a pre-established scale (0 to 5 coming from CMMI©). The inclusion of FAHP methodology in the proposed model provides greater robustness in qualitative and subjective aspects or even fuzzy or unclear results in the pair to pair evaluation of the audited processes.
2. A FRAMEWORK FOR IT GOVERNANCE: COBIT
COBIT (Control Objectives for Information and related Technology) is a framework created by the ISACA (Information Systems Audit and Control Association) for information technology management and IT Governance itself (ISACA, 2012), it includes an ontological metamodel of IT Governance framework (Neto & Neto, 2013). The ISACA published the current version, COBIT 5, in 2012. In (De Haes et al, 2013) research questions for future research on enterprise governance of IT and COBIT 5 are proposed and discussed. COBIT 5 reveals new conceptual ideas compared to the previous COBIT 4.1 version (Preittigun et al, 2012), however, in this work COBIT 4.1 was used. This version of COBIT defines a process model that subdivides IT into four domains and 34 processes. It provides best practices across a domain and process-based framework and presents activities in a manageable and logical structure. The business orientation of COBIT consists of linking business goals to IT goals, providing metrics and maturity models to measure their achievement, and identifying the associated responsibilities of business and IT process owners.
COBIT focuses strongly more on control and less on execution, and is contextualized in Information Technology Governance (ITG). According to Simonson, Johnson and Ekstedt (2010), it is defined as a technology managed and structured in an organization, providing mechanisms that also contribute to the strategic and IT planning of the organization.
COBIT supports IT governance by providing a framework to ensure that IT is aligned with the business, IT resources used responsibly, and IT risks managed appropriately. Finally, performance measurement is an essential aspect for IT governance. In short, IT governance (ITG) is structured around 5 major focus areas that are defined by COBIT. These areas describe the topics that executive managers need to address in order to govern IT within their organizations. According to COBIT’s executive overview (ITGI, 2013), the five focus areas are: Strategic alignment, focused on ensuring the linkage of business and IT plans; Value delivery, about executing the value proposition; Resource management, engaged in optimal investment; Risk management, focused on risk awareness; and, finally, Performance measurement,
tracks and monitors strategy implementation.
confidentiality, availability and integrity in four domains and their interrelations. These domains are briefly described below.
Plan and Organize (PO) includes strategies and tactics with the intention of identifying the best way on how IT can contribute to the achievement of the business objectives. Acquire and Implement (AI) is a domain that analyzes the IT solutions that need to be identified, developed or acquired, implemented and integrated into the business process. Deliver and Support (DS) refers to the delivery of the services requested, which includes service delivery, safety and continuity of management, support services for users and data management and operational resources. Finally,
Monitor and Evaluate (ME) domain establishes the regular assessment processes to ensure adherence to quality and control requirements. This domain addresses performance management, monitoring of internal control, regulatory compliance and governance.
Each domain has a different number of processes involved; in fact, PO has 10 processes; AI has 7; DS has 13; and ME has 4. The complete list of 34 processes is included in the annex. It is important to note that this division into domains and processes allows to infer a hierarchy of criteria that can be used later in the AHP (Analytic Hierarchical Process) methodology applied to this work. In short, the hierarchy that will be used is shown in Figure 1.
IT Governance Focus Area PO Plan and Organize AI Acquire and Implement DS Deliver and Support ME Monitor and Evaluate PO1 PO2 PO3 PO4 PO5 PO6 PO7 PO8 PO9 PO10 AI1 AI2 AI3 AI4 AI5 AI6 AI7 DS1 DS2 DS3 DS4 DS5 DS6 DS7 DS8 DS9 DS10 DS11 DS12 DS13 ME1 ME2 ME3 ME4
COBIT 4.1 also includes an assessment framework of processes that defines maturity levels for each process. The model is based on the Capability Maturity Model Integration (CMMI©). This assessment framework defines a 0-5 scale with an alphanumeric description of each numeric value as it is briefly shown in Table 1. This scale allows an assessment of the degree of development of each process in an organization and the evaluation model provides guidelines for assigning maturity levels.
Value Name Description
0 None There is no recognition of the need for internal control. 1 Initial There is some recognition of the need for internal control. 2 Repeatable Controls are in place but are not documented.
3 Defined Controls are in place and are adequately documented. However, the evaluation process is not documented and employees are aware of their responsibilities for control.
4 Managed
and
measurable
There is an effective internal control and a risk management environment with a formal and documented evaluation of controls, which occurs frequently. A limited, tactical use of technology is applied to automate controls.
5 Optimized Control evaluation is continuous, based on self-assessments and gap and root cause analyses. Employees are proactively involved in control improvements.
Table 1. Maturity levels (ITGI, 2013).
3. METHODOLOGY
Our aim is to construct a model that allows the assessment of IT governance in
an organization based on the maturity levels of COBIT’s processes. To achieve this
objective we have used a fuzzy multi-criteria decision methodology: FAHP.
The proposed approach is a fuzzy extension of the classical Analytic Hierarchy Process (AHP) multi-criteria technique. This technique is especially useful for obtaining a single assessment value based on different previously selected indicators or criteria (levels of maturity of processes). Furthermore, it also allows us to incorporate subjective appreciations or opinions from the IT manager on the processes that may prove more significant when it comes to measuring this assessment of IT governance. In the AHP, each element in the hierarchy of criteria is considered to be independent of all the others. When there is interdependence among criteria, and extension of AHP known as Analytic Network Process (ANP) would be used.
3.1. Fuzzy numbers
(Zadeh, 1965) introduced the theory of fuzzy sets in 1965 to model the concept of vagueness, characteristic of human thought. Fuzzy numbers allow to face problems in which the criteria are not precisely defined. In fuzzy logic, a statement can not only be true or false, as in classical logic, but also, and moreover, it provides a range of intermediate values between absolute certainty and absolute falsehood. In this context, a fuzzy set is determined by a membership function which determines the degree of certainty with which an element x belongs to the set.
A triangular fuzzy number is a special type of fuzzy number whose membership is defined by three real numbers, expressed as (l, m, u), where l is the lower limit, m the most promising and u the upper limit value. The membership function of M=(l,m,u) is given by: u x or l x if u x m if m u x u m x l if l m l x x 0 ) (
The graphical representation of this function can be seen in Figure 2.
µ(x) 1
0 l m u x
Figure 2. Membership function defining the triangular fuzzy number M=(a,b,c).
The assumption of triangular fuzzy numbers is a simplification, which can be frequently found in the literature and which facilitates fuzzy arithmetic calculations
(Meixner, 2009). It is possible to use the operation laws following Zadeh’s extension
principle via this simplification which makes calculations much easier. Given the triangular fuzzy numbers A=(a1,a2,a3) and B=(b1,b2,b3), the basic arithmetic operations
are defined as follows:
A+B = (a1+b1, a2+b2, a3+b3) A*B = (a1b1, a2b2, a3b3) nA = (na1,na2,na3) for all n>0
3.2. Fuzzy Analytic Hierarchy Process (FAHP)
Analytic Hierarchy Process (AHP) is a multi-criteria decision technique proposed by Saaty (1980) to solve problems of planning needs and management of scarce resources that, in time, has become one of the most widely used techniques in decision making processes on multiple criteria (Chang, 1992). In general, this technique can be applied to problem solving that requires an evaluation and measuring in which different and very often opposed criteria intervene. The main advantages of AHP are the relative ease with which it handles multiple criteria, as well as the fact that it is easy to understand and can effectively handle both qualitative and quantitative data (Markaki, Charilas, & Askounis, 2010).
The AHP technique is developed through six key stages:
• Definition of the problem and establish clear objectives and expected results.
• Deconstruction of a complex problem in a hierarchical structure with elements of decision. At a high level of hierarchy, general objectives and criteria are divided into particular objectives or subcriteria for reaching the lowest level in which the alternatives are located.
• Carrying out of pair comparisons between decision elements, forming comparison matrices based on the establishment of the relative importance between the factors of each hierarchical level.
• Checking of the consistency properties of the matrices in order to guarantee that the judgments issued by the decision makers are coherent and consistent.
• Estimation based on previous matrices of the relative weights of the decision elements for achieving the general objective.
• Making of an evaluation of the alternatives based on the weights of the decision elements.
The relative importance of the decision elements in AHP is assessed indirectly through a series of pairwise comparisons, in which the decider provides preferences by comparing all criteria and subcriteria with respect to upper level decision elements. AHP uses a 1-9 numeric scale in order to establish priority values aij for each pair of
criteria. If the element Ei is preferred to Ej then aij>1. At each level of the criteria
hierarchy we obtain an n-dimensional squared matrix, where n is the number of elements or criteria of the level. The reciprocal property aij=1/aji and aii=1 and aij >0
Among the advantages of the AHP method, we can cite the facility for incorporating multiple criteria, the possibility of using linguistic variables, as well as the need to carry out an exhaustive analysis of the definition of the values of comparison, which leads to a greater understanding of the problem tackled. However, for complex problems or those with many options, excessive computational effort may be required and a high level of pairwise comparisons. In spite of its popularity, the AHP method is often criticized for its inability to adequately handle the inherent uncertainty and imprecision associated with the mapping of a decision-maker’s perception to crisp numbers. A natural way to cope with uncertainty in judgments is to express the comparison ratios as fuzzy sets or fuzzy numbers, which incorporate the vagueness of the human thinking. Therefore, fuzzy AHP (FAHP), a fuzzy extension of AHP, can be used to solve hierarchical fuzzy problems (Van Laarhoven & Pedrycz, 1983; Mikhailov & Tsvetinov, 2004). FAHP applications can be found in diverse areas such as selection of operating systems (Balli & Korukoglu, 2009), recruitment of staff, (Chen, 2009), risk assessment projects in information technology (Iranmanesh et al, 2008), selection of ERP systems (Lien and Chan, 2007).
Using the concept of triangular fuzzy numbers, one can obtain a "fuzzy" or diffuse version of the classical AHP. When comparing two elements Ei and Ej, the
exact value ratio aij can be approximated with a fuzzy ratio which is represented by a
fuzzy triangular number. The construction of a hierarchical model in FAHP is exactly equal to the original AHP.
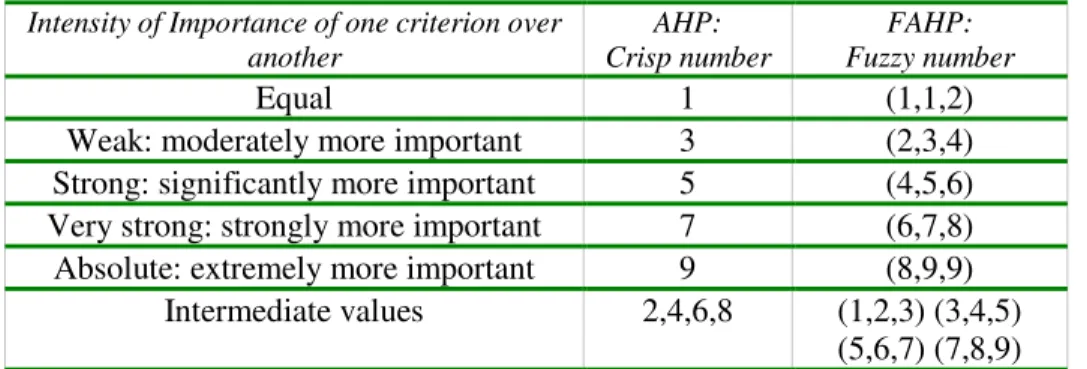
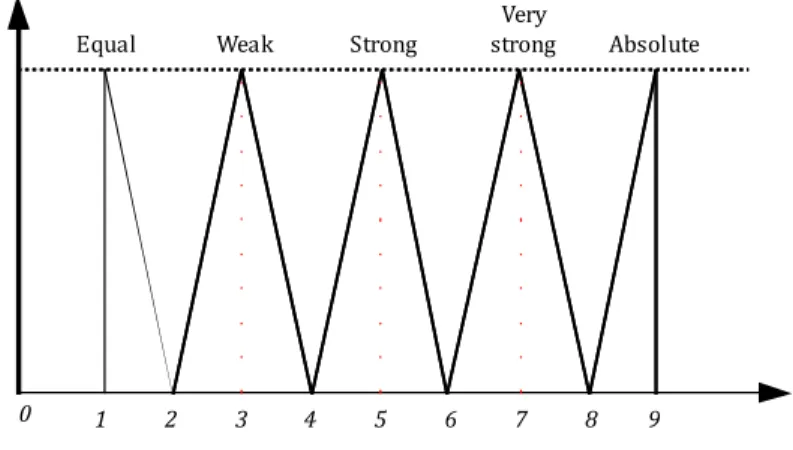
The fuzzy numbers required to form the decision matrix may be determined directly according to the decision maker or may derive from linguistic variables in a verbal scale, which can be then converted into fuzzy numbers using a suitable conversion as shown in Table 2 and Figure 3. In order to construct a positive reciprocal matrix of pairwise comparisons, a full set of n(n-1)/2 comparison judgments are required. The pairwise comparison matrix is constructed as
where ; and
Intensity of Importance of one criterion over another
AHP: Crisp number
FAHP: Fuzzy number
Equal 1 (1,1,2)
Weak: moderately more important 3 (2,3,4)
Strong: significantly more important 5 (4,5,6)
Very strong: strongly more important 7 (6,7,8)
Absolute: extremely more important 9 (8,9,9)
Intermediate values 2,4,6,8 (1,2,3) (3,4,5)
(5,6,7) (7,8,9)
1
0 1 2 3 4 5 6 7 8 9
Equal Weak Strong
Very
strong Absolute
Figure 3. Fuzzy pairwise comparison scale.
The final weights of the decision elements can be calculated using different methods that have been proposed in the literature. One of the most popular methods is
the Fuzzy Extent Analysis, proposed by Chang (1996). The steps of Chang’s extent
analysis can be summarized as follows:
First step: computing the normalized value of row sums by fuzzy arithmetic operations:
Second step: computing the degree of possibility of defined as
x and y being the values on the axis of the membership function of each criterion. This expression is equivalently expressed as
where . Using these expressions the degree of possibility of to be greater than all the convex fuzzy numbers is computed as follows:
Observe that the final normalization weight vector W is a real non-fuzzy vector that can be used to perform an evaluation of the alternatives based on the weights of the decision elements in each hierarchy level. The local priorities represent the relative weights of criteria within a group with respect to their parent in the hierarchy. The global priorities are obtained by multiplying the local priorities of the siblings by their
parent’s local priorities.
4. A FAHP MODEL BASED ON COBIT FOR IT GOVERNANCE EVALUATION
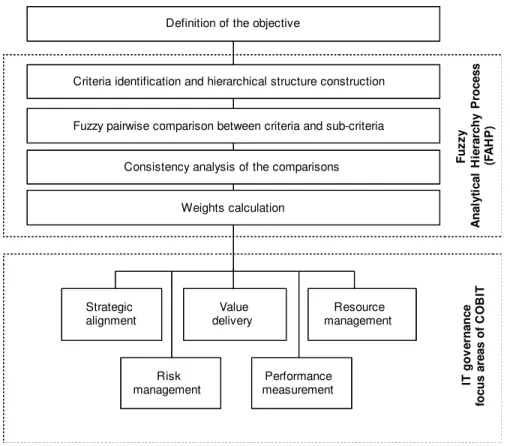
With the aim of constructing a model that allows us to measure the governance of TI according to the focus areas defined by COBIT 4.1 and taking as reference the basic stages of the methodology described before, we proceeded to carry out the actions illustrated in Figure 4. Each of the stages will be explained in detail below.
Definition of the objective
Criteria identification and hierarchical structure construction
Fuzzy pairwise comparison between criteria and sub-criteria
Weights calculation Fu z z y A na ly ti c a l H ie ra rc hy P roc e s s (F A H P ) IT go v e rna nc e foc us a re a s of C O B IT
Consistency analysis of the comparisons
Strategic alignment Value delivery Resource management Risk management Performance measurement
Figure 4. Stages for the construction of a model for evaluating IT governance.
4.1. Definition of objectives
model, we sought its practical application in a Brazilian firm that operates in Rio Grande do Sul State.
4.2. Identification of criteria hierarchy
In order to achieve the proposed objectives, we decided to select the 34 processes defined by COBIT 4.1. These processes are hierarchically organized as shown in Figure 1. In the first level of the criteria hierarchy we consider the four main domains Di (i=1,2,3,4). Specifically, D1 corresponds to “Plan and Organize”, D2 is
“Acquire and Implement”, D3 is “Deliver and Support” and D4 is “Monitor and
Evaluate”.
COBIT 4.1 also defines a set of processes associated with each main domain; we will use the following notation to refer to the processes involved in Di: Pi,j with i in {1,2,3,4} and j in {1,2,…,ni}, where i indicates the associated domain and j the number
of process in the domain. Each domain has a different number of processes involved, in fact n1=10, n2=7, n3=13, and n4=4. The complete list of 34 processes is shown in the
Annex. The processes define the second level in the criteria hierarchy.
4.3. Pairwise comparison between criteria
COBIT 4.1 defines significance levels for each process, and priority levels associated with each process and focus area. With this information, we proceed to the construction of pairwise comparisons matrices between areas and between the processes associated with the same domain. The building process is described as follows.
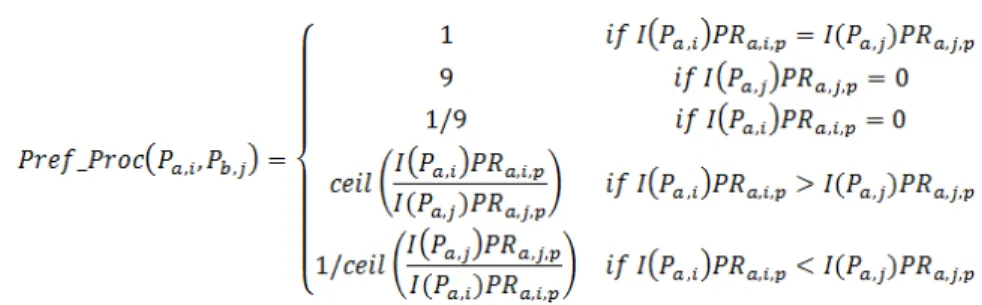
In accordance with the significance level defined by COBIT for each process, we define the following function:
These importance levels are defined in the mapping of IT processes for IT governance focus areas (Appendix II of COBIT 4.1)
COBIT also associates a primary or secondary priority for each process in each focus area. According to this information we define:
Firstly, we proceed to define the fuzzy pairwise comparisons between domains with respect to a particular focus area. For Da and Db domains, we need to compare
triangular numbers to different levels of preference with respect to the focus area selected (FAp).
In order to define the importance levels the following process we compute:
and
where ceil() is the function that maps a real number to the smallest following integer. After this process the fuzzification comprises the process of transforming the crisp value into a triangular fuzzy number using the correspondence defined in Table 2.
In this work we focus on the evaluation of strategic alignment. According to the previous expressions the fuzzy pairwise comparison matrix for this focus area is shown in Table 3.
D1 D2 D3 D4
D1 (1,1,2) (3,4,5) (4,5,6) (2,3,4) D2 (1/5,1/4,1/3) (1,1,2) (1,2,3) (1/3,1/2,1) D3 (1/6,1/5,1/4) (1/3,1/2,1) (1,1,2) (1/3,1/2,1) D4 (1/4,1/3,1/2) (1,2,3) (1,2,3) (1,1,2)
Table 3. Pairwise domains comparison matrix in “Strategic Alignment” focus area.
These numbers maintain the fuzzyfication from the priority of each process in each focus area of COBIT and the importance levels, defined in the same technological process evaluation framework.
Once the comparisons at the first hierarchical level were made, the same process was made comparing the different criteria that stem from the general criteria in the hierarchy. For Da a domain, we need to compare the processes associated to Da using
the fuzzy scale. In this case we proceed as follows:
For Pa,i and Pa,j processes in the domain Da, we define
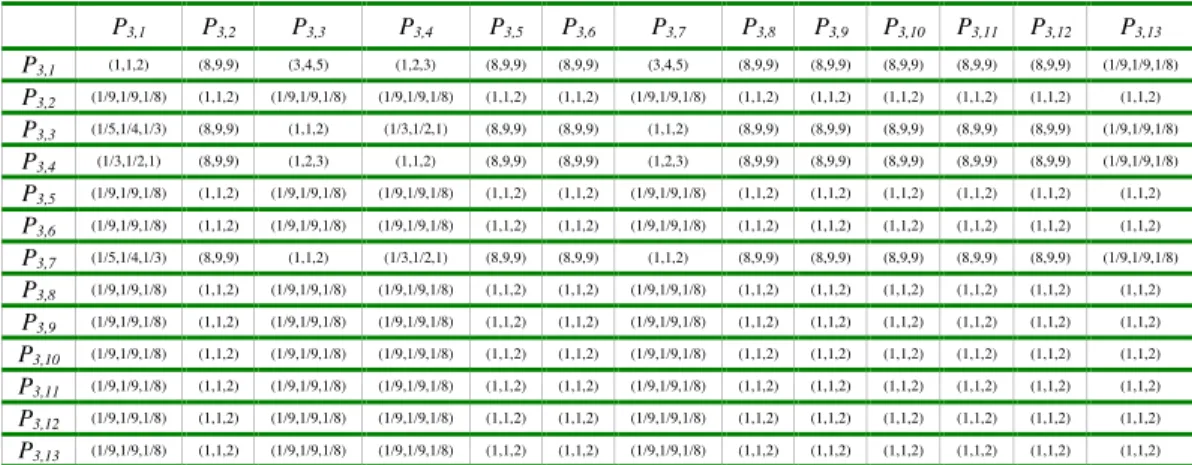
This expression allows constructing the pairwise comparisons matrices for the specific domains. The Tables 4, 5, 6 and 7 show the matrices associated to the 4 domains in the strategic alignment focus area.
P1,1 P1,2 P1,3 P1,4 P1,5 P1,6 P1,7 P1,8 P1,9 P1,10
P1,1 (1,1,2) (2,3,4) (2,3,4) (5,6,7) (2,3,4) (1,2,3) (2,3,4) (1,2,3) (1,1,2) (1,1,2)
P1,2 (1/4,1/3,1/2) (1,1,2) (1,1,2) (1,2,3) (1,1,2) (1/3,1/2,1) (1,1,2) (1/3,1/2,1) (1/4,1/3,1/2) (1/4,1/3,1/2)
P1,3 (1/4,1/3,1/2) (1,1,2) (1,1,2) (1,2,3) (1,1,2) (1/3,1/2,1) (1,1,2) (1/3,1/2,1) (1/4,1/3,1/2) (1/4,1/3,1/2)
P1,4 (1/7,1/6,1/5) (1/3,1/2,1) (1/3,1/2,1) (1,1,2) (1/3,1/2,1) (1/5,1/4,1/3) (1/3,1/2,1) (1/5,1/4,1/3) (1/7,1/6,1/5) (1/7,1/6,1/5)
P1,5 (1/4,1/3,1/2) (1,1,2) (1,1,2) (1,2,3) (1,1,2) (1/3,1/2,1) (1,1,2) (1/3,1/2,1) (1/4,1/3,1/2) (1/4,1/3,1/2)
P1,6 (1/3,1/2,1) (1,2,3) (1,2,3) (3,4,5) (1,2,3) (1,1,2) (1,2,3) (1,1,2) (1/3,1/2,1) (1/3,1/2,1)
P1,7 (1/4,1/3,1/2) (1,1,2) (1,1,2) (1,2,3) (1,1,2) (1/3,1/2,1) (1,1,2) (1/3,1/2,1) (1/4,1/3,1/2) (1/4,1/3,1/2)
P1,8 (1/3,1/2,1) (1,2,3) (1,2,3) (3,4,5) (1,2,3) (1,1,2) (1,2,3) (1,1,2) (1/3,1/2,1) (1/3,1/2,1)
P1,9 (1,1,2) (2,3,4) (2,3,4) (5,6,7) (2,3,4) (1,2,3) (2,3,4) (1,2,3) (1,1,2) (1,1,2)
P1,10 (1,1,2) (2,3,4) (2,3,4) (5,6,7) (2,3,4) (1,2,3) (2,3,4) (1,2,3) (1,1,2) (1,1,2) Table 4. Pairwise processes comparison matrix in domain D1.
P2,1 P2,2 P2,3 P2,4 P2,5 P2,6 P2,7
P2,1 (1,1,2) (1,1,2) (8,9,9) (3,4,5) (8,9,9) (8,9,9) (1,2,3)
P2,2 (1,1,2) (1,1,2) (8,9,9) (3,4,5) (8,9,9) (8,9,9) (1,2,3)
P2,3 (1/9,1/9,1/8) (1/9,1/9,1/8) (1,1,2) (1/9,1/9,1/8) (1,1,2) (1,1,2) (1/9,1/9,1/8)
P2,4 (1/5,1/4,1/3) (1/5,1/4,1/3) (8,9,9) (1,1,2) (8,9,9) (8,9,9) (1/3,1/2,1)
P2,5 (1/9,1/9,1/8) (1/9,1/9,1/8) (1,1,2) (1/9,1/9,1/8) (1,1,2) (1,1,2) (1/9,1/9,1/8)
P2,6 (1/9,1/9,1/8) (1/9,1/9,1/8) (1,1,2) (1/9,1/9,1/8) (1,1,2) (1,1,2) (1/9,1/9,1/8)
P2,7 (1/3,1/2,1) (1/3,1/2,1) (8,9,9) (1,2,3) (8,9,9) (8,9,9) (1,1,2) Table 5. Pairwise processes comparison matrix in domain D2.
P3,1 P3,2 P3,3 P3,4 P3,5 P3,6 P3,7 P3,8 P3,9 P3,10 P3,11 P3,12 P3,13
P3,1 (1,1,2) (8,9,9) (3,4,5) (1,2,3) (8,9,9) (8,9,9) (3,4,5) (8,9,9) (8,9,9) (8,9,9) (8,9,9) (8,9,9) (1/9,1/9,1/8)
P3,2 (1/9,1/9,1/8) (1,1,2) (1/9,1/9,1/8) (1/9,1/9,1/8) (1,1,2) (1,1,2) (1/9,1/9,1/8) (1,1,2) (1,1,2) (1,1,2) (1,1,2) (1,1,2) (1,1,2)
P3,3 (1/5,1/4,1/3) (8,9,9) (1,1,2) (1/3,1/2,1) (8,9,9) (8,9,9) (1,1,2) (8,9,9) (8,9,9) (8,9,9) (8,9,9) (8,9,9) (1/9,1/9,1/8)
P3,4 (1/3,1/2,1) (8,9,9) (1,2,3) (1,1,2) (8,9,9) (8,9,9) (1,2,3) (8,9,9) (8,9,9) (8,9,9) (8,9,9) (8,9,9) (1/9,1/9,1/8)
P3,5 (1/9,1/9,1/8) (1,1,2) (1/9,1/9,1/8) (1/9,1/9,1/8) (1,1,2) (1,1,2) (1/9,1/9,1/8) (1,1,2) (1,1,2) (1,1,2) (1,1,2) (1,1,2) (1,1,2)
P3,6 (1/9,1/9,1/8) (1,1,2) (1/9,1/9,1/8) (1/9,1/9,1/8) (1,1,2) (1,1,2) (1/9,1/9,1/8) (1,1,2) (1,1,2) (1,1,2) (1,1,2) (1,1,2) (1,1,2)
P3,7 (1/5,1/4,1/3) (8,9,9) (1,1,2) (1/3,1/2,1) (8,9,9) (8,9,9) (1,1,2) (8,9,9) (8,9,9) (8,9,9) (8,9,9) (8,9,9) (1/9,1/9,1/8)
P3,8 (1/9,1/9,1/8) (1,1,2) (1/9,1/9,1/8) (1/9,1/9,1/8) (1,1,2) (1,1,2) (1/9,1/9,1/8) (1,1,2) (1,1,2) (1,1,2) (1,1,2) (1,1,2) (1,1,2)
P3,9 (1/9,1/9,1/8) (1,1,2) (1/9,1/9,1/8) (1/9,1/9,1/8) (1,1,2) (1,1,2) (1/9,1/9,1/8) (1,1,2) (1,1,2) (1,1,2) (1,1,2) (1,1,2) (1,1,2)
P3,10 (1/9,1/9,1/8) (1,1,2) (1/9,1/9,1/8) (1/9,1/9,1/8) (1,1,2) (1,1,2) (1/9,1/9,1/8) (1,1,2) (1,1,2) (1,1,2) (1,1,2) (1,1,2) (1,1,2) P3,11 (1/9,1/9,1/8) (1,1,2) (1/9,1/9,1/8) (1/9,1/9,1/8) (1,1,2) (1,1,2) (1/9,1/9,1/8) (1,1,2) (1,1,2) (1,1,2) (1,1,2) (1,1,2) (1,1,2)
P3,12 (1/9,1/9,1/8) (1,1,2) (1/9,1/9,1/8) (1/9,1/9,1/8) (1,1,2) (1,1,2) (1/9,1/9,1/8) (1,1,2) (1,1,2) (1,1,2) (1,1,2) (1,1,2) (1,1,2)
P3,13 (1/9,1/9,1/8) (1,1,2) (1/9,1/9,1/8) (1/9,1/9,1/8) (1,1,2) (1,1,2) (1/9,1/9,1/8) (1,1,2) (1,1,2) (1,1,2) (1,1,2) (1,1,2) (1,1,2) Table 6. Pairwise processes comparison matrix in domain D3.
P4,1 P4,2 P4,3 P4,4
P4,1 (1,1,2) (8,9,9) (1/3,1/2,1) (1/3,1/2,1)
P4,2 (1/9,1/9,1/8) (1,1,2) (1/9,1/9,1/8) (1/9,1/9,1/8)
P4,3 (1,2,3) (8,9,9) (1,1,2) (1,1,2)
P4,4 (1,2,3) (8,9,9) (1,1,2) (1,1,2)
4.4. Consistency analysis of comparison judgments
Seeking to contrast the consistency of comparative judgments between the criteria made by COBIT, the AHP model proposes the calculation of a ratio of consistency. In this sense Saaty (1980) recommends a radius of consistency of 0.1 or lower so that pairwise comparisons undertaken by the decision maker can be considered as acceptable. In the case proposed, we used the crisp numbers associated to the fuzzy triangular comparison values to obtain the radius of consistency of the crisp pairwise matrices; the values obtained were as follows:
• For first level comparisons we obtained a radius of consistency of 0.02.
• For second level comparisons we obtained radii of consistency of 0.00, 0.04, 0.02, and 0.02 respectively.
All ratios of consistency were, therefore, perfectly admissible.
4.5. Calculation of the relative weights of each criterion
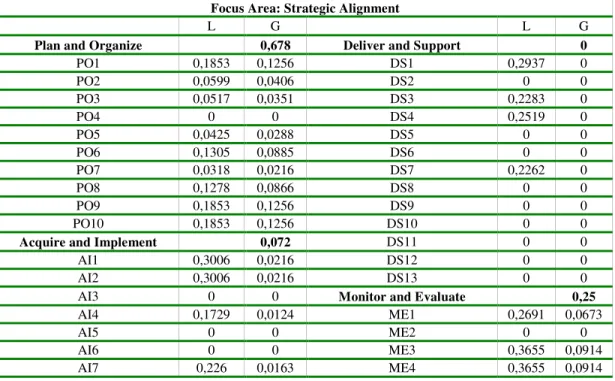
Once the pairwise comparison has been performed, the FAHP methodology allows us to calculate weights for each criterion which will influence their importance in achieving the final goal. We applied the methodology proposed by Chang (1996) in order to calculate these weights in Local (L) and Global (G), considering the strategic alignment focus area. The computation of these weights was performed using an ad hoc implemented application in Java programming language. Table 8 shows the final values obtained for the weights in the two levels of the hierarchy.
Focus Area: Strategic Alignment
L G L G
Plan and Organize 0,678 Deliver and Support 0
PO1 0,1853 0,1256 DS1 0,2937 0
PO2 0,0599 0,0406 DS2 0 0
PO3 0,0517 0,0351 DS3 0,2283 0
PO4 0 0 DS4 0,2519 0
PO5 0,0425 0,0288 DS5 0 0
PO6 0,1305 0,0885 DS6 0 0
PO7 0,0318 0,0216 DS7 0,2262 0
PO8 0,1278 0,0866 DS8 0 0
PO9 0,1853 0,1256 DS9 0 0
PO10 0,1853 0,1256 DS10 0 0
Acquire and Implement 0,072 DS11 0 0
AI1 0,3006 0,0216 DS12 0 0
AI2 0,3006 0,0216 DS13 0 0
AI3 0 0 Monitor and Evaluate 0,25
AI4 0,1729 0,0124 ME1 0,2691 0,0673
AI5 0 0 ME2 0 0
AI6 0 0 ME3 0,3655 0,0914
AI7 0,226 0,0163 ME4 0,3655 0,0914
Table 8 prioritizes specifically strategic alignment COBIT focal area, proposed in this paper. In future works it will be applied in other focal areas as Value Delivery, Risk Management, Resource Management and Performance Measurement, using the same methodological procedure. As can be observed the model identifies only 16 key processes in making an assessment of the focal area strategic alignment. Specifically, these processes are those with non-null global weights in Table 8. As can be observed, some processes in domains closely related with strategic alignment have null weights assigned by the model. For instance, despite of PO4 is of secondary influence like other
process in domain “Plan and Organize”, as PO3, in the mapping of IT processes to IT
governance focus areas, COBIT 4.1 declares PO4 with a low importance and the weighting scheme assigns to it a null weight.
In order to measure the maturity levels of the different processes defined by COBIT, it is possible to request independent evaluations by an expert group and to collect multiple crisp data sets reflecting different opinions and then form the fuzzy maturity level (FML) of a process as the triangular fuzzy number (min,mean,max) deriving from the specific data sets.
To evaluate the applicability of the proposed model, we performed an assessment from the point of view of IT governance in a Brazilian company that operates in three states of Rio Grande do Sul. Individual interviews were conducted with the IT manager and supervisor, asking each of them independently conduct an assessment on the scale 0-5 the degree of maturity of each of the processes of COBIT 4.1. With the responses generated the FML values shown in Table 9 were obtained. As shown in this preliminary assessment most processes are in repeatable and defined states, especially those who have more weight in measuring the level of strategic alignment of IT in the organization according to the FAHP model developed. None of the processes can be considered optimized.
Process FML Process FML Process FML Process FML
PO1 (3; 3,5; 4) AI1 (3; 3,5; 4) DS1 (3; 4; 5) ME1 (3; 3,5; 4)
PO2 (2; 2; 2) AI2 (3; 3,5; 4) DS2 (3; 3,5; 4) ME2 (2; 2,5; 3)
PO3 (2; 2; 2) AI3 (2; 2,5; 3) DS3 (2; 3; 4) ME3 (1; 1,5; 2)
PO4 (2; 2,5; 3) AI4 (2; 2,5; 3) DS4 (2; 3; 4) ME4 (2; 2,5; 3)
PO5 (1; 2; 3) AI5 (1; 2,5; 4) DS5 (2; 2,5; 3)
PO6 (3; 3; 3) AI6 (4; 4; 4) DS6 (3; 3,5; 4)
PO7 (1; 1; 1) AI7 (4; 4; 4) DS7 (1; 1; 1)
PO8 (2; 2; 2) DS8 (3; 4; 5)
PO9 (2; 2,5; 3) DS9 (2; 2,5; 3)
PO10 (3; 3,5; 4) DS10 (2; 3; 4)
DS11 (2; 2,5; 3)
DS12 (3; 3; 3)
DS13 (4; 4; 4)
Table 9. Fuzzy maturity levels (FML).
of the levels of maturity of each of the 16 processes with non-null weight. In the studied case the global evaluation of the “strategic alignment” focus area is (2,341; 2,711; 3,082). It means that the maturity level comprehends a larger interval of compliance in the company, when the IT processes are evaluated. This way, there is more alignment between IT and Business.
Analyzing the results in the company, it could be said that the level of strategic alignment of IT in the organization is not properly managed. An improvement in several processes is required, especially in those that received a lower evaluation of maturity and have a greater impact on achieving an optimal level of alignment; in this case, the processes that have to be improve are PO8 and PO9 in the “plan and organize” domain, and processes ME3 and ME4 in the “monitor and evaluate” domain.
5. CONCLUSIONS
This work provided a new multi-criteria approach to assess IT Governance (ITG) for strategic alignment between IT and Business using Fuzzy Analytical Hierarchy Process (FAHP) in the COBIT framework, more specifically to the maturity levels, domains and processes, thus providing a differentiated analysis of importance for each item.
This research demonstrated that the combined use of multi-criteria decision methodologies and soft computing proves to be particularly suitable for the evaluation of IT strategic alignment. The model generated improvements the classic focus of the individual and isolated of process that are audited. This way, it is possible to better consider the choices in intervals that correspond to more qualitative, subjective or fuzzy analysis.
This model has been applied to a big retail enterprise, located in the south of Brazil, through individual interviews to generate Fuzzy maturity levels (FML). For future studies, the authors will direct efforts to increase the model in other focal areas of COBIT as CMMI© (Capability Maturity Model Integration) which means the best practices to the development and maintenance activities for new projects.
REFERENCES
Balli, S. & Korukoglu, S. (2009). Operating System Selection Using Fuzzy AHP and TOPSIS. Mathematical and Computational Applications, 14(2), 119-130.
Benítez, J., Delgado-Galván, X., Izquierdo, J. & Pérez-García, R. (2012). An approach to AHP decision in a dynamic context. Decision Support Systems, 53, 499-506.
Cadbury Committee (2011). Report of the Committee on the Financial Aspects of Corporate Governance. London, 1992. Retrieved March 8, 2014, from http://www.jbs.cam.ac.uk/cadbury/report/index.html
Chang, D. (1992). Extent analysis and synthetic decision. Optimization techniques and applications, World Scientific, Singapore, 1, 352.
Chang, D. (1996). Applications of the extent analysis method on fuzzy AHP. European Journal of Operational Research, 95, 649–655.
Chen, P.C. (2009). A Fuzzy Multiple Criteria Decision Making Model in Employee Recruitment. International Journal of Computer Science and Network Security, 9(7), 113-117.
Chen, L. (2010). Business–IT alignment maturity of companies in China. Information & Management, 47, 9–16.
De Haes, S., Van Grembergen, W. & Debreceny, R. (2013). COBIT 5 and Enterprise Governance of Information Technology: Building Blocks and Research Opportunities.
Journal of Information Systems, 27(1), 307.
Hirschheim, R., & Sabherwal, R. (2001). Detours in the path toward strategic information systems alignment. California Management Review, 44 (1), 87-108.
IBGC (2012). Código das melhores práticas de governança corporativa. 4ª ed., São Paulo, Instituto Brasileiro de Governança Corporativa (IBGC). Retrieved March 8, 2014, from http://www.ibgc.org.br/CodigoMelhoresPraticas.aspx
Iranmanesh, H., Shirkouhi, S.N. & Skandari, M.R. (2008). Risk Evaluation of Information Technology Projects Based on Fuzzy Analytic Hierarchal Process. World Academy of Science, Engineering and Technology, 40, 351-357.
ISACA, Information Systems Audit and Control Association (2012). COBIT Five: A Business Framework for the Governance and Management of Enterprise IT. Rolling Meadows, IL: ISACA.
ITGI (2013). COBIT 4.1: Framework, Control Objectives, Management Guidelines, Maturity Models. Information Technology Governance Institute. Retrieved March 8, 2014, from http://www.isaca.org
Jensen, M. & Meckling, W. (1976). Theory of the firm: managerial behavior, agency costs and capital structure. Journal of Financial Economics, 3, 305-360.
Kwok, L. & Longley, D. (1999). Information security management and modeling,
Lederer, A. L. & Mendelow, A. L. (1989). Coordination of information systems plans with business plans. Journal of Management Information Systems, 6 (2), 5-19.
Lederer, A. L. & Sethi, V. (1992). Root Causes of Strategic Information System Planning Implementation Problems. Journal of Management Information Systems, 9 (1), 25-45.
Li, Y. & Tan, C.H. (2013). Matching business strategy and CIO characteristics: The impact on organizational performance. Journal of Business Research, 66(2), 248–259.
Lien, C.T. & Chan, H.L. (2007). A Selection Model for ERP System by Applying Fuzzy AHP Approach. International Journal of the Computer, the Internet and Management, 15(3), 58-72.
Markaki, O., Charilas, D. & Askounis, D. (2010). Application of Fuzzy Analytic Hierarchy Process to Evaluate the Quality of E-Government Web Sites. DESE-10 Proceedings of the 2010 Developments in E-systems Engineering, 219-224.
Marnewick, C. & Labuschagne, L. (2011). An investigation into the governance of information technology projects in South Africa. International Journal of Project Management, 29, 661–670.
Meixner, O. (2009). Fuzzy AHP Group Decision Analysis and its Application for the Evaluation of Energy Sources. Proceedings of the 10th International Symposium on the Analytic Hierarchy/Network Process Multi-criteria Decision Making. University of Pittsburgh, USA.
Merali, Y., Papadopoulos, T. & Nadkarni, T. (2012). Information systems strategy: Past, present, future? Journal of Strategic Information Systems, 21, 125-153.
Mikhailov, L. & Tsvetinov, P. (2004). Evaluation of services using a fuzzy analytic hierarchy process. Applied Soft Computing, 5(1), 23–33.
Neto, J.S., Neto, A.N.F. (2013). Metamodel of the IT governance framework COBIT.
Journal of Information Systems and Technology Management, 10(3), 521-540.
Preittigun, A., Chantatub, W. & Vatanasakdakul, S. (2012). A Comparison between IT Governance Research and Concepts in COBIT 5. International Journal of Research in Management & Technology, 2(6), 581-590.
Saaty, T. (1980). The Analytical Hierarchy Process: Planning, Priority Setting, Resource Allocation. New York: Mc Graw-Hill.
Simonson, M., Johnson, P. & Ekstedt, M. (2010). The Effect of IT Maturity on IT Governance Performance. Information Systems Management, 27, 10-24.
Taylor, F. & Fitzgerald, T. (2007). Clarifying the Roles of Information Security: 13 Questions the CEO, CIO, and CISO Must Ask Each Other. Information Systems Security, 16(5), 257-263.
Tiwana, A. & Konsynski, B. (2010). Complementarities between organizational IT architecture and governance structure. Information Systems Research, 21(2), 288–304.
Van Laarhoven, P. & Pedrycz, W. (1983). A Fuzzy Extension of Saaty’s Priority
Van Grembergen, W. V. & Haes, S. D. (2004). IT Governance and Its Mechanisms, Information Systems Control Journal, 1, 27-33.
Van Grembergen, W., & De Haes, S. (2009). Enterprise Governance of Information Technology: Achieving Strategic Alignment and Value. New York: Springer, 233.
Wajeeh, I.A. & Muneeza, A. (2012). Strategic corporate governance for sustainable mutual development. International Journal of Law and Management, 54(3), 197-208.
Weill, P. & Ross, J.W. (2004). IT Governance - How Top Performers Manage IT Decision Rights for Superior Results. Boston. Massachusetts: Harvard Business School Press.
Weiss, J. & Thorogood, A. (2011). Information Technology (IT)/Business Alignment as a Strategic Weapon: A Diagnostic Tool. Engineering Management Journal, 23(2), 30-41.
Zadeh, L.A. (1965). Fuzzy Sets. Information and Control, 8, 338-353.
Zarvi´c, N., Stolze, C., Boehm, M. & Thomas, O. (2012). Dependency-based IT Governance practices in inter-organisational collaborations: A graph-driven elaboration. International Journal of Information Management, 32(6), 541–549.
Zviran, M. (1990). Relationships between Organizational and Information Systems Objectives: Some Empirical Evidence. Journal of Management Information Systems,
ANNEX: 34 PROCESSES DEFINED IN COBIT 4.1
Planning and Organization
PO1 Define a Strategic IT Plan
PO2 Define the Information Architecture PO3 Determine Technological Direction
PO4 Define the IT Processes, Organization and Relationships PO5 Manage the IT Investment
PO6 Communication Management Aims and Direction PO7 Manage IT Human Resources
PO8 Manage Quality
P09 Assess and Manage IT Risks P10 Manage Projects
Acquisition & Implementation
AI1 Identify Automated Solutions
AI2 Acquire and Maintain Application Software AI3 Acquire and Maintain Technology Infrastructure AI4 Enable Operation and Use
AI5 Procure IT Resources AI6 Manage Changes
AI5 Install and Accredit Solution and Changes Delivery and Support
DS1 Define and Manage Service Levels DS2 Manage Third Party Services DS3 Manage Performance and Capacity DS4 Ensure Continuous Service DS5 Ensure Systems Security DS6 Indentify and Allocate Costs DS7 Educate and Train Users
DS8 Manage Service Desk and Incidents DS9 Manage the Configuration
DS10 Manage Problems DS11 Manage Data
DS12 Manage the Physical Environment DS13 Manage Operations
Monitor and Evaluate
ME1 Monitor and Evaluate IT Performance ME2 Monitor and Evaluate Internal Control