_____________________________________________________________________________________ Recebido em/Manuscript first received: 11/11/2010 Aprovado em/Manuscript accepted: 24/05/2011 Endereço para correspondência/ Address for correspondence
Maria Verónica Alderete Conicet, Instituto de Investigaciones Económicas y Sociales del Sur (IIESS) - Departamento de Economía, Universidad Nacional Del Sur , 12 de Octubre y San Juan, (8000) Bahía Blanca, Provincia Buenos Aires, Argentina; + 54-0291-4595138; E-mail: [email protected];
NETWORKS VERSUS ICT USE: THE CASE OF SME FROM
BAHÍA BLANCA, BUENOS AIRES (ARGENTINA)
Maria Verónica Alderete Conicet
Instituto de Investigaciones Económicas y Sociales del Sur (IIESS), Argentina
__________________________________________________________________________________
ABSTRACT
Cooperative networks are main tools to improve the competitiveness of Small and Medium Size Enterprises (SME). This study contributes to extend the literature review about the factors that foster firms’ cooperative conduct. Apart from that, the paper examines through a LOGIT model, the firm’s characteristics, especially ICT (information and communication technologies) use, and the environment’s and partners’ characteristics that influence the probability of building alliances with other firms from the same economic activity. In particular, we find that ICT use reduces the probability of networking.
Keywords: cooperation, information and communication technologies, small and medium sized enterprises, innovation, LOGIT.
RESUMEN
Los acuerdos cooperativos son considerados herramientas importantes para mejorar la posición competitiva de las Pequeñas y Medianas Empresas (PYMES). Este estudio realiza un aporte a la revisión de la literatura, con respecto a los factores que fomentan el comportamiento asociativo. Por otro lado, examina a partir de un modelo LOGIT las características de la empresa, con énfasis en el uso de las TIC, su entorno y sus socios que inciden sobre la probabilidad de configurar alianzas con otras empresas de la misma rama o sector. En especial, se encuentra que el uso de las nuevas tecnologías de la información y de la comunicación disminuyen la probabilidad de formar alianzas.
1. INTRODUCTION
Nowadays, the dynamism of a competitive firm flows from the development and implementation of a new technology to the adoption of new organizational structures. For more than 20 years, inter-firm cooperation has been considered a corporate strategy, but only recently this strategy has become more important. In particular, Small and Medium Sized Enterprises (SME) participate in the two connected trends worldwide. On one hand, the paradigm shift from traditional mass production practices, where scale economies prevailed in large firms, to a new industrial framework based on flexible production systems responding quickly to the demand requirements. On the other hand, we observe the progressive diffusion of the new information and communication technologies (ICT) in the economic activity. By taking advantage of the ICT use, SME can obtain advantages in transaction and information costs, leading to the restructuring, both internal and external, of firm’s coordination and management. Mariotti (1997) argues that this paradigm shift is followed by the appreciation of innovation processes and technological change, key factors for the firm performance in the new competitive framework (Martín and Retondo, 2004).
Technology use affects production processes and conditions firms to adopt new strategies. Among these ones we find network building between firms, a current practice to enhance the competitiveness and survival of SME. Nohria and Eccles (1992) determine three main reasons for the increasing interest in networks in organizational studies: 1) the emergence of a new competition, as in the Italian districts and the Silicon Valley cases. This new organizational model is characterized by intra-firm and inter-firm networks, instead of the large inter-firm hierarchy. 2) The ICT emergence that fosters inter-relations between isolated firms. 3) The consolidation of the network analysis as an academic discipline.
Wittmann et al (2008) analyze, through a descriptive analysis, the cooperation actions of SME from Rio Pardo Valley and Taquari in Brazil, members of the Cooperation Networks Programme. The main factors that promoted cooperation were the exchange of experiences between businessmen from the same production sector and the reduction of costs; and, at a lower level, the access to innovations and technologies.
There is still not a unified theory or theoretical perspective to understand the explanatory factors of inter-firm cooperation. Child and Faulkner (1998) state that different organizational theories analyze cooperation between firms, such as the economic theory, game theory, strategic management, theory of organizations and sociology (Wittmann et al, 1998).
Casarotto and Pires (1999) argue that the emergence and survival of networks and alliances depend on four aspects: a culture of trust between firms, cultural aspects and personal interests of the partners, a culture of competence of each partner and a culture of information technology to speed up the information flows between the firms of a network (Wittmann et al, 2008).
firm’s location, such as the relevant market, the competence changes, the number of technology intensive firms, and the economic policy of the countr, also matter.
First, the paper introduces a brief review of the literature on some explanatory factors of the cooperative strategy of firms. Secondly, it describes the situation of SME from Bahía Blanca in terms of the most relevant variables on cooperation. Thirdly, an econometric model captures the significant variables on the probability to cooperate such as firm’s characteristics, especially ICT, the entrepreneur’s and specific market characteristics.
2. LITERATURE REVIEW
Several empirical studies have tested the theoretical arguments about inter-firm cooperation alongside different organizational settings enhancing its comprehension. Van Gils and Zwart (2009) indicate through an exploratory analysis that alliances are determined by a mix of organizational causes related to the partners and the industrial sector. However, only a few studies introduce ICT as a factor that fosters cooperation.
Many empirical studies employ the Internet and bandwidth availability as variables to identify ICT use. ICT use allows instant and in-real-time information and communication exchange. However, the effects of a richer and faster communication in cooperative behavior are still not clear.
According to OCDE (2004), Internet and e-commerce have the potential to reduce transaction costs and to increase transactions’ speed, trust and value, at firm level in their value chains. They can reduce inefficiencies from a lack of coordination between a value chain’s firms. Fernández and Nieto (2005) notice, from a Spanish firms’ database, that Internet use reduces internal coordination costs and transaction costs as a result of the positive relationship between Internet use, the degree of vertical integration and technological agreements with suppliers and clients. Thus, Internet not only changes the firm’s operation mode, but also its size and limits. Brynjolfsson et al (1994) find that information technology investment correlates with a reduction in firm size, suggesting that ICT affects a firm’s external coordination more significantly than its internal coordination.
Neves and Chiari da Silva (2003) analyze the viable information and communication media and complementary factors that affect networks’ building and performance.
Among the structural characteristics that promote alliances is the firm size. Usually, the firm’s size predicts inter-firm cooperation. The larger the firm is, the higher the probability to cooperate will be. However, there is no consensus on this issue. Dana (2001) states that firms of all sizes are involved in inter-firm activities (Harl et al, 2003). While most of the authors observe the firm´s absolute size, Gomes Casseres (1997) observes the relative size of a firm compared to the competitors´ relative size. SME in market niches or as technological leaders could have less propensity to cooperate, while large firms with low market power or lack of technological know-how could reach scale or scope economies through inter-firm cooperation. SME could be leaders in their activity while large firms could be smaller than their competitors. Shan (1990) suggests that small firms are more likely to build cooperative arrangements than large firms (Street and Cameron, 2007).
Furthermore, Murria and Siehl (1989) conclude that alliances help to overcome scale economies present in international markets. It is assumed that the higher the level of internationalization (or export intensity measured as income percentage from external sales), the higher the probability to build alliances (Dickson and Weaver, 2003).
Apart from that, the firm age can affect the cooperation propensity. According to Bruederl and Preisendoerfer (1998) and Littunen (2000), especially newly born firms can benefit from inter-firm networks (Harl et al, 2003). In many cases, these firms can become competitive, innovative and efficient by networking. From the Resource Based View1, alliances are built to access critical resources and, therefore, to gain competitive advantages.
Moreover, the owner’s personal or individual characteristics matter. Pichler and Voithofer (1999) defined different types of entrepreneurs, the “pioneer”, who likes taking risks, is open to change; and the “organizer” with executive-manager skills. The pioneer seems to have a higher propensity to cooperate than the organizer. Apart from that, Colvin and Slevin (1989) propose the strategic orientation of the firm as a variable to differentiate between firms with a cooperative conduct and those with an independent one.
Lastly, we find the industry and specific to the firm’s location characteristics. Masurel and Janszen (1998) consider that a high commercial cooperation level comes from a high market concentration. In particular, when big stores dominate the market, SME (especially food retailers) joins in cooperative organizations more frequently. Some authors, like Sell (1995), explain that propensity to cooperation depends on the level of competence of the markets. Cooperative strategies can be different in oligopolistic markets firms from competitive markets ones (Harl et al, 2003). Rosenkopf and Schilling (2007) study the difference in networks and alliances structures alongside the different industries through the analysis of 32 industrial alliances. Industries that are ranked high in technological dynamism (as computers and office equipment, motors and turbines, video audio equipment) have a high percentage of networked firms. They present a graphic structure called “hybrid or spiderweb”. Firms in cotton, paper and leather footwear industries build networks of small size (between 12 and 13 members) and with few links between nodes. In contrast, computers, telecommunications and motor vehicles industries build large networks with more members and higher level of connectivity.
1 The Resource Based View considers an organization as a reflection of its internal resources. View built under the
the degree of the link between an organization with other firms and the institutional system explains the development of networks. The environment must favor the building of networks process. According to Ahwireng Obeng (2001), governmental plans and policies towards cooperation increase network formation. Governmental institutions can act as intermediaries to promote the development of trust among the interest parts (Street and Cameron, 2007).
In the end, when firms decide to build networks they choice partners based on their existent relationships or search for references on other partners, previous alliances or third parties links (Gulati,1995). Collaboration with business partners can be a main source of learning for the firm.
Other important variable is the degree of innovation of the firm, in terms of products, processes and internal organization. According to Ahuja (2000), businesses with significant inventions, but lack of commercial, technical and social capital will more probably search for alliances (Street and Cameron, 2007). However, there is evidence of a strong correlation between innovation and networking. In Australia, in response to the low levels of investment (compared to OCDE countries) and due to the government interest to increase national competitiveness, new policies were implemented to promote networking (Brunetto and Farr-Wharton, 2007). Roger (2004), using a sample of Australian firms, finds evidence of persistence in innovative activities and that the use of networks is associated with innovation in some sector-firm size categories. Small manufacturing firms exhibit a positive association between networking and innovation. In contrast, non manufacturing firms present a positive relation in medium and large firms. Differently from this paper, Roger analyzes a PROBIT model where networking is an explanatory factor of innovation.
3. METHODOLOGY. DATABASE SOURCE
Empirical testing of the model implies a sample of 103 SMEs from the city of Bahía Blanca, Buenos Aires Province, Argentina. The database corresponds to the year 2006 from interviews made in 2007. According to the information from Bahía Blanca, in 2007 the city counted with 679 industrial firms, with a 99% of SME.
With the aim of achieving a representative sample, 103 firms were interviewed. The sample was constructed considering the natural stratification based on the production specialization of the total number of firms2. It collects information on different characteristics of the firm: owner´s socio-cultural characteristics, firm structural characteristics (including relationships with suppliers, clients and between firms), and market and environment characteristics. The classification of the firms by firm size corresponds to the number of employees and emerges from the analysis of the frequency of firms per each size category: Micro-firm (1 to 5 employees); Small 1 (6 to 10 employees), Small 2 (11 to 50 employees) and Medium (more than 50 employees). Most of the firms from this classification are Small 2 (40,8%), followed by micro-firms (28,2%), Small 1 (25,2%) and Medium (5,8%) in order of importance. There are firms
2 The number of firms interviews by industry were: 35 Food and Beverage , 8 Clothing and Textile, 7 Wood , 11
with different sizes, levels of productive specialization and, therefore, different degrees of complexity in terms of products and processes. Thus, there are not structural biases in the sample.
Next, we made a descriptive analysis of the firms considering the main variables from the literature. Afterwards, we apply a Categorical Principal Components Analysis to reduce data dimensionality, that is, to reduce the set of original variables into a smaller set of uncorrelated components that represent most of the original variables’ information. Then, a logistic binary regression captures the significant explanatory variables of cooperative propensity. Lastly, we elaborate some final considerations.
4. FIRMS CHARACTERIZATION BY COOPERATIVE CONDUCT
In this section, an explorative analysis shows the effect of the explanatory variables on cooperative conduct. First, we study the cooperative conduct of the sample. Only 9 firms (nearly 8%) participate in cooperative initiatives with other firms from the same economic activity (Table 1). The most frequent types of cooperative initiatives are UTE-Unión Transitoria de Empresas3 (Transitory Union of Firms, a kind of joint venture) and Other Initiatives. Among these last, there is an Operation Society, an Association for Promotion/Marketing (for trade fairs, publicity, TV programmes) and a Joint Sales Agreement. Two firms participate in a Research Consortium and there is not any Export Consortium. Thus, we observe just a few cooperative initiatives, and, moreover, of a heterogeneous type. Among the networked firms, one firm participates in two types of networks; this explains why the total of responses (10) is larger than the total of firms (9).
Table 1
N
% column
responses
Type of
cooperation
Unión Transitoria de Empresas (UTE) 4 44,4%
Others 4 44,4%
Research Consortium 2 22,2%
Total responses 10 111,1%
Total firms 9
Source: The author.
3 An UTE is a plurilateral contract where companies or individual businessmen join to develop or execute a particular
Some descriptive statistics of the explanatory variables appear in Table A from Appendix.
4.1. Structural Characteristics
4.1.1 Firms Size
Nearly 56% of the firms with any cooperative initiative (called ‘networked firms’) are size Small 2 (Figure 1). Therefore, quite a half of these firms have more than 10 employees, while among the not networked firms those with less than 10 employees prevail.
Figure 1
Source: The author.
According to the classification of firms by amount of sales from the Small and Medium Size Enterprises Secretary (147/2006 order) for industrial sector (Micro-firm: less than $1.250.000 per year; Small: between $1.250.000 and $7.500.000; Medium: between $ 7.500.000 and $ 60.000.000 and large: more than $60 mill.), we observe in Table 2 that among non-networked firms micro-firms prevail, while most networked firms are small and medium sized4.
4 The total number of firms is lower than 103 due to missing data on value of sales.
Classification of networked firms by size
22,2 28,7
27,7 55,6
39,4
22,2
4,3
0% 10% 20% 30% 40% 50% 60% 70% 80% 90% 100%
Yes No
Cooperation with other firms
%
fi
rm
s
Table 2
Classification by Sales Total
Micro-firm Small Medium N
row % N row % N row % N row %
Cooperation with other firms
Yes 2 25,0% 3 37,5% 3 37,5% 8 100%
No 38 67,9% 14 25,0% 4 7,1% 56 100%
Total 40 62,5% 17 26,6% 7 10,9% 64 100%
Source: The author.
4.1.2 Firm Age
No significant difference on firm age seems to exist between networked and non-networked firms (Table 3). The sample includes firms with 30 years with the same company name. Local firms are usually familiar and traditional firms. As we can see in Table 3, the average age of networked firms is slightly higher than non-networked ones5.
Table 3
Networking Media N St. deviation
Yes 30,67 9 25,189
No 27,93 94 20,189
Total 28,17 103 20,542
Source: The author.
4.2. Personal characteristics of the owner
4.2.1. Age of the owner
The age of the owner can be used as a proxy variable of the type of entrepreneur. In Table 4 we observe that owners older than 50 years old prevail (63,3% of the firms). Therefore, most of the owners are conservative entrepreneurs.
5 To determine that there is no significant difference in the average age of the firms according to their cooperative
Table 4
Frequency Percentage Actual % Accum. %
Valid Less than 30 years 3 2,9 3,1 3,1
Between 30 and 50 33 32,0 33,7 36,7
More than 50 years 62 60,2 63,3 100,0
Total 98 95,1 100,0
Missing data 5 4,9
Total 103 100,0
Source: The author.
4.3. Information and Communication Technologies
4.3.1. ICT access
ICT access is pretty disseminated among firms. Nearly 78% of SMEs have got Internet and e-mail access. Besides, website availability appears in 42% of SMEs. Access to EDI or Electronic Data Interchange systems, Extranet and Intranet are still low (20,4%, 19,4% and 1,9% respectively). Thus, the more complex ICT is, the lower the percentage of firms with ICT access.
However, if we compare networked and non-networked firms (Figure 2) we can observe that the percentage of firms with ICT access is higher in networked firms.
Figure 2
4.3.2. ICT Use or Diffusion
We differentiate between ICT access and ICT use. ICT use suggests how a firm takes advantage of ICT access.
Table 5
Cooperative Initiative
Total
Yes No
Promote the firm and its products on a website
Frequency 5 39 44
Col % 62,5 54,2 55
Sell products (e-commerce) Frequency 1 6 7
Col % 12,5 8,3 8,8
Buy products (e-commerce) Frequency 3 12 15
Col % 37,5 16,7 18,8
Contact with clients already known Frequency 8 59 67
Col % 100 81,9 83,8
Contact with potential clients Frequency 7 44 51
Col % 87,5 61,1 63,8
Contact with suppliers already known Frequency 8 61 69
Col % 100 84,7 86,3
Contact with potential suppliers Frequency 8 41 49
Col % 100 56,9 61,3
Collect information about the activity Frequency 5 38 43
Col % 62,5 52,8 53,8
Communication with public authorities Frequency 3 20 23
Col % 37,5 27,8 28,8
Banking or financial services Frequency 8 44 52
Col % 100 61,1 65
Suppliers post sale services Frequency 3 13 16
Col % 37,5 18,1 20
Post-sale services to clients Frequency 4 17 21
Col % 50 23,6 26,3
Others Frequency 1 2 3
Col % 12,5 2,8 3,8
Total Frequency 8 72 80
Col % 100 100 100
Most of the firms use the Internet to contact suppliers and clients that are already known, and for banking and financial services (Table 5). Networked firms also use the Internet to contact potential clients, promote the firm and collect information about the sector.
4.4. Industrial sector characteristics
On average, the most frequent destinations of sales are Bahía Blanca, and Federal Capital and Gran Buenos Aires (Table 6). We can observe that the average percentage of sales to Bahía Blanca is higher among not networked firms.
Table 6
Cooperation
Bahía Blanca
Buenos Aires SW
South of Arg.
Fed Cap. GBA
Rest of Arg.
Merco sur
Rest A.L.
Rest world
Yes Media 41,25 20,42 26,07 29,17 22,58 20,00 1,00 10,50
N 8 6 7 3 6 1 1 2
No Media 66,87 23,96 27,71 37,87 26,00 22,00 24,67 17,50
N 86 52 41 15 21 2 3 2
Total Media 64,69 23,59 27,47 36,42 25,24 21,33 18,75 14,00
N 94 58 48 18 27 3 4 4
Source: The author.
The number of firms with international sales is small (see last three columns of Table 6). Only 7 firms have exported, 2 of which are networked with others. Therefore, the set of firms that are networked and have exported is small in this sample.
4.5. Characteristics of the Environment
Figure 3
Source: The author.
Furthermore, the promotion of different economic policies according to the type of industry can foster cooperation. In the inquiry, there is information about the firms’ perception of the sufficiency level of local government economic policies promotion. The perception of insufficiency prevails, being superior among non-networked firms.
4.6. Previous alliances or arrangements with third parties
A firm’s business arrangements with suppliers and/or clients are supposed to be a source of experience for networking between firms.
Figure 4
Source: The author.
Business arrangements with suppliers
33,3
78,7
1,1
20,2 66,7
0% 10% 20% 30% 40% 50% 60% 70% 80% 90% 100%
Networked Non-networked
Firms %
Missing data No
We observe that 25 firms made business arrangements with suppliers, that is, nearly 24% of the sample. Apart from that, 67% of the networked firms developed these arrangements (Figure 4).
4.7. Firm innovation
The database collects information about products, processes and internal organization innovation.
In general terms, we observe that the degree of innovation is low. In respect to product innovation, firms preserve the same product with changes in the inputs employed (28.16%), or changes in the recipient (25.24%). In general, the percentage of firms that introduces a new product to the market is small (15.53%). However, after the classification of firms in terms of cooperation, we observe (Table7) that, among networked firms, the percentage of firms that made a new product is significant. Therefore, the level of innovation of networked firms is higher than not networked firms.
Table 7
Product Innovation*
Cooperation
Yes No Total
N % N % N %
Change in some product recipient 0 0 26 27,66 26 25,24
Change in some product process 0 0 6 6,38 6 5,83
Change in some product inputs. 4 44,44 25 26,60 29 28,16
New product for the firm, not for the market 1 11,11 25 26,60 26 25,24
New product for the market 4 44,44 12 12,77 16 15,53
Total 9 100 94 100 103 100
Source: The author. * Categories ordered from low to high level of innovation.
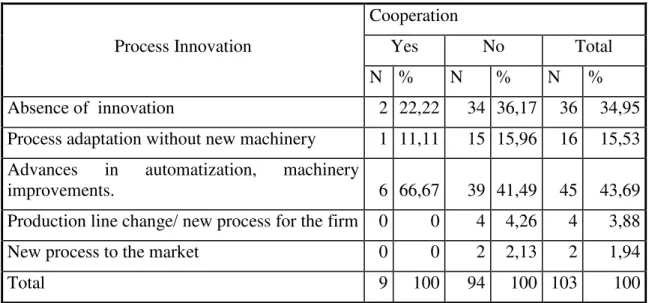
Table 8
Process Innovation
Cooperation
Yes No Total
N % N % N %
Absence of innovation 2 22,22 34 36,17 36 34,95
Process adaptation without new machinery 1 11,11 15 15,96 16 15,53
Advances in automatization, machinery
improvements. 6 66,67 39 41,49 45 43,69
Production line change/ new process for the firm 0 0 4 4,26 4 3,88
New process to the market 0 0 2 2,13 2 1,94
Total 9 100 94 100 103 100
Source: The author.
Lastly, 50% of the firms did not make investments inside the firm organization. Only 8% made some strategic planning. If we group firms by cooperation, we observe (Table 9) that the internal organization level of innovation is higher among networked firms compared to the others (percentages for each category are higher in the first group).
Table 9
Internal organization innovation
Cooperation
Yes No Total
N % N % N %
Strategic Planning 1 11,11 7 7,45 8 7,77
Control Board 1 11,11 3 3,19 4 3,88
Management Software without control board 2 22,22 11 11,70 13 12,62
Written Informs about each performance area 0 0,00 3 3,19 3 2,91
Management processes and/or electronic
systems reorganization 2 22,22 20 21,28 22 21,36
Absence of innovations 2 22,22 50 53,19 52 50,49
Do not know 1 11,11 0 0 1 0,97
Total 9 100 94 100 103 100
5. ESTIMATED MODEL
In the previous section we have analyzed the relationship between each explanatory variable and the cooperative conduct. Next, through the logistic regression we will determine the simultaneous influence of the set of variables in cooperation conduct, considering the importance of each variable while taking into account the simultaneous influence of the others.
We want to estimate which factors are affecting the probability of networking by means of a LOGIT model.
Dependent variable (networks): Cooperative conduct. Binary variable that takes value 1 if the firm has networked with other firms (have participated in any associative initiative), and 0 otherwise.
The LOGIT model derives from a model of latent or unobservable variable. Let y* be the latent variable ‘cooperative conduct’ that is determined by some independents observable variables through the following structural equation:
y*= β0 + x β + e , y = 1[ y*>0]
The relationship between the observed binary variable y (if the firm networked with other firms) and the latent variable y* (cooperative conduct) emerge through the following equation:
y = 1 si y* > 0
y = 0 si y*<=0
In this paper we supposed that the error term e assumes a logistic distribution with Var e = π2/ 3. Thus, the resulting LOGIT model equation is:
). exp(
1
) exp(
) / 1 Pr(
x x x
y
β α β α
+ +
+ =
=
Independent variables:
By means of a Categorical Principal Components Analysis (CATPCA), we identified a few factors to represent the existent relationship among the interrelated variables (CATPCA appendix). We interpret the factors as follows:
Type of Firm: this bundle represents mainly quantity of employees and value of sales that are interpreted as firm size. We suppose that the larger the firm, the higher the probability of networking with other firms.
Market: this set comprises the market destination of sales, mainly Bahía Blanca or southwest Buenos Aires and the Federal capital and Gran Buenos Aires. This factor represents the main market. Usually, firms that mostly sell to local markets (Bahía Blanca) have less probability of networking.
This factor captures the industrial characteristics of the firm. We suppose that some industries are more willing to build arrangements according to their potential growth and profitability, degree of concentration, and so on. The variable ‘market destination of sales’ is preferred to the industry or economic activity variable due to the presence of heterogeneity in some industries, as in Food and Beverage.
Innovation: Mainly product and process innovations made during the last three years. We refer to the impact of innovation of networking, although there is a wide literature studying the inverse relationship (how networking promotes innovation). We suppose that the higher the level of innovation, the larger the need to network to share resources, especially knowledge.
Arrangements: Business arrangements with suppliers and clients on different items: price, quality, product delivery, etc. We suppose that these arrangements represent the training/experience of firms in cooperation with other agents.
Environment: frequent contacts with the City Hall, perception about local development policies and the relationship between firms and public authorities. Through this factor we analyze the link between the environment and the networking activity. We suppose that frequent contacts with authorities can foster networking in the business sector.
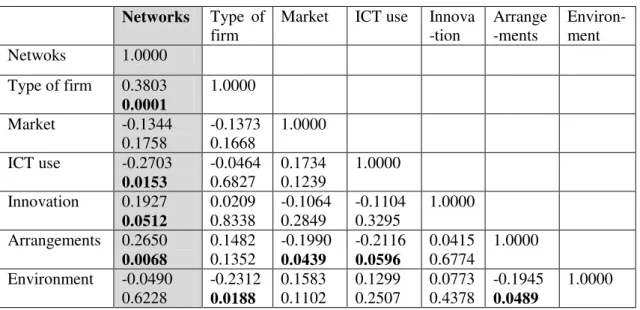
Table 10: Correlation matrix
Networks Type of firm
Market ICT use Innova -tion Arrange -ments Environ-ment Netwoks 1.0000
Type of firm 0.3803
0.0001 1.0000 Market -0.1344 0.1758 -0.1373 0.1668 1.0000
ICT use -0.2703
0.0153 -0.0464 0.6827 0.1734 0.1239 1.0000 Innovation 0.1927
0.0512 0.02090.8338
-0.1064 0.2849 -0.1104 0.3295 1.0000 Arrangements 0.2650 0.0068 0.1482 0.1352 -0.1990 0.0439 -0.2116 0.0596 0.0415 0.6774 1.0000 Environment -0.0490 0.6228 -0.2312 0.0188 0.1583 0.1102 0.1299 0.2507 0.0773 0.4378 -0.1945 0.0489 1.0000
variables are not significantly correlated among them.
6. RESULTS
The goodness of fit of the model is adequate considering the observed measures of R2 and the Likelihood Ratio6 (Table 11). In contrast to Harl et al (2003) the firm size is a significant variable. Thus, the firm size affects the decision to network.
Apart from that, the market variable does not have any incidence on the probability of networking. Besides, ICT use presents a significant but negative effect, meaning that the higher the ICT use, the lower the probability of networking. This unexpected result can be understood by analyzing the type of networks or cooperative initiatives present in the sample, and the most frequently ICT uses. Firms group for a marketing goal, to promote sales, develop trade fairs, TV programs and for buying and selling jointly.
According to the United Nations Conference on Trade and Development
(UNCTAD), the increasing ICT use generates “intangible assets” (such as organization and management enhancements) that increase the global efficiency of all the production sectors (Naciones Unidas, 2007). Therefore, an adequate ICT use could generate competitiveness in some firms as an alternative to networking.
The estimated probabilities of networking for each firm vary from 0.000009 to 0.9971 with an average probability of 0.10.
Table 11
Variable Coefficient P-Value Level of significance
Type of firm 1.044312 0.060 *
Market .3283399 0.230 Ns
ICT use -1.35919 0.067 *
Innovation 2.060916 0.086 *
Arrangements 1.46787 0.222 Ns
Environment -.4860203 0.456 Ns
_cons -5.226209 0.000 **
Pseudo R2 = 0.6100 LR chi2(16) = 31.47 Prob > chi2 = 0.0048
*Significance at 10%. Source: The author, estimation obtained through the STATA 8.1.
Next, we focused on some significant explanatory variables. To study the impact of each variable on the probability of networking, we compute the predicted probability under two possible values of the independent variables: maximum and minimum (Table
6 The model predicts 93,75% of the cases correctly. When the result is positive (firms networked) the model predicts
12). We want to analyze the variation in the predicted probability when the independent variable takes a maximum or minimum level, without specific values for the rest of the variables which are considered at their average levels.
Table 12
Type of firm ICT use Innovation
Maximum 0.9699 0.0007 0.2714
Minimum 0.0036 0.2953 0.0003
Prob. Difference 0.9663 -0.2946 0.2711
Source: The author.
We can observe that the largest difference in the probability of networking is related to the firm´s size (0.9663). Nevertheless, innovation shows an important differential effect (0.2711).
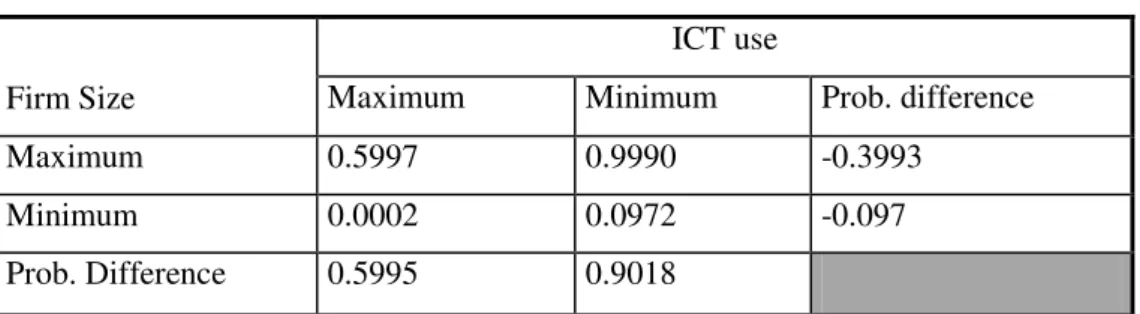
Table 13 output shows that ICT use generates a significant variation in the probability of networking when firm size is maximum (in the sample, the largest firm is Medium size). Therefore, if the firm is maximum in size, a higher ICT use reduces the probability in nearly 40%.
Table 13
Firm Size
ICT use
Maximum Minimum Prob. difference
Maximum 0.5997 0.9990 -0.3993
Minimum 0.0002 0.0972 -0.097
Prob. Difference 0.5995 0.9018
Source: The author.
Table 14
Type of firm
ICT Use Prob.
difference
Max Min
Max Innovation Max 0.9754 1 -0.0246
Min 0.0355 0.9593 -0.9238
Prob Dif 0.9399 0.0407
Min Innovation Max 0.0044 0.7405 -0.7361
Min 0.0000 0.0026 -0.0026
Prob Dif -0.0044 0.7379
Source: The author.
Among medium firms, with high levels of innovation, the probability of networking is high, and ICT use does not have a significant incidence. However, in medium firms where the level of innovation is nearly inexistent, the probability of networking depends negatively on ICT use. Thus, the higher ICT use or diffusion would replace the networking need. ICT use and alliances emerge as alternative sources of competitiveness.
Among micro-firms, with a minimum level of innovation, the probability of networking is nearly inexistent, and ICT use effect is worthless. Nevertheless, micro-firms with high levels of innovation have less probability of networking if ICT use is high. ICTs are used to satisfy some objectives that can also be reached through networking, for instance, increase in sales, marketing, etc.
7. FINAL REMARKS
Nowadays, the dynamism of a competitive firm flows from the development and implementation of a new technology to the adoption of new organizational structures. We can find different types of cooperation, and different concepts used as synonyms as inter-firm cooperation, strategic alliances, networks, cooperative outsourcing, for instance.
In particular, the degree of networking among local SMEs is low. Based on the sample, we observe that only 8% of the firms have networked with other firms from the same industry, where the UTEs prevail. The low number of cooperative initiatives of the sample is one of the limitations of the estimated econometric model. However, we consider the model as robust taking into account the fact that convergence was reached with a few iterations, and that joint statistical significance of the model is high.
markets, optimize inputs and marketing. However, ICT use could not be treated as networks substitutes when firms cooperate for achieving joint production and innovation, which are economically different business goals. Apart from that, although the model includes most of the relevant variables considered in other papers, it does not analyze others mentioned in the literature of networking such as trust, whose treatment in econometric models is still a challenge since the absence of an appropriate measure.
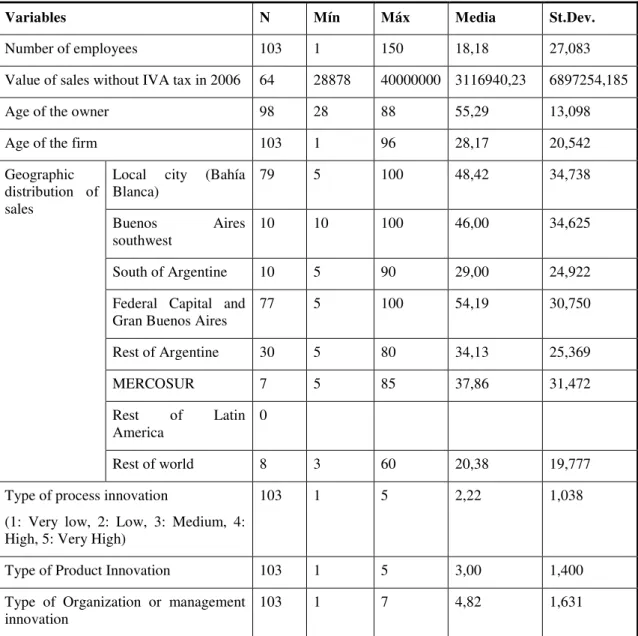
APPENDIX I
Table A: Descriptive Statistics.
Variables N Mín Máx Media St.Dev.
Number of employees 103 1 150 18,18 27,083
Value of sales without IVA tax in 2006 64 28878 40000000 3116940,23 6897254,185
Age of the owner 98 28 88 55,29 13,098
Age of the firm 103 1 96 28,17 20,542
Geographic distribution of sales
Local city (Bahía Blanca)
79 5 100 48,42 34,738
Buenos Aires southwest
10 10 100 46,00 34,625
South of Argentine 10 5 90 29,00 24,922
Federal Capital and Gran Buenos Aires
77 5 100 54,19 30,750
Rest of Argentine 30 5 80 34,13 25,369
MERCOSUR 7 5 85 37,86 31,472
Rest of Latin America
0
Rest of world 8 3 60 20,38 19,777
Type of process innovation
(1: Very low, 2: Low, 3: Medium, 4: High, 5: Very High)
103 1 5 2,22 1,038
Type of Product Innovation 103 1 5 3,00 1,400
Type of Organization or management innovation
103 1 7 4,82 1,631
Observations: the Statistics were calculated for the numerical explanatory variables. We do not consider the binary variables.
APPENDIX II Categorical Principal Components Analysis
This analysis employs an optimal scaling technique to generalize CATPCA to transform variables having different units of measure (scale or numerical, ordinal, nominal). The method use is Principal Normalization Variable.
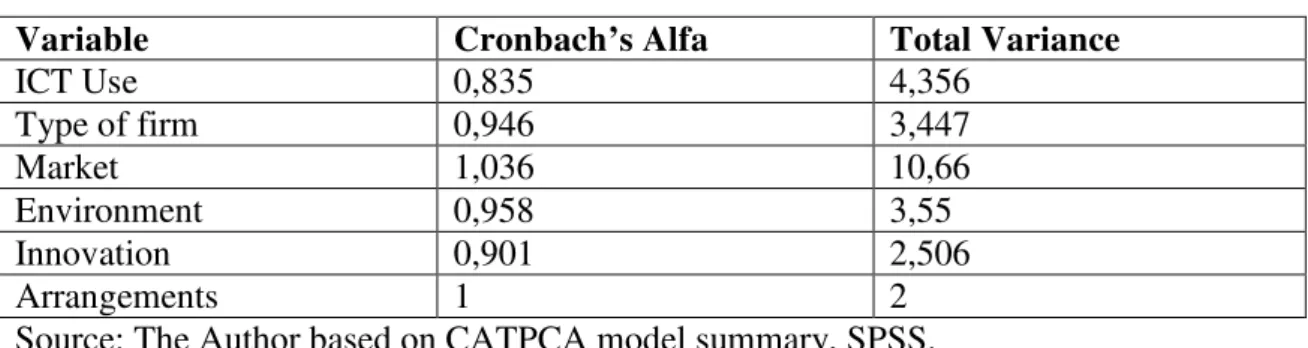
Table Cronbach’s Alfa
Variable Cronbach’s Alfa Total Variance
ICT Use 0,835 4,356
Type of firm 0,946 3,447
Market 1,036 10,66
Environment 0,958 3,55
Innovation 0,901 2,506
Arrangements 1 2
Source: The Author based on CATPCA model summary, SPSS.
The weight of a dimension is measured by the eigenvalue. Under Joliffe rule (1972, 1986) a dimension is important if the eigenvalue is higher than 0.8, if a variable “weights high” in one of the dimensions, it is considered relevant for the dimension’s or component’s interpretation.
Table Components Loadings
Dimension
1 2
ICT Use Promote the firm and its products on a website
-,142 ,465
Sell products (e-commerce) ,363 ,548
Buy products (e-commerce) ,433 ,611
Contact with clients already known ,427
,278
Contac with potential suppliers ,579 ,108
Contact with suppliers already known
,269 -,325
Contact with new suppliers ,553
,137 Collect information about the economic activity or industry ,504 ,113
Communication with public authorities ,603 -,135
Banking and financial services ,523
-,031
Suppliers’ post sales services ,527 -,493
Post sales services to clients ,571
-,400 Type of firm
Number of employees ,916 -,378
Value of sales without IVA tax in 2006 ,896 -,379
Age of the firm ,516 ,726
Market
Local city 1,992 ,640
Buenos Aires Southwest -,720 -,092
South of Argentine -,438 -,658
Federal Capital and Great Buenos Aires -,578 -,371
Rest of Argentine -,772 1,042
MERCOSUR -,338 ,868
Rest of América Latina -,487 1,195
Rest of world ,265 -,615
Environment Communication frequency with Firms Unions
-,239 -,671 Perception about the adequacy level of local policies to promote economic
development ,491 ,815
Perception about the adequacy level of the relationship between the firms and
Firms Unions ,996 -,288
Perception about the adequacy level of the relationship between the firms and local
authorities ,997 -,274
Innovation
Type of process innovation ,850 -,235
Type of product innovation ,850 ,237
Type of management innovation -,001 ,974
Arrangements
Business arrangements with suppliers 0,877 -0,48
Business arrangements with clients 0,877 0,48
Source: The Author based on CATPCA, SPSS. Normalization by Principal components.
REFERENCES
Brunetto, Y. and Farr-Wharton, R. (2007). “The moderating role of trust in SME owner/managers’decision-making about collaboration.” Journal of Small Business Management, vol. 45, Nº3, pp. 362–387.
Dickson, P.; Weaver, K.M.; (2003) “Attributes of the strategic alliance readiness of SME´s”. Working Paper, International Council of Small Business, 48th World Conference, Belfast.
Gomes-Casseres, B.(2003); “Competitive advantage in alliance constellations”. Strategic Organization. Vol 1, Nº3, pp 327-335.
Gulati, R.(1995). “Social structure and alliance formation patterns: a longitudinal analysis”. Administrative Science Quaterly.
Harl, R.; Pleitner, H.J; Schermerhorn, J.R.; Welsch, H.P.(2003). “Collaboration Initiatives among SMEs”. ICSB 48 th World Conference, Belfast.
empresas: análise de modelos de comunicação e informação.” XXIII Encontro Nac. de Eng. De Produção, Ouro Preto, MG, Brasil, 21 al 24 de Out.
Nohria, N. y Eccles, R. G. (eds.) (1992). Networks and organizations: Structure, form, and action. Harvard Business School Press.
Okamuro, H. (2003). “Support networks for R&D of the japanese SMEs”. ICSB 48th World Conference. Belfast.
Roger, M. (2004). “Networks, firm size and innovation.” Small Business Economics, Vol. 22, pp. 142-153.
Rosenkopf, L. and Schilling, M. (2007). “Comparing alliance network structure across industries: observations and explanations”. Strategic Entrepreneurship Journal, Vol.1, pp. 191-209.
Street, C. and Cameron, A.F. (2007). “External relationships and the small business: A review of small business alliance and network research.” Journal of Small Business Management, vol. 45, N°2, pp.239-266.
Van Gils, A. and Zwart, P. (2009). “Alliance formation motives in SMEs: an explorative conjoint analysis study.” International Small Business Journal, vol.27, N°5.