The Effects of Early Childhood Education on Literacy
Scores Using Data from a New Brazilian Assessment
Tool
Fabiana de Felício
METAS - Avaliação e Proposição de Políticas Sociais
Endereço para contato: Rua Santa Justina, 464 - Vila Olímpia - CEP: 04545-042 e-mail: [email protected]
Rafael Terra
Doutorando em Economia, Escola de Economia de São Paulo (EESP-FGV) Endereço: Rua Itapeva 474 - Bela Vista - CEP: 01332-000
e-mail: [email protected]
Ana Carolina Zoghbi
Doutora em Administração Pública e Governo - (EAESP-FGV)
Endereço para contato: Rua Itapeva 474 - 12º andar - Bela Vista - São Paulo - CEP: 01332-000 e-mail: [email protected]
Recebido em 28 de janeiro de 2011. Aceito em: 12 de dezembro de 2011
Abstract
The aim of this study was to identify the effects of early childhood education (ECE) on literacy scores of 2nd grade students in elementary school. To do that, the Provinha Brasil was administered in Sertãozinho-SP, in conjunction with a socioeconomic ques-tionnaire. Despite external validity problems, the evaluation of the effects of ECE in one municipality is advantageous, as we can estimate the effects of one kind of treat-ment. Other studies ignore this fact. Often, they estimate an average effect of various treatments effects (not just one), as they use data from different municipalities where ECE programs have different levels of quality. The OLS and Propensity Score Matching results show that students who started school at the ages of 5, 4, and 3 years had literacy scores between 12.22 and 19.54 points higher than those who began school at the age of 6 years or later.
Keywords
early childhood education, literacy scores, Propensity Score Matching JEL Classiication
Resumo
O objetivo deste trabalho foi identificar os efeitos da Educação Infantil (EI) sobre os escores de alfabetização dos alunos da 2º ano do Ensino Fundamental. Para isso, a Provinha Brasil foi aplicada em Sertãozinho-SP, juntamente com um questionário socioeconômico. Apesar dos problemas de validade externa, a avaliação dos efeitos da EI em um único município é vantajosa, já que se podem estimar os efeitos de um determinado tratamento. Vários estudos ignoram esse fato. Muitas vezes é estimado um efeito médio de vários efeitos de tratamento e não apenas um, já que usam dados de diferentes municípios onde a EI tem diferentes níveis de qualidade. Os resultados por OLS e Propensity Score Matching mostram que alunos que ingressaram com 5, 4, e 3 anos de idade, obtiveram escores de alfabetização cerca de 6% maiores do que os obtidos pelos que ingressaram na escola com 6 anos ou mais.
1. Introduction
With the advent of the Human Capital Theory – especially with the work conducted by Becker (1964) – we observed the consolidation of a theoretical framework where education played a major role in the
determination of poverty, long-term growth, per capita income, and
income inequality within and between countries. Nevertheless, the identification of this relationship between education and income per se was not enough for the implementation of public policies targeted at the improvement of people’s living conditions. In this respect, we have the Economics of Education literature, whose main goal is to identify the most important factors for the development of people’s
skills.1 Among these factors, family background plays a crucial role.
According to these studies, the influence of family on the develop-ment of children’s skills is so important that the room for public sector action seems quite restricted. This perspective is particularly problematic for Brazil, since most adults have a low educational level and live in precarious conditions, which hinders their children’s skill development and perpetuates the cycle of poverty.
Despite the limited scope of public policies aimed at improving edu-cation (in terms of quality and quantity), some factors indirectly related to family are important, as evinced by empirical studies. Improvement of school infrastructure, qualification of teachers and principals, and accountability, in addition to other activities
of-1
fered at schools, are some examples.2,3,4 But another specific factor has been given special attention in the literature: Early Childhood Education (ECE).
In the last two decades, there has been a debate about the effects of early childhood education on future educational outcomes. A con-siderable number of scientific studies find evidence that educational intervention early on during childhood yields significant and long-lasting results on future school performance, and even on adult life
successes. Based on this literature, Cunha et al. (2005) introduce a
model for skill development that reflects the necessity that invest-ments in education be made in early childhood. The model also considers that later investments are important to maintain the skill level developed in early childhood. If investments are not made in early childhood, the ability to acquire knowledge in the future will be impaired, and this cannot be offset by further investments in the future. Therefore, the authors refer to early childhood as the “critical period”.
Low scores by Brazilian students on standardized national exams (Prova Brasil and SAEB –National Basic Education Assessment System) and on standardized international exams (Programme for International Student Assessment – PISA), high grade repetition rates, and high dropout rates before graduating from high school all underscore the need for urgent action by the public sector, and in-tervention in early childhood is an important alternative for Brazilian public education.
Some actions have already been carried on by the Brazilian federal government. To raise children’s educational levels and to encoura-ge early school admission, the minimum time period for comple-ting fundamental education has recently been extended from 8 to 9 years, which decreased the mandatory age for school admission to 6 years. Moreover, an attempt has been made to boost openings at day care centers and preschools and to stimulate school enrollments of children aged 0 to 5 years with the inclusion of early childhood
2
For educational accountability results, see Jacob (2005) and Carnoy & Loeb (2002).
3 For further information about the effects of teachers’ characteristics on school success, see
Rivkin, Hanushek & Kain (2005).
4 For the effects of some variables related to school infrastructure on students’ performance
education in FUNDEB (Fund for the Maintenance and Development
of Basic Education and Teaching Improvement).5 This implies the
guarantee of a minimum common grant value in all states and mu-nicipalities for every child enrolled in an ECE program through high school. Also, there is a congressional bill in discussion that, if made into law, will make these two stages mandatory, as is Fundamental Education school now.
Another measure that is important for the improvement of Brazil’s educational system is to warrant that children be taught to read and write at the appropriate age so that they will be ready to develop the skills that are required throughout their school life. In this
re-gard, the Brazilian Ministry of Education developed Provinha Brasil
in 2007, an exam that assesses the literacy of children aged 6 to 8 years.
This exam is an innovative tool used to measure the development of children’s reading and writing skills, when it is still possible to correct learning deficiencies in a more effective way (at least if we compare it with the possibilities of educational intervention for ol-der children) and to adjust, whenever necessary, the process that precedes the assessment. It can also be used to assess the effects of public policies adopted in response to deficiencies revealed by the exam results.
As Provinha Brasil assesses students at the very beginning of the fundamental education, the results should help formulating educa-tional policies targeted at early childhood education and the first years of fundamental education. This is consistent with the
mo-del put forward by Cunha et al. Students with low literacy scores
on Provinha Brasil might not be able to achieve the potential they would be able to if they had been properly taught to read and write.
5 Before FUNDEB, the federal fund for the transfer of grants for education was
Therefore, interventions should occur when children are still young, i.e., during early childhood education years, so that students in the subsequent cohorts can be better prepared when they are assessed.
The aim of this essay is to empirically determine the relationship be-
be-tween the age at school admission (which also reflects the fact that a student attended or did not attended an ECE program) and a child’s
literacy score based on the results obtained on Provinha Brasil.
Provinha Brasil differs from other tests applied by the Ministry of Education. Its administration and grading requires the active parti-cipation of the local school systems because although the Ministry of Education designs the test and the manuals for its administration and provides the public school systems all over Brazil with the exam and respective manuals in digital format, the exam is administered and graded by the local school systems.
There is neither a national database with the exam results (as the administration of the exam is decentralized), nor a socioeconomic questionnaire to be answered by the children, as occurs with SAEB, since the children who take this exam are too young to answer such a questionnaire in an accurate way. Thus, the solution we found to use the exam results in an econometric analysis was to closely follow
the administration of Provinha Brasil in a Brazilian municipality
where early childhood education was well structured and where we could also administer socioeconomic questionnaires directly to the parents. With these factors in mind, we chose Sertãozinho, a muni-cipality located in the state of São Paulo.
As this is a medium-sized town (with a projection of 109,565 inhabi-tants according to the Brazilian Institute of Geography and Statistics – IBGE – in 2008 and 2,081 students attending the 2nd grade of Fundamental Education school in 2007), it was possible to stan-dardize and inspect universal administration properly. This means that it was also possible to administer the exam in private schools, which allowed us to draw generalized conclusions about the econo-metric results we obtained. Note that the cooperative attitude of private and public schools was also important in the selection of this municipality.
an analysis using Propensity Score Matching like the one we carried
out in this study. Friedlander & Robins (1995) and Michalopoulos et
al. (2004) find evidence that when treatment and control groups be-long to the same geographic location, the matching procedure yields better results. Indeed, if we consider early childhood education an intervention, we cannot use treatment units from various localities because each place has one quality of education and thus we would have a number of different treatments instead of just one.
Finally, this essay is important because it verifies the effectiveness of policies aimed at expanding early childhood education as a way to increase students’ learning. Accordingly, we sought to identify the relationship between early childhood education and the literacy score attained in the 2nd grade of Fundamental Education, using a new assessment tool that measures an especially important set of skills that affects directly the learning capacity in any area of knowledge.
This essay is organized in six sections, including this introduction. Section 2 reviews the literature on the effects of early childhood education on children’s skill development. Section 3 describes Provinha Brasil in more detail, as well as the administration of this exam and the questionnaire in the selected municipality, and also presents some descriptive statistics. Section 4 explains the whys and wherefores of using the Propensity Score Matching as estima-tion method. Secestima-tion 5 describes the estimaestima-tion results and, finally, Section 6 brings the concluding remarks.
2. Literature Review
The High/Scope Perry Preschool Project was an experiment under-taken between 1962 and 1967 which assessed 123 children aged 3 to 4 years (all of whom had a vulnerable socioeconomic background). The treatment consisted of preschool attendance for one shift (mor-ning or afternoon) every day plus a 90-minute weekly home visit for 8 months a year during 2 years. Students usually left the program at the age of 5 years. All of the teachers had a Master’s degree and
the teacher-to-student ratio was 1:6. According to Schweinhart et al.
(1993), the results obtained with this program were quite positive: better performances on skill tests (at 9 and 14 years), better perfor-mances in high school, higher high school completion rates, lower rates of imprisonment (at 27 years), higher salaries (at 27 years), and lesser use of government support (at 27 years).
The Carolina Abecedarian Project was an experiment targeted at children with vulnerable socioeconomic backgrounds and with risk for mental retardation due to the precarious living situations (Currie, 2001). Admission to the experiment occurred at 6 to 13 weeks of age. The treatment consisted of an intensive child care and language development program for 8 hours a day, 5 days a week, 50 weeks a year, from birth to the age of 5 years. After admission to the pro-gram, the treatment group was randomized into two groups, one with a tutor who provided additional instruction at home, and ano-ther one that did not have any additional intervention. The program was concluded up to the age of 8 years. The teacher-to-student ratio was initially 1:3, rising to 1:6 as children grew older. The results were also quite positive. The treatment group had better results on proficiency tests, higher averages of school performance in high school, lower incidences of grade repetition (at 15 years), and lower dropout rates (at 21 years), in addition to lesser need for special education (at 15 years) and higher probability of attending college (at 21 years).
The Early Training Project was a less intensive program, targeted at children aged 4 to 5 years. It consisted of weekly home visits for 1 year, in addition to a single-shift 10-week course for 2 or 3 summers for the treatment group. The treatment was concluded at the age of
6 years. According to Gray et al. (1983), the results showed a
These three experiments share a common feature: they are all small-scale projects. This may have important implications, since it is im-possible to determine the external validity of these experiments. The results of these experiments if they were to be carried out on a large scale cannot be predicted. An important and more com-prehensive experiment is the Head Start program, created by the U.S. government in 1964 and whose target public is composed of children aged 3 to 5 years. Intervention consists of providing health care, meals, snacks, and child care with a higher quality standard than that which low-income parents can provide for their children. Currie & Thomas (1995) conducted a quasi-experimental study of the effects of this program on performances on the Peabody Picture Vocabulary Test (PPVT) and on the probability of never having to repeat a grade. The authors found positive effects on the perfor-mance of white children who participated in this program, whereas at first the results for Afro-American children who participated in the program were not statistically different from those who did not participate. According to the authors, this finding may be linked to the possibility of children from this ethnic group facing more hostile environments and/or fewer opportunities after they finish the program. Thus, in order for the benefits to last longer for Afro-American children, as occurs among white children, more invest-ments, even after the program has finished, should be made in those children enrolled in the program.
Recently, important experiments and quasi-experimental studies have been conducted in Latin America. Schady (2006) carried out a literature survey on the assessment of the impact of investment programs in childhood on cognitive and non-cognitive development.
Gertler & Fernald (2004, apud Schady, 2006), for instance, find
evidence that transfers made by Mexico’s Opportunities Program had a positive impact on motor skills and socioemotional behavior.
Behrman, Parker & Todd (2004, apud Schady, 2006), on the other
hand, gather evidence that these transfers had a positive impact on the probability of children enrolled in the program (aged 0 to 6 years) starting school at an earlier age. They also find evidence of higher promotion rates and higher expected schooling years among children in the treatment group.
Behrman, Cheng & Todd (2004) analyze the results of a Bolivian
(PIDI) using Propensity Score Matching. The program consists of intensive child care, such as a full-time daycare center and nutritio-nal and educationutritio-nal services for children aged between 6 months and 6 years from low-income families. The authors encountered evidence of improved motor and psychosocial skills and improved language acquisition. These results were more significant among children ol-der than 3 years and among those who attended the program for a longer period.
Berlinski et al. (2009) assess the effects of an exogenous variation
in the supply of preschool openings due to a school construction program in Argentinians students’ performance. The authors col-lected evidence that the performances in Spanish and mathematics of cohorts and regions subjected to the treatment (construction of schools) was significantly higher than those of children who were not exposed to this exogenous variation. They also found evidence of positive impacts on non-cognitive skills such as attention, partici-pation, and discipline in the classroom.
In Brazil, a few studies were developed to assess the effects of an intervention (i.e., early childhood education) in early childhood. Curi&Menezes-Filho (2006), for instance, demonstrate that students who attend a preschool or a daycare center are more likely to finish primary education (1st to 4th grades of Fundamental Education), middle school (5th to 8th grades), high school, and college. The au-thors also observe that because individuals attend a daycare center or preschool, they have a higher average of schooling years (measured from the first year of primary education) and higher salaries as well. Finally, the authors find evidence that early school admission has positive effects on math proficiency.
This result regarding the effects of early childhood education in Brazil on students’ performance is corroborated by Felicio & Vasconcellos (2007). The authors use methods for the correction of endogeneity and self-selection bias and find positive and statistically significant effects of preschool attendance on the performance of 4th graders on SAEB. Depending on the region, these effects ranged from 9 to 19%.
Given the evidence of these studies and the model proposed by
stu-dy, it is fundamental to address the problem of liquidity constraints faced by socioeconomically underprivileged families. Following this line of research, the simulations of a general equilibrium model run by Restuccia & Urrutia (2004) confirm the existence of an interge-nerational persistence of earnings and schooling. According to the authors, this problem arises mainly from low investments in the ear-liest childhood stages combined with liquidity constraints by poorer parents. Therefore, children whose parents cannot afford to invest in this initial stage will be condemned to have poorer skills in the subsequent stage and, consequently, lower earnings in adult life.
These statistics are particularly worrying as children with the worst family backgrounds are exactly those who would benefit the most from these programs in early childhood (Currie, 2001). These pro-grams would be useful to minimize adverse family conditions. This way, there would be room for the government to act in order to provide equal opportunities to the children, i.e., to lessen the large disparities observed between the initial skills of economically privi-leged and underpriviprivi-leged groups.
3. Dataset
The database used in this study was built using the results obtained
from the first administration of Provinha Brasil in Sertãozinho,6 in
the state of São Paulo, in May 2008. The exam was administered universally (to public and private education systems) with the aim of assessing literacy measured as the reading and writing skills of students attending the 2nd grade of a 9-year-long elementary school education. The choice of Sertãozinho was based in part on the fact that this town had a not-so-large number of children enrolled in this grade (2,081 students according to the 2007 School Census), thus allowing us to follow up with the administration of the exam and the socioeconomic questionnaires in an appropriate fashion. The presence of a well-structured early childhood education system is
another highlight of this municipality.7 Finally, the availability of pu-
pu-6
Sertãozinho is a countryside town in the state of São Paulo whose major economic activity is the sugarcane industry.
7 By comparing preschool attendance between public and private schools (using data from the
blic and private schools to participate in the study was also decisive for the selection of this municipality.
It should be underscored that Provinha Brasil differs from other
Brazilian exams in some important aspects, besides the fact that it assesses literacy. The first aspect concerns the responsibilities at-tributed to each phase of the exam. For other Brazilian exams
de-veloped by the Ministry of Education (Prova Brasil and SAEB), an
external institution is hired to administer the exams, organize the data, and hand the database over to the Ministry of Education. In
the case of Provinha Brasil, the National Institute for Educational
Studies and Research (INEP) is in charge of devising the material and making it available online so that schools can print it. The use of Provinha Brasil by municipal Departments of Education is optional. Therefore, the administration, grading and publication of results are
locally assigned responsibilities.8
Another difference lies in the assessment method. The score of Provinha Brasil ranges from 217.4 to 665.0 points, as opposed to the
scores of Prova Brasil and SAEB, which range from 0 to 500 points.
As Provinha Brasil aims to assess children’s literacy, its maximum score (665.0) can be achieved by children only when they are com-pletely literate. The other exams, however, focus on determining the skill levels developed by each student during K-12 education, so in practice this means that students rarely achieve the maximum score.
Nevertheless, Provinha Brasil, SAEB, and Prova Brasil are all based
on the Item Response Theory, which allows the results to be placed on the same scale and compared between assessments, between gra-des for the same exam, and over time. Therefore, the results of these exams permit monitoring the quality of education in Brazil.
As stated in the first section of the present study, another aspect
that distinguishes Provinha Brasil from other Brazilian exams is the
absence of questionnaires for children for the collection of relevant information to explain student performance. Children who take part in Provinha Brasil are very young, which does not allow them to answer a questionnaire in a consistent manner.
expenditures for Early Childhood Education per student (based on data from the National Treasury Department), we perceived that Sertãozinho spent on average R$1,761 between 2005 and 2006, while the average expenditure at the national level was R$1,196.
8
For the administration of Provinha Brasil in public schools, the mu-nicipal Departments of Education offer examiners a training course. To carry out this study in Sertãozinho, this was no different. We only followed up the process to guarantee that both the administra-tion and the grading were standardized.
In private schools, we endeavored to reproduce the same standard adopted for public schools. In order to get the schools ready, we re-lied on help from the Board of Education of the State Department of Education. We held a meeting with the coordinators of each school to explain the objective and importance of the study and then we trained the teachers in charge of administering the exam. The trai-ning also included instructions on how to administer the socioeco-nomic questionnaires to be answered by students’ parents or surro-gates, the same guidelines public schools were provided with.
Altogether, 14 public schools and 9 private schools were assessed in Sertãozinho. Among those students enrolled in the 2nd grade
of Fundamental Education, 1,986 took Provinha Brasil, which is a
significant share considering the estimate of approximately 2,100 students enrolled in 2008. The exam was administered on the same day in both the public and private schools. With regard to the ques-tionnaires, they were administered in order to collect information about the socioeconomic characteristics and school history of
stu-dents.9 Parents were asked to fill out the questionnaires at parent
teacher conferences, or the questionnaires were sent to those parents who did not come to the conferences so that they could answer and return them later.
The information obtained this way is more reliable than that
ob-tained from 4th graders on SAEB or Prova Brasil. Out of the 1,986
students who participated in Provinha Brasil in Sertãozinho, 1,850
questionnaires were returned. This represents a loss of only 6.85%,
which is much lower than that of the Prova Brasil questionnaires in
2007, where 18.71% of the 4th graders did not answer any of ques-tions. Regarding the question about the mother’s level of education,
for example, only 1% of the Provinha Brasil questionnaires filled
out by the parents held “I don’t know” as the answer. Conversely, in
9 With respect to school history, we collected information about the age at which children
the questionnaires related to Prova Brasil in 2007, this rate was as high as 30.43%.
Table1 - Literacy Scores and Characteristics of the 2nd Grade Students of Sertãozinho-São Paulo
Variable Obs % withincategory
Mean Score
Std.
Dev. Min Max 1 Literacy Scores (allstudents) 1986 100.0 547,9 77,1 272,1 665,0
2
Entered school at ages 7 or more 22 1.2 523,1 86,6 272,1 621,8 Enteredschoolat age 6 258 14.6 525,3 76,3 328,6 665,0 Enteredschoolat age 5 344 19.6 547,1 74,6 358,5 665,0 Enteredschoolat age 4 535 30.6 558,6 72,5 272,1 665,0 Entered school at ages 3 or less 597 34.0 560,3 77,0 293,3 665,0
3 lives with mother and father 1358 73.5 554,2 75,5 272,1 665,0 doesn’t live with mother and father 486 26.5 540,2 78,1 272,1 665,0
4
MotherwithCollegeEducation 101 5.6 590,0 69,2 385,6 665,0 Mother with High School Education 373 20.3 580,0 69,4 328,6 665,0 Mother with 8th grade completed 372 20.4 556,2 72,4 358,5 665,0 Mother with 4th grade completed 682 37.2 542,4 75,8 328,6 665,0 Mother with out schooling 286 15.5 512,0 73,6 272,1 665,0 Don’t know mother’s educational attainment 19 1.0 518,6 91,3 311,9 665,0
5 Parents don’t go to school meeting 87 4.7 511,0 74,1 358,52 665,04 Parents go to school meeting 1736 95.3 552,8 76,2 272,09 665,04
6 More than three rooms in the house 537 29.2 566,6 73,6 293,29 665,04 Less than three rooms in the house 1309 70.8 543,7 76,8 272,09 665,04
7 Lives with 5 or more persons 818 44.3 538,8 77,8 272,09 665,04 Lives with 4 or less persons 1026 55.7 559,5 74,4 272,09 665,04
8 Child study less than one day a week 140 7.8 512,0 79,4 272,09 665,04 Child study one day or more a week 1642 92.2 555,2 75,0 272,09 665,04
9 Parents see children reading 3/4 days a week 727 40.3 566,5 73,4 358,52 665,04 Parents see it less than 3 days a week 1078 59.7 540,5 77,2 272,09 665,04
10
Parents see their children playing 3/4 days a
week 1523 85.3 551,7 77,2 272,09 665,04 Parents see their children playing < 3 days a
week 265 14.7 545,8 75,5 358,52 665,04
12
White 999 54.5 558,6 77,0 272,09 665,04 Brown 729 39.8 542,6 76,0 272,09 665,04 Asian 12 0.7 557,9 73,6 491,32 665,04 Indian 9 0.5 562,4 78,7 423,96 665,04 Black 84 4.6 516,1 68,4 293,29 665,04
13 There is a quiet place for studying in the house 1576 86.2 555,0 76,2 272,09 665,04 There isn’t a quiet place for studying in the house 251 13.8 522,5 74,3 293,29 665,04
14 There is a computer with access to the internet 381 20.9 586,0 67,1 358,52 665,04 There isn’t a computer with access to the internet 1461 79.1 541,3 76,1 272,09 665,04
15 There are one or more DVD devices in the house 1554 84.9 554,4 76,0 272,09 665,04 There aren’t DVD devices in the house 278 15.1 527,8 77,7 272,09 665,04
16 Family has one or more automobiles 954 53.1 562,5 74,1 311,87 665,04 Family has n’t automobiles 839 46.9 537,1 77,6 272,09 665,04
Source: Questionnaire and Literacy Test (Provinha Brazil) applied to 2nd grade students (K-12
education) of Sertãozinho-São Paulo (and their parents).
According to the descriptive statistics of the variables used in the estimations in the present study (Table 1), the average score on Provinha Brasil in 2008 in Sertãozinho was 547.9 points. According to the Brazilian Ministry of Education, this score is lower than what is desirable in terms of literacy (563.9 points or more). When we assess the results considering children’s age at school admission, we note that the younger the children begin attending school, the higher their literacy score. Recall that after the implementation of the 9-year Fundamental Education, the age for school admission became 6 years. However, we verified that 84.2% of the students from Sertãozinho began attending school at the age of 5 years or less, allowing us to conclude that a significant share of the students had attended an ECE program.
teacher conferences and those whose parents did not do so. Finally, as expected, the higher the mother’s level of education, the higher the student’s score.
Another interesting piece of information concerns the time children devoted to studying and reading. Those who spent more time stu-dying or reading had better scores than those who studied or read less often (less than 3 days). The differences in scores corresponded to 43.2 and 26.0 points, respectively.
As far as the households where children live are concerned, we per-ceived that higher scores were associated with better socioeconomic conditions. Thus, students who lived in a house with a larger number of bedrooms, Internet access, a DVD player and a car, had better scores than those students from socioeconomically underprivileged families. In addition, children whose households had a quiet place for studying had on average a score of 32.5 points higher than those who did not.
4. Estimation Strategy on the Presence of Self-Selection Bias
Average performance (in terms of literacy scores on Provinha
Brasil) of students who started school at an earlier age is certain-ly higher than that of those who entered school later (Table 1). Notwithstanding, there is a consensus agreement in the literature that children with a better family background tend to start school earlier than those with less favorable social conditions. They
self-select to receive treatment S, which in this case refers to earlier
school admission.
Therefore, to obtain consistent estimates of the effects of earlier
school admission on the literacy scores on Provinha Brasil of
chil-dren aged 7 to 8 years, it is necessary to find an estimation strategy that corrects the self-selection bias inherent to the difference in averages between treatment and control groups.
Ideally, the real average effect of treatment on literacy could be known if it were possible to observe the same children in two dis-tinct situations, one in which they had been enrolled in school at
had started school when they were l years old (control designated
by L), where. Thus, the Average Treatment Effect (ATE) could be
obtained by:
�[��� − ���]
(1)
where is the potential result of child i on Provinha Brasil if she
be-longs to treatment S, and is the potential result of this same child
if she belongs to control group.10
Though it is not possible to observe the same individual in these two states simultaneously, one can observe:
�[���|� ]− �[���|�]
(2)
Adding and subtracting counterfactual in this equation, we have
�[� � �
|�]− �[� � �
|�]+ �[� � �
|�]− �[� � �
|�]
(3)
rearranging
�[��� − ���|�] + �[���|�]− �[���|�]
(4)
The first term in (4) is the average treatment effect on treated sub-jects (ATT), and the two subsequent terms stand for the self-selec-tion bias. The interest lies in ATT, but to estimate it, it is necessary to use an estimation method that rules out the self-selection bias. A very frequent solution described in the literature consists of social experiments based on treatment randomization for a selected set of individuals, resulting in a group of treated and untreated (control) subjects. By obtaining a perfect randomization of treated individuals, potential outcomes will be independent from the treatment status,
and the self-selection bias will be null, i.e., �[���|�]− �[���|�]= 0 .
This way, Equation 4 can be rewritten as
11
(5)
10 The result observed can be denoted as , where D is a variable that assumes value equal to 1
if individual i was submitted to treatment, and 0 otherwise.
11
Therefore, with a perfect randomization, it is possible to estimate the ATT by comparing the average outcomes of treated and untrea-ted groups. However, in many cases, it is in the individual’s interest to receive treatment, so then it might be difficult to prevent him/ her from self-selecting to participate in the treatment, especially in social experiments. In the case proposed in the present study, this difficulty is even more evident, as the age at which children are en-rolled in school is determined by the characteristics (or preferences) of their families. Additionally, besides other difficulties related to
the conduct of experiments,12 follow-up time of observation units is
also a hindrance. For example, if treatment refers to school admis-sion at the age of 3 years, while control refers to school admisadmis-sion at a later age, it would take us about 4 years before we could assess the effects of treatment on literacy. This time period is too long, considering the lack of Brazilian studies on the topic and also the urgent necessity for novel studies that may contribute to the recent debate about the mandatory requirement of early childhood educa-tion in Brazil.
In view of these arguments, a more appealing alternative for
esti-mating the effects of early childhood education on Provinha Brasil
literacy scores is the use of non-experimental methods based on the hypothesis of selection according to observable characteristics. This can be done if the following assumption holds true: in a given set of observable characteristics X that determine the selection for treatment, potential outcomes do not depend on treatment status (Rubin, 1977), that is
{���, ��� ⊥ ��}|�� (Unconfoundness Assumption)13
(6)
In fact, this is a strong assumption, but we regard it as valid for the present study.
Nevertheless, note that if there are many covariates, it might be difficult to obtain cells with treatment and control groups in a
suf-12
Duflo, Glennerster& Kremer (2006) describe several setbacks related to the con duct of random social experiments. They highlight the difficulty in avoiding the contamination of the control sample by possible treatment externalities and by social interactions. They also mention that costs may be remarkably high depending on the study design.
13 The notation used in (6) – S for treatment and L for control – is not the same one used by
ficient amount to estimate the treatment effect.14 An alternative proposed by Rosenbaum & Rubin (1983) to circumvent the
dimen-sionality problem is the use of the propensity score (p(Xi)), which
consists of a measure that combines individual characteristics into a single indicator with the same independence property between potential outcomes and treatment assignment:
{ ��
�
, �� �
⊥ �� }
|�(��
) (Propensity Score Unconfoundness Assumption),
(7)
where p(Xi) gives each individual i the probability of receiving
tre-atment based on her characteristics Xi and allows treated and
un-treated individuals with similar indicators to be compared. Another requirement is that observable characteristics should not fully de-termine treatment status, that is
0 < ( = 1 | ) < 1
(8)
In this study, the propensity score was obtained using a probit
re-gression where the dependent variable S
i
is equal to 1 if theindivi-dual is treated, i.e., if she started school at age s, and 0 if she started
school at age 1. Explanatory variables Xi that determine treatment
were chosen based on two procedures: 1) statistical significance; and
2) the “hit or miss” method.15 The first procedure consists in
selec-ting covariates from a larger set whose coefficients are statistically significant. The second one consists in developing an indicator equal to p(Xi)>p, and 0 otherwise, where p(Xi) is the estimated probability
of receiving treatment and p is the percentage of treated individuals.
The larger the number of correct predictions obtained with the
indi-cator developed in relation to dependent variable S
i
which designatestreatment, the better the model.
The subsequent step consists of choosing a matching algorithm based on the predicted Propensity Score Matching (PSM) to estimate
the effect of treatment on treated subjects (ATTX). In line with
Heckman, Ichimura& Todd. (1997),16 the method used as a
bench-mark among the different options available was the Kernel Matching (with a bandwidth of 0.06 and Epanechnikov weighting function). Using PSM has an advantage compared to Ordinary Least Squares
14
See Angrist (1998) for an application of a non-parametric matching.
15 See Breiman et al. (1984; apud Heckman, Ichimura & Todd, 1997). 16
(OLS) conditioned on covariates: it does not suppose a linear additi-ve functional form. For the sake of comparison and robustness check
of the results, ATTX were also estimated by 1) OLS with covariates;
2) OLS with the reciprocal of the Propensity Score as weights;17 3) OLS with the Propensity Score as covariate;18 4) Nearest Neighbor PSM with replacement; 5) Nearest Neighbor PSM without replace-ment; 6) Nearest 10 Neighbors PSM with replacereplace-ment; 7) Radius PSM with caliper of 0.1; 8) Radius PSM with caliper of 0.001; 9) Radius PSM with caliper of 0.0001;19 10) PSM within Strata with 5 strata; and 11) PSM within Strata with 10 strata.20
Concomitantly with the PSM estimations, we ran tests to check whether the covariates were balanced between the treatment and control groups (i.e., to check whether both groups were alike). Two tests proposed by Rosenbaum and Rubin (1985) have such purpose.
The first one consists of a t test to determine the differences
betwe-en the averages of treatmbetwe-ent and control groups for each covariate before and after the matching. The second test is based on the cal-culation of standardized biases of a given covariate, also before and after the matching. This test is obtained by the ratio between the difference of covariate means of the treatment and control groups and the squared root of the average of the variances of the same covariate for the treatment and control groups. A significant reduc-tion in the bias, such that the bias indicator after the matching is lower than 5%, indicates that the explanatory variable was properly
balanced.21
Another way to improve covariate balance was by using a trimming rule. This rule guarantees that observation units outside the com-mon-support region will be excluded, as well as the treatment or control units within the common-support region located on a given
interval (bin) of the histogram with a frequency lower than q%.22
With the results obtained from Provinha Brasil and the answers to
the socioeconomic questionnaires administered to students’ parents,
17
See Imbens (2004).
18 See Imbens (2004). 19
See Dehejia&Wahba (2002) for an application of this method.
20 See Rosenbaum & Rubin (1983) and Dehejia & Wahba (2002).
21 Caliendo & Kopeinig (2005) provide the exact formula for the test. However, the maximum
acceptable percentage of bias after the matching is not precisely known (the authors assert that 5% should suffice). So, it is important to analyze the two tests jointly.
22
nine groups were constructed for PSM implementation, each one of them referring to different treatments and controls. This is well illustrated in Table 2. In Group 1, for instance, children who started school at the age of 5 years or before were the treated subjects, while those who started school at the age of 6 or later were the controls. As previously mentioned, given that the correct age for admission to Fundamental Education in Sertãozinho is 6 years, treatment in Group 1 refers to the attendance of an ECE program for at least 1 year, i.e., having started school at the age of 5 years or earlier, while control refers to not attending an early childhood education program, i.e., having started school at the age of 6 years or later.
From Groups 2 through 7, treatment S is always associated with a specific age at admission lower than the age at admission of children from control group L. All possible combinations based on this rule were employed. Differently, in Group 8, treatment refers to those students who started school at the age of 5 years or earlier in another town, whereas controls are those students who started school at the age of 6 years or later in Sertãozinho. This enabled the identification of the average difference of literacy scores between students who attended an ECE program outside Sertãozinho and those who star-ted Fundamental Education there. This strategy allows assessing the role of the quality of early childhood education on students’ literacy scores.
Table 2 - Description of the Different Groups of Treated and Untreated Units used for the Propensity Score Matching Procedure
Treated Units Untreated Units
Group 1 S: Children who entered school at ages 5 or less L: Children who entered school at ages 6 or more Group 2 S: Children who entered school at ages 3 or less L: Children who entered school at age 6 Group 3 S: Children who entered school at age 4 L: Children who entered school at age 6 Group 4 S: Children who entered school at age 5 L: Children who entered school at age 6 Group 5 S: Children who entered school at ages 3 or less L: Children who entered school at age 5 Group 6 S: Children who entered school at age 4 L: Children who entered school at age 5 Group 7 S: Children who entered school at ages 3 or less L: Children who entered school at age 4 Group 8 S*
: Children who entered school at ages 5 or less in another municipality
L*
: Children who entered school at ages 6 or more
Group 9 S**: Children who entered a private school at ages 5 or less L**: Children who entered a public school at ages 5 or less
* This groups were built to evaluate the quality of the Early Childhood Education of Sertãozinho
by comparing the scores of children who enter school at an early age in this municipality with the scores of children who enter school with the same age some place else.
** This groups were built to evaluate the quality of the Public Early Childhood Education of
Sertãozinho by comparing the scores of children who enter school at an early age in the public school system with the scores of children who enter private schools with the same age.
5. Results
In this section, we present the econometric results obtained to as-sess the effect of early childhood education on children’s literacy. The variables that define the treatment and control groups used to capture this effect refer to the ages at which children were enrolled in school. These variables are more suitable to achieve the intended target, as they allow assessing whether there are striking differen-ces between children who attended an ECE program for 1 year and those who did it for more than 1 year.
First, in Table 3, we present the OLS estimates (with robust stan-dard errors in parenthesis) of the effects of earlier school admission. As proposed by Rubin (1977), conditional on a set of covariates that define treatment, treatment variables are independent from
poten-tial outcomes, and an OLS estimation should produce unbiased es-unbiased
coefficient represents the result that is not conditional on the child’s observable characteristics, and therefore, it should be biased. In this case, we observed a literacy score 31.45 points greater than that ob-tained by students who did not attend an ECE program.
Table 3 - OLS Estimates of the Effects of Early Childhood Education on Provinha Brasil Literacy Scores Conditioning on Covariates
OLS 1 OLS 2 OLS 3 OLS 4 OLS 5 OLS 6
Children who entered school at ages 5 or less
31.45*** 13.65** 14.99***
.. .. ..
(5.00) (5.47) (5.56) Children who entered
school at age 5 .. .. ..
21.98*** 10.81* 12.22* (6.10) (6.45) (6.52) Children who entered
school at age 4 .. .. ..
33.44*** 11.33* 13.16** (5.56) (6.07) (6.19) Children who entered
school at age 3 or less .. .. ..
35.11*** 17.66*** 18.50*** (5.57) (5.97) (6.08) Covariates no yes
(smaller set) yes (full set )
no yes (smaller set)
yes (full set ) R-squared 0,02 0,15 0,18 0,03 0,15 0,18 N 1,756 1,599 1,528 1,756 1,599 1,528
(1) The smaller set of covariates contains dummy variables equal to 1 if the following statement is true (and 0 otherwise): lives with mother and father; a set of dummy variables indicating mother education (College Education completed, High School Education completed, 8thand 4th
grade completed - the omitted comparison group are the children whose mothers have no edu-cation or doesn’t have the 4th grade completed); parents go to school meeting; more than three
rooms in the house; lives with more than 5 persons; child study less than one day a week; parents see their children reading 3 or 4 days a week; parents see their child playing 3 or 4 days a week; male student; black student. (2) Besides the smaller set of covariates, the full set of covariates contains the following additional variables (equal to 1 if the following statement is true and 0 otherwise): there is a quiet place for studying in the house; there is a computer with access to the internet; there are one or more DVD devices in the house; family has one or more automobiles. (3) The omitted category refers to those students who entered school at ages 6 or more.
The magnitudes of dummy coefficients related to the age at which a child started school changed when we inserted the covariates used to obtain the propensity score (smaller set). In the OLS5 specifica-tion, we observed that children who started school at the age of 5, 4,or 3 years presented literacy scores 10.91, 11.33, and 17.66 points higher than those who entered school at the age of 6 years or later, respectively. The same was observed in the OLS6 specification, in which we used more covariates (full set).
The estimates based on Propensity Score Matching are shown in
Table 4.23 As mentioned in the previous section, our main results are
based on Kernel Matching, which are highlighted in gray. The other matching methodologies were implemented to check the robustness of the results.
By analyzing Group 1 (treatment and control), we observed that treatment effect is positive and significant. Children who started school at the age of 5 years or less presented literacy scores 17.33 points higher compared to those who only started school at the age of 6 years or later.
In Group 2, which is composed of children enrolled in school at the age of 3 years or less (treatment group) and children enrolled in school at the age of 6 years (control group), we found a difference of 19.54 points in the literacy scores between the treatment and con-trol groups. If we consider the same treatment individuals and the control units as children who were enrolled in school at the age of 5 years (Group 5), the difference was 10.09 points, slightly lower than in Group 1. However, there was no statistically significant difference in the literacy scores between the children who entered school at the age of 3 or less with those who entered at the age of 4 (Group 7).
On the other hand, if treatment refers to school admission at the age of 4 years, while control refers to school admission at the age of 6 years (Group 3), we observed a positive and significant effect of 18.25 points in the literacy scores of treated children. However, this
23
effect is not perceived in Group 6, in which the treated children are exactly the same students in Group 3, and control subjects are those students enrolled in school at the age of 5 years.
Group 4 refers to students who started school at the age of 5 years (treatment) and those who entered school at the age of 6 years (con-trol). In this case, we observed that treated children had a literacy score 17.89 points higher.
It is important to underscore that we carried out two additional exercises: one to evaluate the effect of a child starting school at the age of 5 years or less (i.e., attended an ECE program) in another mu-nicipality; and another one to measure the effect of a child’s having attended a private school at the same age. First, Group 8 presents the comparison between students who enrolled in school at the age of 5 years or less in another municipality (treatment) and those who enrolled in school at the age of 6 years in Sertãozinho (control). Note that treated children had a literacy score 5.65 points lower, but this difference was not statistically significant. This result indicates that the literacy scores obtained by students in each of these groups are similar. It also indicates the fact that students had early childhood education does not guarantee that they will have higher literacy scores, and thus it favors the choice of a municipality in which early childhood education is well structured.
Group 9 included children admitted to a private school at the age of 5 years or less (treatment), and those who had early childhood education in a public school (control). The results do not show sig-nificant differences in literacy scores between the two groups. This result confirms that early childhood education provided by public schools is as good as that offered at private schools, suggesting that public schools, with the largest number of openings in Sertãozinho, have a good structure and fulfill the purpose of educating rather than just taking care of the children of worker parents (considering that private schools offer appropriate quality standard).
the amount of control units is much larger than treated ones, which is not the case in this paper.
Overall, the results obtained show that children who attended at least 1 year of an ECE program (i.e., enrolled in school at the age of 5 years or less) presented a higher literacy score than those who did not attend this stage. Furthermore, the sooner the student entered the ECE program, compared with those who did not attend this type of educational program at all, the greater the literacy scores. But the returns (in terms of literacy scores) of an additional year of educa-tion at an early age seems to be diminishing, as one can note by the statistically significant difference in mean literacy scores between children who entered school at the ages of 5 and 6 years (the last referring to those that did not enrolled in an ECE program) together with a smaller and statistically significant difference in scores betwe-en those who were betwe-enrolled at the age of 5 years and those who were enrolled at the age of 3 years or less. This leads to the conclusion that 1 year of early childhood education (just before entering the K-12 educational system), offered by a well-structured educational system such as that in Sertãozinho, may be enough for children to be practically literate by the age of 7 or 8 years. This does not mean that there will not be skill differences between those who attended an ECE program for 1 year and those who did it for a longer period of time. In this paper, only a limited set of skills was assessed: those skills that determine literacy. Enrollment in school at the age of 3 years or less, for instance, may contribute to the development of
other important skills not contemplated by Provinha Brasil. Thus,
assessing a broader set of skills may well be consistent with constant or even increasing returns to Early Childhood Education.
The tests described in the “Estimation Strategy Section” were per-formed in order to assess the quality of the matching procedures. In general, as it can be seen in Tables A.1 and A.2 of the appendix, the test results suggest a good matching, such that there are no systema-tic differences on observable characterissystema-tics between the treatment
and control groups.24
24
e E f ec ts o f E ar ly C h ild h oo d E d u ca tio n 123 E st. E co n., S ã o P au lo , vo
l. 42, n.1, p
. 97-128, j
an.-m
ar
. 2012
GROUPS
1 2 3 4 5 6 7 8 9
OLS - Reciprocal of Propensity Score as weights 10.32 (7.65) 18.39*** (6.92) 13.39* (7.88) 15.32** (7.24) 8.79 (5.39) 0.4 (5.60) 7.34 (4.82) -2.62 (16.18) -14.9 (21.54)
OLS with the ropensity Score as covariate
13.33** (5.63) 18.63*** (6.45) 15.01** (6.91) 15.66** (7.04) 7.25 (5.36) 0.41 (5.34) 6.47 (4.70) -8.58 (12.36) 5.96 (7.07) Epanechnikov Kernel band with (0.06)
17.33*** (6.67) 19.54*** (7.44) 18.25** (8.03) 17.89** (7.51) 10.09* (5.69) -1.33 (5.71) 6.47 (4.91) -5.65 (13.49) 7.87 (9.53) Nearest Neighbor with replacement 18.67* (10.16 13.18 (10.69) 5.24 (12.36) 22.38** (11.24) -1.29 (9.09) -3.54 (9.85) 3.46 (8.86) 11.2 (16.22) 7.65 (12.09) Nearest Neighbor with out replacement
-5.98 (7.02) 13.58* (7.26) 12.28* (7.13) 12.93* (7.22) 2.22 (6.01) -0.84 (5.91) 5.17 (4.70) -3.35 (13.95) 4.47 (7.60)
Nearest 10 Neighbor swith replacement 17.6** (7.42) 18.04** (7.73) 21.23** (8.23) 19.26** (7.91) 8.69 (5.93) -1.41 (6.03) 6.52 (5.20 -0.65 (13.40) 2.64 (8.56)
Radius (Caliper δ
= 0.1) 20.76*** (6.23) 20.33*** (7.06) 19.62** (7.75 19.91*** (7.17) 9.85* (5.56) -0.01 (5.60) 6.15 (4.76) -3.04 (13.39) 9.53 (8.70)
Radius (Caliper δ = 00.1) 16.74** (8.29) 21.74** (9.09) 24.68** (10.52) 17.75* (9.05) 3.03 (6.88) 2.21 (6.92) 10.84* (5.53) -6.08 (15.30) 11.13 (10.31)
Radius (Caliper δ = 0.0001) 20.54** (8.52) 15.53 (9.65) 19.89* (10.99) 22.98** (9.81) 6.6 (7.25) 1.98 (7.23) 6.46 (5.82) -9.67 (15.72 2.36 (11.29) Matching with instratum (5 strata)
16.11 (13.44) 18.3 (18.09) 15.44** (7.51) 14.92 (19.33) 15.25 (22.06) 6.35 (11.33) 4.9 (9.26) -5.33 (12.08) 3.25 (24.22) Matching with instratum (10 strata)
14.87 (14.44) 18.55 (25.82) 17.15 (16.20) 13.29 (20.92) 18.05 (28.98) 6.76 (18.37) 10.13 (12.92) -9.7 (47.04) 12.69 (29.71)
(1) The propensity score is estimated using the probit method. The covariates included in the equation are all dummy variables equal to 1 if the following statement is true (and 0 other-wise): lives with mother and father; a set of dummy variables indicating mother education (College Education completed, High School Education completed, 8th grade completed, and 4th grade completed - the omitted comparison group are the children whose mothers have no education or doesn’t have the 4th grade completed); parents go to school meeting; more than
6. Final Remarks
This paper aims to identify the effects of early childhood education
on children’s literacy scores. To do that, we used data from Provinha
Brasil administered in Sertãozinho to students attending the 2nd grade of Fundamental School and from a socioeconomic question-naire answered by the parents.The main contribution of this paper to the literature is to explore this new assessment tool proposed by the Brazilian Ministry of Education. In addition, to our knowledge, there are no studies in the literature, at least not in Brazil, that eva-luate the relationship between earlier school admission and literacy scores.
The results obtained in this paper with Propensity Score Matching (and also with OLS) demonstrate that students who started school at the age of 5 years or less had higher literacy scores than those who started school at the age of 6 or later. In general, students who started school at the ages of 5, 4, and 3 years or less obtained lite-racy scores between 12.22 and 19.54 points higher than those who started school at the age of 6 (or later). The results reasonably sug-gest that the returns in terms of literacy scores are diminishing in relation to the number of years of early childhood education as the effect of attending school at the age of 3 or less (i.e.,3 or more years of Early Childhood Education) is less than 3times greater than that found among students that entered school at the age of 5 years (i.e.,
1 year of Early Childhood Education).
Indeed, there might be a problem with external validity of these results. Although the study used a non-experimental method to esti-mate the treatment effect, it has the same problems as experiments or non-experimental studies with treatment and control groups that belong to one locality. The effect of early childhood education on the literacy of students all over Brazil couldbe even more pronounced. But we believe that the results obtained in this work constitute good guidance for the implementation of public policies.
However, school attendance rates in Brazil are not universalized yet, and expenditures per student are much lower than those verified in developed countries. This stresses that a lot more effort should be put into expanding the coverage and improving the quality of this
early stage of education.
References
Abadie, A; Imbens, G. W. 2006. On the Failure of the Bootstrap for Matching Estimators Issued in June
NBER Technical Working Paper Nº. 325
Albernaz, A.; Ferreira, F. H. G.; Franco, C. 2002. Qualidade e Eqüidade na Educação Fundamental Brasileiro. Pesquisa e PlanejamentoEconômico, v. 33 Nº 3.
Angrist, J., 1998. Estimating the labor market impact of voluntary military service using Social Security data on military applicants. Econometrica 66, 249–88.
Becker, G. 1964. Human Capital: a theoretical and empirical analysis, with special reference to education. New York: NBER/Columbia University Press.
Behrman, J.; Cheng, Y.; Todd; P. 2004. Evaluating Pre-school Programs when Length of Exposure to the Program Varies: A Nonparametric Approach.Review of Economics and Statistics.vol.86, n.1, p.108-32.
Berlinski, S., Galiani, S., Gertler, P. 2009. The effect of pre-primary education on primary school per-formance.Journal of Public Economics, Volume 93, Issues 1-2, February 2009, Pages 219-234.
Caliendo, M.; Kopeinig, S. 2005. Some practical guidance for the implementation of propensity score ma-tching. Bonn, Germany: Institute for the Study of Labor (IZA), (IZA Discussion Papers, 1588)
Carnoy, M.; Loeb, S. 2002. Does external accountability affect student outcomes? A Cross-State Analysis. Educational Evaluation and Policy Analysis, 24(4), 305–331.
Coleman, J. S. et al. 1966. Equality of educational opportunity. Washington: Government Printing
Ofice.
Cunha, F.; Heckman, J.; Lochner, L.; Masterov, D. 2005.Interpreting the Evidence on Life Cycle Skill Formation.NBER Working Paper 11331, Cambridge, MA.
Curi, A., Menezes-Filho, N. 2006. Os efeitos da pré-escola sobre os salários, a escolaridade e a proici -ência escolar. Anais do XXXIV Encontro da ANPEC, Salvador, Bahia, p. 1-21.
Currie, J.; Thomas, D. 1995.Does Head Start Make a Difference? The American Economic Review. vol. 85, n. 3 (Jun., 1995), p. 341-364.
Currie, J. 2001.Early Childhood Education Programs.Journal of Economic Perspectives, vol.15, n.2, p.213-238.
Dehejia, R., and SADEK W. (2002).Propensity Score Matching Methods for Nonexperimental Causal Studies, National Bureau of Economics Research Working Paper Nº. 6829, forthcoming Review
of Economics and Statistics.
Dulo, E.; Glennerster, R.; Kremer, M. 2006.Using Randomization in Development Economics Research:
A Toolkit.MIT Department of Economics Working Paper Nº. 06-36.
Felicio, F.; Fernandes, R. 2005. O Efeito da Qualidade da Escola sobre o Desempenho Escolar: uma avaliação do ensino fundamental no Estado de São Paulo. In: ENCONTRO NACIONAL DE ECONOMIA, 33, 2005, Salvador.
Friedlander, D.; Phil, R. 1995. Evaluating Program Evaluations: New Evidence on Commonly Used Non Experimental Methods. American Economic Review, Vol. 85: 923-937.
Gray, S.W.; Ramsey, B.; Klaus, R. 1983. From 3 to 20: The Early Training Project in As the Twig is Bent…Lasting Effects of Preschool Programs. Consortium for Longitudinal Studies, ed. Hillsdale NJ.: Erlbaum, p. 171-200.
Heckman, J. J.; Ichimura, H.; Todd, P. E, 1997. Matching an Econometric Evaluation Estimator: Evidence fron Evaluating a Job Training Programme, Review of Economic Studies, Blackwell Publishing, vol. 64(4), pages 605-54, October.
Imbens, G. 2004. Nonparametric estimation of average treatment effects under exogeneity: a review.
The Review of Economics and Statistics, 86 (1) fev. 2004.
Jacob, B. A., 2005. Accountability, incentives and behavior: the impact of high-stakes testing in the Chi-cago public Schools, Journal of Public Economics.Elsevier, vol. 89(5-6), pages 761-796, June.
Michalopoulos, C.; Bloom, H.; Hill, C., 2004. Can Propensity Score Methods Match the Findings from a Random Assignment Evaluation of Mandatory Welfare-to-Work Programs? Review of Economics & StatisticsVol.86 (1):156-179.
Restuccia D.; Urrutia C. 2004. Intergenerational Persistence of Earnings: The Role of Early and College Education. The American Economic Review, Vol. 94, Nº. 5 (Dec., 2004), p. 1354-1378.
Rivkin, S. G., E. A. Hanushek, And J. F. Kain, 2005. Variable Deinitions, Data, and Programs for
Teachers, Students, and Academic Achievement. Econometrica Supplementary Material, 73, 2.
Rosenbaum, P., Rubin, D. 1983. The Central Role of the Propensity Score in Observational Studies for Casual Effects. Biometrika. n.70, p.41-55.
Rubin, D. 1977. Assignment to a Treatment group on the basis of a Covariate. Journal of Educational Statistics. n. 2, p.1-26.
APPENDIX
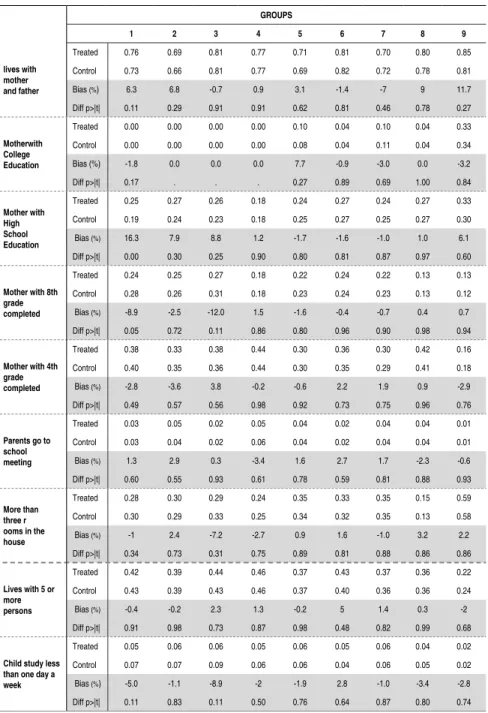
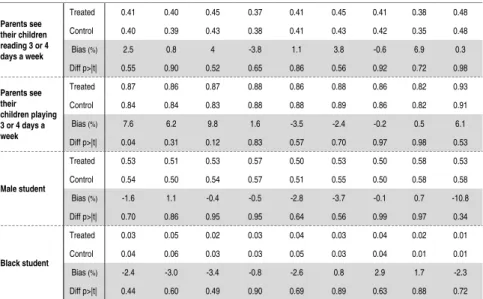
Table A. 1 - Tests of Difference between the Covariates of Treated and Control Groups after Matching
GROUPS
1 2 3 4 5 6 7 8 9
lives with mother and father
Treated 0.76 0.69 0.81 0.77 0.71 0.81 0.70 0.80 0.85
Control 0.73 0.66 0.81 0.77 0.69 0.82 0.72 0.78 0.81
Bias (%) 6.3 6.8 -0.7 0.9 3.1 -1.4 -7 9 11.7
Diff p>|t| 0.11 0.29 0.91 0.91 0.62 0.81 0.46 0.78 0.27
Motherwith College Education
Treated 0.00 0.00 0.00 0.00 0.10 0.04 0.10 0.04 0.33
Control 0.00 0.00 0.00 0.00 0.08 0.04 0.11 0.04 0.34
Bias (%) -1.8 0.0 0.0 0.0 7.7 -0.9 -3.0 0.0 -3.2
Diff p>|t| 0.17 . . . 0.27 0.89 0.69 1.00 0.84
Mother with High School Education
Treated 0.25 0.27 0.26 0.18 0.24 0.27 0.24 0.27 0.33
Control 0.19 0.24 0.23 0.18 0.25 0.27 0.25 0.27 0.30
Bias (%) 16.3 7.9 8.8 1.2 -1.7 -1.6 -1.0 1.0 6.1
Diff p>|t| 0.00 0.30 0.25 0.90 0.80 0.81 0.87 0.97 0.60
Mother with 8th grade completed
Treated 0.24 0.25 0.27 0.18 0.22 0.24 0.22 0.13 0.13
Control 0.28 0.26 0.31 0.18 0.23 0.24 0.23 0.13 0.12
Bias (%) -8.9 -2.5 -12.0 1.5 -1.6 -0.4 -0.7 0.4 0.7
Diff p>|t| 0.05 0.72 0.11 0.86 0.80 0.96 0.90 0.98 0.94
Mother with 4th grade completed
Treated 0.38 0.33 0.38 0.44 0.30 0.36 0.30 0.42 0.16
Control 0.40 0.35 0.36 0.44 0.30 0.35 0.29 0.41 0.18
Bias (%) -2.8 -3.6 3.8 -0.2 -0.6 2.2 1.9 0.9 -2.9
Diff p>|t| 0.49 0.57 0.56 0.98 0.92 0.73 0.75 0.96 0.76
Parents go to school meeting
Treated 0.03 0.05 0.02 0.05 0.04 0.02 0.04 0.04 0.01
Control 0.03 0.04 0.02 0.06 0.04 0.02 0.04 0.04 0.01
Bias (%) 1.3 2.9 0.3 -3.4 1.6 2.7 1.7 -2.3 -0.6
Diff p>|t| 0.60 0.55 0.93 0.61 0.78 0.59 0.81 0.88 0.93
More than three r ooms in the house
Treated 0.28 0.30 0.29 0.24 0.35 0.33 0.35 0.15 0.59
Control 0.30 0.29 0.33 0.25 0.34 0.32 0.35 0.13 0.58
Bias (%) -1 2.4 -7.2 -2.7 0.9 1.6 -1.0 3.2 2.2
Diff p>|t| 0.34 0.73 0.31 0.75 0.89 0.81 0.88 0.86 0.86
Lives with 5 or more persons
Treated 0.42 0.39 0.44 0.46 0.37 0.43 0.37 0.36 0.22
Control 0.43 0.39 0.43 0.46 0.37 0.40 0.36 0.36 0.24
Bias (%) -0.4 -0.2 2.3 1.3 -0.2 5 1.4 0.3 -2
Diff p>|t| 0.91 0.98 0.73 0.87 0.98 0.48 0.82 0.99 0.68
Child study less than one day a week
Treated 0.05 0.06 0.06 0.05 0.06 0.05 0.06 0.04 0.02
Control 0.07 0.07 0.09 0.06 0.06 0.04 0.06 0.05 0.02
Bias (%) -5.0 -1.1 -8.9 -2 -1.9 2.8 -1.0 -3.4 -2.8
Parents see their children reading 3 or 4 days a week
Treated 0.41 0.40 0.45 0.37 0.41 0.45 0.41 0.38 0.48
Control 0.40 0.39 0.43 0.38 0.41 0.43 0.42 0.35 0.48
Bias (%) 2.5 0.8 4 -3.8 1.1 3.8 -0.6 6.9 0.3
Diff p>|t| 0.55 0.90 0.52 0.65 0.86 0.56 0.92 0.72 0.98
Parents see their children playing 3 or 4 days a week
Treated 0.87 0.86 0.87 0.88 0.86 0.88 0.86 0.82 0.93
Control 0.84 0.84 0.83 0.88 0.88 0.89 0.86 0.82 0.91
Bias (%) 7.6 6.2 9.8 1.6 -3.5 -2.4 -0.2 0.5 6.1
Diff p>|t| 0.04 0.31 0.12 0.83 0.57 0.70 0.97 0.98 0.53
Male student
Treated 0.53 0.51 0.53 0.57 0.50 0.53 0.50 0.58 0.53
Control 0.54 0.50 0.54 0.57 0.51 0.55 0.50 0.58 0.58
Bias (%) -1.6 1.1 -0.4 -0.5 -2.8 -3.7 -0.1 0.7 -10.8
Diff p>|t| 0.70 0.86 0.95 0.95 0.64 0.56 0.99 0.97 0.34
Black student
Treated 0.03 0.05 0.02 0.03 0.04 0.03 0.04 0.02 0.01
Control 0.04 0.06 0.03 0.03 0.05 0.03 0.04 0.01 0.01
Bias (%) -2.4 -3.0 -3.4 -0.8 -2.6 0.8 2.9 1.7 -2.3
Diff p>|t| 0.44 0.60 0.49 0.90 0.69 0.89 0.63 0.88 0.72
(1) The dots indicate that all observations were excluded after matching because the treated and control groups could not be balanced. (2) The tests for the covariates of Group 9 include additional variables (equal to 1 if the following statement is true and 0 otherwise) such as: there is a quiet place for studying in the house; there is a computer with access to the internet; there are one or more DVD devices in the house; family has one or more automobiles. All tests show that the covariates are balanced, but we decide to omit the results for these additional variables to save space. The results of the tests can be obtained on request.
Table A. 2 - Treated and Untreated Units On and Off Common Support using Kernel Propensity Score Matching
Treated - On Support
Control - On Support
Treated - Off Support
Control - Off Support
Group 1 (Treated: Age 5 or less) vs (Control: Age 6 or
more) 1231 238 130 0
Group 2 (Treated: Age 3 or less) vs (Control: Age 6) 488 220 1 0
Group 3 (Treated: Age 4) vs (Control: Age 6) 459 220 18 0
Group 4 (Treated: Age 5) vs (Control: Age 6) 303 220 2 0
Group 5 (Treated: Age 3 or less) vs (Control: Age 5) 544 317 2 0
Group 6 (Treated: Age 4) vs (Control: Age 5) 490 317 8 0
Group 7 (Treated: Age 3 or less) vs (Control: Age 4) 545 498 1 0
Group 8 (Treated: Age 5or less another municipality) vs
(Control: Age 6or more in the municipality) 55 238 5 0
Group 9 (Treated: Age 5- private school) vs (Control: Age
5- public school) 164 1081 0 0
Source: Own formulation.