BAR, Curitiba, v. 5, n. 4, art. 4, p. 304-318,
Oct./Dec. 2008
How Informative
How Informative
How Informative
How Informative Are
Are
Are
Are Interest
Interest
Interest
Interest Rate
Rate
Rate
Rate Survey
Survey
Survey----based
Survey
based
based
based
Forecasts?
Forecasts?
Forecasts?
Forecasts?
(1)(1)(1)(1)Mateus A. Feitosa *
E-mail address: [email protected] Universidade Carlos III de Madrid Madrid, Spain.
Benjamin M. Tabak
E-mail address: [email protected]
Banco Central do Brasil; Universidade Católica de Brasília Brasília, DF, Brazil.
A
A
A
A
BSTRACTBSTRACTBSTRACTBSTRACTThis paper studies the information content of survey-based predictions for the Brazilian short-term interest rate. We perform vector autoregression analysis to test for the dynamic relationship between market expectations of interest rates and spot interest rates, and a single regression forecasting approach. Empirical results suggest that surveys may be useful in assessing market expectations (contain relevant information) and in building Central Bank credibility. Within an inflation targeting framework they are crucial in order to receive timely feedback on market sentiment regarding the conduct of monetary policy.
Key words:interest rate forecasting; short-term interest rate, survey-based predictions.
Received 11 December 2007; received in revised form 11 August 2008.
Copyright © 2008 Brazilian Administration Review. All rights reserved, including rights for
translation. Parts of this work may be quoted without prior knowledge on the condition that
the source is identified.
* Corresponding author: Mateus A. Feitosa
IIII
NTRODUCTIONNTRODUCTIONNTRODUCTIONNTRODUCTIONThe dynamics of interest rates have important implications for the economy and their forecasts are necessary for almost all economic activities. Participants in the financial markets require accurate forecasts of interest rates to make economic and financial decisions. These decisions have a heavy influence on aggregate-spending, which, in turn, affects real output and inflation.
In mid-1999, after moving to a floating exchange rate system, Inflation Targeting [IT] was implemented in Brazil. This new monetary framework proved to be fundamental in enhancing transparency and in guiding expectations. Additionally, evidence suggests a positive relationship between inflation targets and the credibility of monetary policy(2).
Other studies (see Minella, 2003) indicate that the Central Bank of Brazil is concerned exclusively with inflation control, thereby avoiding the inflation-output trade-off to enhance short-term production in Brazil. This behavior is an important aspect towards the construction of credibility.
In an IT framework the main goal of the Central Bank is to provide guidance to the economy to anchor expectations regarding the future path of inflation. Therefore, it is crucial to assess market expectations in a timely fashion and check whether they are in line with the conduct of monetary policy.
With the implementation of the IT regime in Brazil the Central Bank of Brazil began to collect information from market participants using surveys, which provide information regarding market expectations on relevant economic and financial variables such as short-term interest rates (SELIC)(3), inflation, exchange rates, GDP growth, and others. However, very little is known regarding the informational content of these survey-based market predictions. If the information content embedded in such predictions is relevant and meaningful then these surveys may be used to assess Central Bank credibility and eventually to calibrate the conduct of monetary policy.
In this paper, we study the dynamic relationship of interest rate based-survey forecasts and spot interest rates. Our results suggest that these market expectations contain useful information regarding the future evolution of interest rates and also that they may be used to gauge Central Bank credibility.
The rest of the paper will be structured as follows: in section Brief Literature Review a brief literature review is presented; section Data Description describes the data used in our estimates; section Methodology contains the methodology; in section Empirical Results we present the empirical results; in section Policy Implications the policy implications are discussed and, finally, section Final Considerations concludes.
B
B
B
B
RIEF RIEF RIEF RIEFL
L
L
L
ITITERATURE ITITERATURE ERATURE ERATURER
R
R
R
EVIEWEVIEWEVIEWEVIEWThe market predictions for the interest rate are an important issue that has been studied for a long time, mainly in the case of the United States financial system. The studies analyze many questions, such as the directional accuracy of the predictions, the rationality of the forecasts and the quality of the methods used to forecast interest rates.
joint hypotheses that forecasters form their expectations rationally and the expectations model of the term structure accurately represents equilibrium yields. However, because a joint hypothesis is tested, the precise cause of rejection cannot be determined.
Dua (1991) tests various hypotheses concerning the determinants of the three, six, and nine-month horizon term premia. He uses data on the three-month Treasury bill rate from the survey conducted by the American Statistical Association in collaboration with the National Bureau of Economic Research. His conclusion is that the term premia vary over time and are negative in some periods. They are heavily influenced by the level of interest rates and cyclical factors in addition to the level of rates. They are also influenced by Government economic policy.
Hafer, Hein and McDonald (1992) compare four different one-quarter ahead forecasts of the three-month U.S. Treasury-bill rate from the 12-year period 1977/88. The forecasts considered are: a prediction from the futures market, a forecast derived from an implicit forward rate calculation, a survey-gathered forecast and a no-change forecast. Their main conclusion is that the futures market rate statistically dominates the other three forecasts. Another comparison of forecasting methods is made by Fauvel, Paquet and Zimmermann (1999), which concludes that despite their apparent simplicity, univariate models tend to do pretty well in practice for forecasting purposes. Similarly, their natural extension to a multivariate setting (i.e. VAR and VECM) constitutes an interesting approach for an integrated treatment of various interest rates, including both their short-term dynamics and any existing long-run relationships.
Kolb and Stekler (1998) examine three issues: is there a general agreement among analysts about the level of interest rates six months in the future; are all the forecasters equally good; are the forecasts valuable to prospective users? They conclude that there is a consensus among financial analysts and there is no significant difference in the ability of these financial analysts to predict short-term interest rates. For the last issue, the conclusion is that the forecasts were not significantly better than random walk forecasts.
Greer (2003) tests the directional accuracy of long-term interest rate forecasts. The tests are applied to the 1-year long-term bond yield issued by The Wall Street Journal’s panel of economic forecasters. The author affirms that the forecasts performed modestly better than flipping a fair coin to predict the direction of change in long-term interest rates. The forecast of movements in long-term interest rates were also studied by Pesando (1981), who concluded that economic agents are not likely to succeed in forecasting short-term movements in long-term interest rates.
Following the results found by previous studies, Mitchell and Pearce (2007) concluded that market forecasts for the Treasury bill rate had a performance very similar to the random walk model, even though they found no evidence that these forecasts are biased.
Overall, we have a poor understanding of the role of market expectations (implied in surveys) on the determination of interest rates. Do forecasts collected in surveys correctly predict changes in future interest rates? How do interest rates survey based forecasts interact with spot interest rates? This paper attempts to answer these questions by focusing on the Brazilian economy, which has had an inflation-targeting framework in operation since 1999, and has collected information on market expectations employing surveys since 2001.
D
D
D
D
ATA ATA ATA ATAD
D
D
D
ESCRIPTIONESCRIPTIONESCRIPTIONESCRIPTIONhas been monitoring market consensus for the most important economic variables since 2001. In this study, we use average forecasts, and our sample has 57 observations.
Table 1 presents the descriptive statistics of the series and it shows that Selic and the forecasts for all time horizons reject the null hypothesis of following a normal distribution, despite the low values of the skewness.
Table 1: Descriptive Statistics
One, Three and Six months are survey-based forecasts for these time periods, respectively.
*,** denote rejection of the null hypothesis with 1% and 5% significance, respectively.
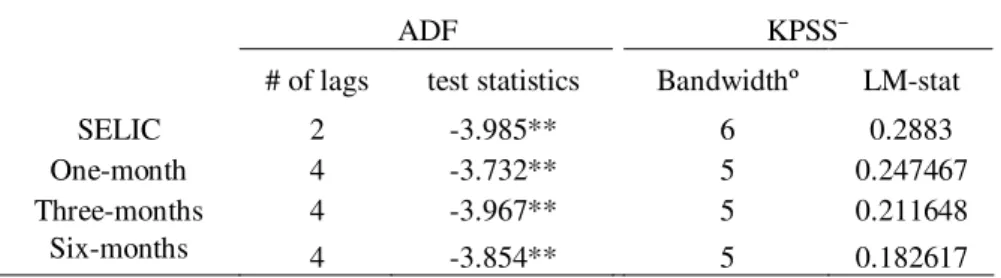
To test if the series are stationary, we employ the Augmented Dickey-Fuller [ADF] and the Kwiatkowski-Phillips-Schmidt-Shin [KPSS] tests. The results for Selic and the average of the Selic forecasts are shown in Table 2 and they indicate that all series are stationary. Consequently, the use of a VAR model is the appropriate method to study the dynamic relationship between these series.
Table 2: ADF and KPSS Unit Root Tests Results for the Average of the Predictions
** denotes rejection of the null hypothesis with 5% significance.
¯ The KPSS unit root test was estimated using the Bartlett Kernel spectral estimation method.
º The bandwidth was selected using the Newet-West bandwidth selection.
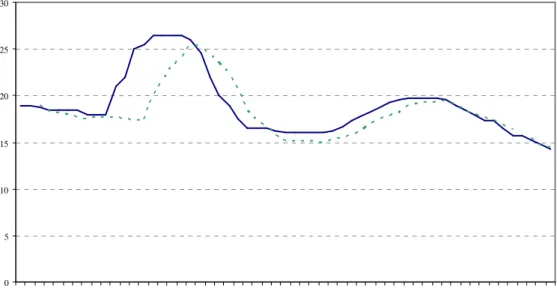
The relationship between Selic and the three-month horizon forecast is presented in Figure 1. It indicates that the movements of the series over time are very similar, and it appears that the forecasts’ movements follow Selic’s changes, indicating that there is an asymmetric relationship between the series.
Selic One month Three month Six month
Mean 19.00877 18.68745 18.05655 17.26463
Std. Dev. 3.254792 3.046300 2.826462 2.400556
Skewness 1.125748 1.148835 1.034043 0.963024
Kurtosis 3.426352 3.570575 3.540068 3.486089
Jarque-Bera 12.47114* 12.84444* 10.46984* 8.878380**
ADF KPSS¯
# of lags test statistics Bandwidthº LM-stat
SELIC 2 -3.985** 6 0.2883
One-month 4 -3.732** 5 0.247467
Three-months 4 -3.967** 5 0.211648
Figure 1: Relationship between Selic and the Three-month-ahead Forecast 0 5 10 15 20 25 30
dec/01 mar/0 jun/02 sep/02 dec/02 mar/0 jun/03 sep/03 dec/03 mar/0 jun/04 sep/04 dec/04 mar/0 jun/05 sep/05 dec/05 mar/0 jun/06
Selic 3-month-ahead forecast
M
M
M
M
ETHODOLOGYETHODOLOGYETHODOLOGYETHODOLOGYMultivariate Approach
Multivariate Approach
Multivariate Approach
Multivariate Approach
The use of a VAR model is a suggestive option, considering that, while the late past cannot perfectly predict future values, it does provide valuable guidance. Furthermore, VAR models have proved to be very useful tools in forecast methods(4). Consequently we treat each variable symmetrically, and we also consider both endogenous. The VAR model used was:
p i t i t i p i i t i
t
Selic
Forec
Selic
1 , 1 , 1 1 , 1 1 (1) p i t i t i p i i t it
Selic
Forec
Forec
1 , 2 , 2 1 , 2 2 (2)where Forec are the survey-based forecasts for the Selic interest rate, p is the lag length used in the model, and 1 and 2 correspond to the errors of each equation, respectively. This approach is similar to the one followed by Mehra (2002), who tested for the US the predictive content of inflation survey-based forecasts.
To determine the appropriate lag length, the Schwarz Information Criterion [SIC] was employed. The SIC, rather than the Akaike Information Criterion, was selected because it imposes a larger penalty for additional coefficients. In the estimation of the VAR model, the SIC suggested 2 lags as the optimal number of lags for the one and three-month-ahead forecasts, and 4 lags for the six-month-ahead forecast. Residual tests were employed with the purpose of verifying serial autocorrelation and heteroscedasticity.
Univariate Approach
Univariate Approach
Univariate Approach
Univariate Approach
In the previous subsection we presented the framework that will be employed to study the dynamic relationship between spot interest rates and survey-based forecasts. We also test for the informational content of survey-based forecasts in a single regression approach.
The regression equation that is employed is:
t j t t j
t
Forec
Selic
, (3)where
Selic
t j is realized Selic at time t + j, andForec
t,t j is the forecast made at time t for period t + j. Rational forecasts would imply = 0 and = 1. If differs from zero then we have risk premiums embedded in survey-based forecasts, and if differs from one forecasts are biased. Values for larger than one imply that forecasts tend to underestimate true realizations of short-term interest rates, while less than one overestimate.Since we are using monthly observations and we have three and six–month forecasts, the residuals of these predictions will have moving average (MA) terms, MA(2) and MA(5), respectively. Therefore, we employ the Newey and West (1987) corrected standard errors to make inference on parameters and .
E
E
E
E
MPIRICAL MPIRICAL MPIRICAL MPIRICALR
R
R
R
ESULTSESULTSESULTSESULTSMultivariate
Multivariate
Multivariate
Multivariate A
A
A
Approach
pproach
pproach
pproach
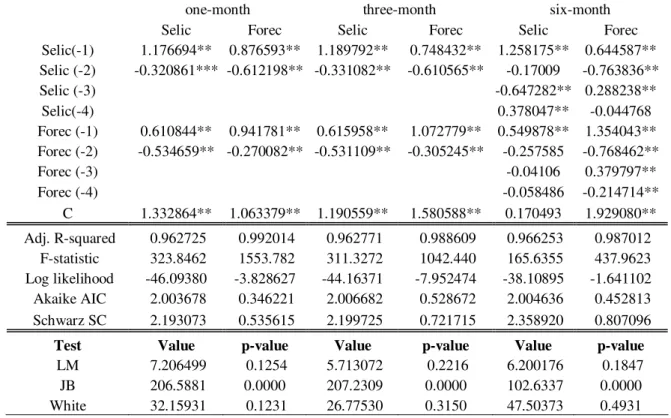
Table 3: Var Results of the Relationship between Selic and the Survey-based Predictions
** and *** indicate the significance at the 5% and 10% level, respectively. The number of lags was selected using The Schwarz information criterion.
LM indicates the lagrangian multiplier test, JB the Jarque-Bera statistics and White the White Heteroscedasticity test.
In the LM test it was used 3, 3 and 5 lags, respectively.
It is worth mentioning that the LM test did not reject the null hypothesis that there is no serial autocorrelation for all time horizons. Additionally, there is a lack of heteroscedasticity, based on the White test and the Jarque-Bera test rejects the null hypothesis that the data follow a normal distribution.
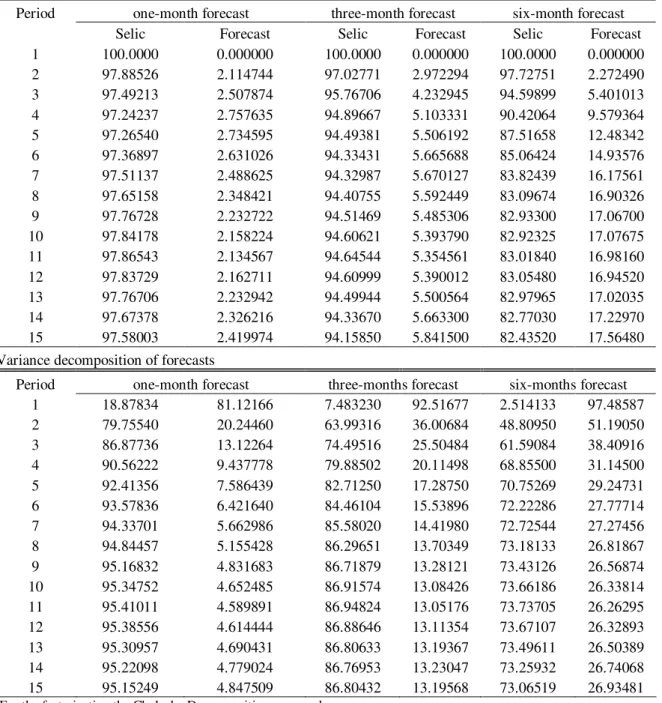
The variance decomposition results are reported in Table 4 for all the time ranges, and they indicate that Selic explains a major part of its error variance. For the relationship between Selic and the one-month-ahead forecast, Selic explains near 100% of its error variance. On the other hand, the forecasts are extremely affected by Selic. The forecast error variance is, in the first periods, explained by its own past values, but as the period increases, forecast error variance is mostly explained by Selic.
one-month three-month six-month
Selic Forec Selic Forec Selic Forec
Selic(-1) 1.176694** 0.876593** 1.189792** 0.748432** 1.258175** 0.644587**
Selic (-2) -0.320861*** -0.612198** -0.331082** -0.610565** -0.17009 -0.763836**
Selic (-3) -0.647282** 0.288238**
Selic(-4) 0.378047** -0.044768
Forec (-1) 0.610844** 0.941781** 0.615958** 1.072779** 0.549878** 1.354043**
Forec (-2) -0.534659** -0.270082** -0.531109** -0.305245** -0.257585 -0.768462**
Forec (-3) -0.04106 0.379797**
Forec (-4) -0.058486 -0.214714**
C 1.332864** 1.063379** 1.190559** 1.580588** 0.170493 1.929080**
Adj. R-squared 0.962725 0.992014 0.962771 0.988609 0.966253 0.987012
F-statistic 323.8462 1553.782 311.3272 1042.440 165.6355 437.9623
Log likelihood -46.09380 -3.828627 -44.16371 -7.952474 -38.10895 -1.641102
Akaike AIC 2.003678 0.346221 2.006682 0.528672 2.004636 0.452813
Schwarz SC 2.193073 0.535615 2.199725 0.721715 2.358920 0.807096
Test Value p-value Value p-value Value p-value
LM 7.206499 0.1254 5.713072 0.2216 6.200176 0.1847
JB 206.5881 0.0000 207.2309 0.0000 102.6337 0.0000
Table 4: Variance Decomposition of Selic and the Average of the One, Three and Six-month Horizon Forecasts (Survey-based)
For the factorization the Cholesky Decomposition was used.
The number of lags used in the VAR were selected using the Schwarz Information Criterion.
Granger causality tests (Granger, 1996) for Selic and the predictions are shown in Table 5, and they indicate that, for shorter time horizons, either the effect of Selic on the survey-based predictions or the effect of forecasts on Selic are significant. Thus, causality is bidirectional: Selic affects the forecasts, and vice-versa. These findings are consistent with the conventional wisdom that the short-term interest rate values in the late past have a big influence on the predictions of the market, and the Central Bank is influenced by several variables, including market predictions on the determination of short-term interest rates. For a longer time horizon (six months), the Granger Causality test suggests that the causality is unidirectional: Selic affects the forecasts, but not the reverse.
Variance decomposition of Selic
Period one-month forecast three-month forecast six-month forecast
Selic Forecast Selic Forecast Selic Forecast
1 100.0000 0.000000 100.0000 0.000000 100.0000 0.000000
2 97.88526 2.114744 97.02771 2.972294 97.72751 2.272490
3 97.49213 2.507874 95.76706 4.232945 94.59899 5.401013
4 97.24237 2.757635 94.89667 5.103331 90.42064 9.579364
5 97.26540 2.734595 94.49381 5.506192 87.51658 12.48342
6 97.36897 2.631026 94.33431 5.665688 85.06424 14.93576
7 97.51137 2.488625 94.32987 5.670127 83.82439 16.17561
8 97.65158 2.348421 94.40755 5.592449 83.09674 16.90326
9 97.76728 2.232722 94.51469 5.485306 82.93300 17.06700
10 97.84178 2.158224 94.60621 5.393790 82.92325 17.07675
11 97.86543 2.134567 94.64544 5.354561 83.01840 16.98160
12 97.83729 2.162711 94.60999 5.390012 83.05480 16.94520
13 97.76706 2.232942 94.49944 5.500564 82.97965 17.02035
14 97.67378 2.326216 94.33670 5.663300 82.77030 17.22970
15 97.58003 2.419974 94.15850 5.841500 82.43520 17.56480
Variance decomposition of forecasts
Period one-month forecast three-months forecast six-months forecast
1 18.87834 81.12166 7.483230 92.51677 2.514133 97.48587
2 79.75540 20.24460 63.99316 36.00684 48.80950 51.19050
3 86.87736 13.12264 74.49516 25.50484 61.59084 38.40916
4 90.56222 9.437778 79.88502 20.11498 68.85500 31.14500
5 92.41356 7.586439 82.71250 17.28750 70.75269 29.24731
6 93.57836 6.421640 84.46104 15.53896 72.22286 27.77714
7 94.33701 5.662986 85.58020 14.41980 72.72544 27.27456
8 94.84457 5.155428 86.29651 13.70349 73.18133 26.81867
9 95.16832 4.831683 86.71879 13.28121 73.43126 26.56874
10 95.34752 4.652485 86.91574 13.08426 73.66186 26.33814
11 95.41011 4.589891 86.94824 13.05176 73.73705 26.26295
12 95.38556 4.614444 86.88646 13.11354 73.67107 26.32893
13 95.30957 4.690431 86.80633 13.19367 73.49611 26.50389
14 95.22098 4.779024 86.76953 13.23047 73.25932 26.74068
Table 5: Granger Causality Test among Selic and the Average of the One, Three and Six-month Horizon Forecasts
2 p-value
Selic One-month Forecast 14.78221 0.0006
One-month forecast Selic 170.9895 0.0000
Selic three-month forecast 14.33598 0.0008
Three-month forecast Selic 111.6262 0.0000
Selic six-month forecast 5.236671 0.2639
Six-months forecast Selic 82.02120 0.0000
Where the symbol stands for Does not Granger-cause.
Univariate Regressions
Univariate Regressions
Univariate Regressions
Univariate Regressions
The results for the regression (equation 3) are reported in Table 6. The market would have a perfect prediction of Selic if the value of the parameter were zero, and the value of the parameter were equal to one. It is interesting to note that the time range has a non neglectable influence over the estimations. The one-month-ahead forecast is very precise ( = 1.009), and as the time horizon increases, both the overestimation and the premium term increase. Additionally, in the six-month horizon forecasts, the joint hypothesis =0 and =1 is rejected with 5% significance, indicating that the market predictions perform poorly for this time horizon. The results also indicate that, for the three and six-month ahead forecast, the market tends to overestimate Selic’s changes.
Table 6: Relationship between Selic and the Average of the One, Three and Six-month Horizon Forecasts
Forecast Adj R2 and
One-month 0.190895 1.009666* 0.875161 0.024678 0.017079 3.462648
(1.215181) (0.073964) [0.8752] [0.8960] [0.1770]
Three-month 2.805520 0.892932* 0.541853 0.923509 0.381726 4.849035***
(2.919394) (0.173295) [0.3366] [0.5367] [0.0885]
Six-month 11.77720** 0.415430 0.062121 6.351435** 4.729635** 9.056505**
(4.673113) (0.268796) [0.0117] [0.0296] [0.0108]
* ** *** denote rejection of the null hypothesis with 1%, 5% and 10% significance, respectively. ' Standard errors are provided in parentheses and p-values in brackets.
" The Newey-West correction for serial correlation was used in the tests
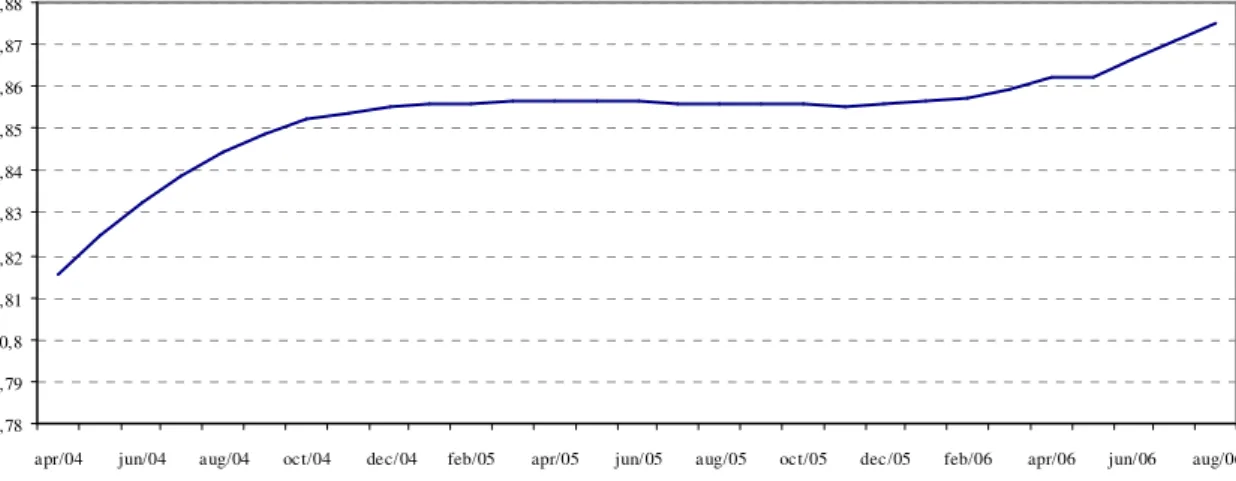
Figure 2: Adjusted R-squared Evolution
0,78 0,79 0,8 0,81 0,82 0,83 0,84 0,85 0,86 0,87 0,88
apr/04 jun/04 aug/04 oct/04 dec/04 feb/05 apr/05 jun/05 aug/05 oct/05 dec/05 feb/06 apr/06 jun/06 aug/06
The R2 variation was calculated(5) in order to compare how the predictable portion of Selic varies as the number of observations increase. The results found for the one, three and six-month horizon were, respectively, 7.1%, 44.7% and 999.19%, indicating that the poor performance of longer time horizon forecasts may be due to lack of a longer time series.
We also estimate equation (3) using the Generalized Method of Moments [GMM], where it was used as an instrument the survey based predictions in the t-1 period. The results reported in table 7 indicate that there is a small qualitative difference between the results found using the OLS and the GMM. The results indicate that the market overestimates Selic in all time horizons, and not only in the 3 and ahead. Additionally, the term premium is more expressive using the GMM. For the 6-month-ahead forecast, the null hypothesis and is rejected with 1% significance.
It is interesting to note that, despite the difference among the results, the adjusted R2 have very similar values, mainly in the shorter time horizons. Finally, the J-statistic reports that the parameters used in the regression are well specified.
Table 7: Estimation Results Using Generalized Method of Moments (GMM)
Forecast Adj R2 and J-stat
One month 1.595732 0.935450* 0.867663 1.473021 0.755600 4.257107 5.78E-31
(1.314787) (0.074259) [0.2249] [0.3847] [0.1190]
Three–month 5.933554 0.723968* 0.515871 3.741862*** 2.517047 6.755358** 1.45E-31
(3.067404) (0.173986) [0.0531] [0.1126] [0.0341]
Six-month 16.06075* 0.171007 0.033745 12.66100* 11.21977* 13.19353* 6.91E-30
(4.513689) (0.247491) [0.0004] [0.0008] [0.0014]
* ** *** denote rejection of the null hypothesis with 1%, 5% and 10% significance, respectively. Standard errors are in parenthesis and p-values in brackets.
The forecast in period t-1 was used as an instrument.
Forecast Comparison
Forecast Comparison
Forecast Comparison
Forecast Comparison
We compared the forecasting accuracy of survey-based expectations of Selic interest rates with econometric models and a Random Walk [RW] model.
As a new measurement is taken in, the oldest measurement of the set is dropped. In the recursive method, each new measurement available is added and none is dropped, which results in a larger sample as time goes by.
To compare the forecasting accuracy, we used the Diebold and Mariano (1995) statistic, which is given by:
)
1
,
0
(
~
N
d
DM
d
(4)
Where
d
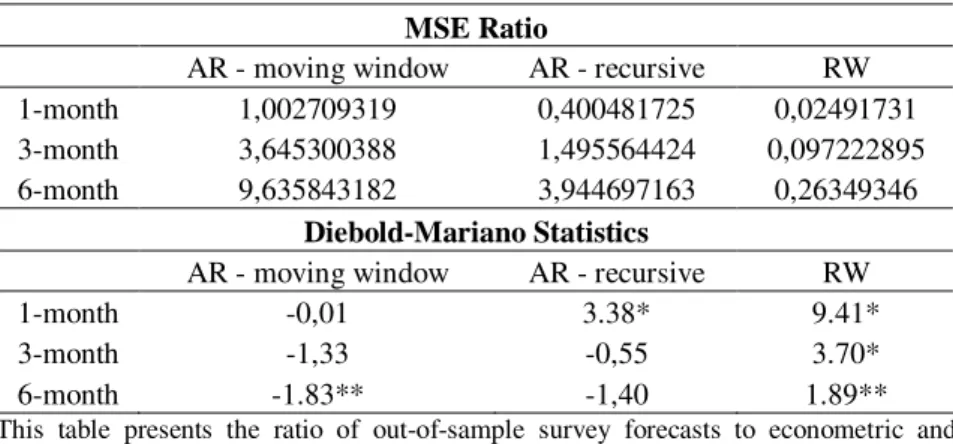
is the sample mean loss differential, which is based on the Mean Squared Errors [MSE] of the forecasts, and d is the variance of the loss differential. The results found are presented in Table 8, and they indicate that the survey-based forecasts perform better than random walk models in all time horizons, while the AR model using the recursive approach performs better than the surveys in longer time horizons. With the moving window approach, the AR performs better in all time horizons. It is worth noting that the time horizon has an important impact on the comparison between these two forecasts.Table 8: Out-of-Sample Forecasts Comparison
MSE Ratio
AR - moving window AR - recursive RW
1-month 1,002709319 0,400481725 0,02491731
3-month 3,645300388 1,495564424 0,097222895
6-month 9,635843182 3,944697163 0,26349346
Diebold-Mariano Statistics
AR - moving window AR - recursive RW
1-month -0,01 3.38* 9.41*
3-month -1,33 -0,55 3.70*
6-month -1.83** -1,40 1.89**
This table presents the ratio of out-of-sample survey forecasts to econometric and random walk models.
The second part presents Diebold and Mariano (1995) statistics for the comparison of forecasts.
* and ** stand for rejection of the null hypothesis that the MSE are equal at 1% and 10% respectively.
P
P
P
P
OLICY OLICY OLICY OLICYIIII
MPLICATIONSMPLICATIONSMPLICATIONSMPLICATIONSOne of the problems of the IT regime is that an evaluation of monetary policy cannot be easily done due to a lag response of inflation to changes in monetary policy. It implies that an analysis of whether inflation is on track cannot be done using realized inflation. This lack of perception affects not only the Central Bank, but also the public and the financial markets, which may lead to adverse consequences for the Central Bank’s credibility.
Amato and Laubach (2000) suggest that forecasts of goal variables, such as interest rates and inflation, can help central banks achieve their goals and make them more accountable to the public. They defend the point of view that forecasts are valuable tools to evaluate monetary policy because of the lag response of goal variables to monetary policy.
Another important reason to follow market expectations is the possibility of inflation scare, i.e., unusual increases in inflation expectations, where macroeconomic stabilization can be affected. Orphanides and Williams (2005) affirm that it is essential to anchor private inflation expectations for successful monetary policy. They conclude that learning-induced inflation expectations perform an important role on financial stability.
This paper shows that the market forecasts for Brazilian short-term interest rates are a valuable referential of whether monetary policy is been correctly conducted. The results state that, mainly in short time horizons, market forecasts are very accurate. Additionally, the Granger causality test reports that market expectations are strongly affected by Selic in all time horizons, suggesting that monetary policy has a strong influence over market expectations. These results support the idea that forecasts can be used as a tool for an evaluation of the Central Bank’s policy.
This influence of monetary policy over survey-base forecasts may be due to an increase in the Central Bank’s credibility. This credibility composes the base of the IT regime.
A central bank is credible if the public believes that the monetary authority will do what it says. For the establishment of credibility, the transparency of monetary policy actions is fundamental. As reported by Lyziak, Mackiewicz and Stanislawska (2007, p. 2), “transparency is a multidimensional phenomenon, which involves not only the issue of the Central Bank releasing adequate information in terms of its quantity and quality, but also a correct interpretation of the released information by the public”. To this end, guiding correct signals back to the financial market can prevent currency crises(6).
Bauer, Eisenbeis, Waggoner and Zha (2006) indicate that since the Federal Open Market Committee [FOMC] began releasing statements after each meeting, forecasts by individuals have become more synchronized, implying a possible increase in FOMC transparency.
Analyzing the specific case of Turkey, Telatar, Telatar and Ratti (2003) and Us (2004) conclude a stronger commitment by the Government and Central Bank with gain of credibility in order to reduce inflation is fundamental.
In 1999, Brazil adopted the Inflation-Targeting [IT] framework. In this case, the success of IT depends on the construction of credibility. Private agents should believe that the central bank will act consistently within the inflation-targeting framework. Tabak (2004) reports that the implementation of the IT framework in Brazil enhanced transparency of the conduct of monetary policy, which in its turn, reduced interest rate surprises along the term structure.
This subject was also studied by Minella, Freitas, Goldfajn and Muinhos (2003). In their paper they analyzed the first three and a half years of the IT system in Brazil. Their results show that the inflation targets have worked as an important coordinator of expectations, the Central Bank has reacted strongly to inflation expectations and that there has been a reduction in the degree of inflation persistence. They conclude that the presence of a central bank committed to the achievement of pre-announced inflation targets has worked as an important coordinator of expectations and generated a more stable inflation scenario.
Bevilacqua, Mesquita and Minella (2007) found evidence that the backward-looking component of market expectations has been ceding ground to the inflation target, evidence that this regime is gaining credibility. They also affirm that the improvement in macroeconomic fundamentals played an important role in the creation of a more predictable environment.
the opposite is not verified. These findings suggest that the lack of influence of the market over the Central Bank’s decisions can be interpreted as a credible monetary policy adopted in Brazil.
Thus, we can conclude that the IT framework adopted in Brazil heavily influenced control of inflation, and the mechanisms used to make the Central Bank’s actions credible were well comprehended and absorbed by the public.
F
F
F
F
INAL INAL INAL INALC
C
C
C
ONSIDERATIONSONSIDERATIONSONSIDERATIONSONSIDERATIONSThis paper analyzes the market predictions for the Brazilian short-term interest rate. For this purpose, we used a VAR model between Selic and the survey-based predictions in the one, three and six-month horizon, and regressions among the predictions and Selic were estimated. We utilized predictions of different time horizons to determine whether time has influence over the predictions or not.
Returning to the questions initially formulated, we can conclude that the interaction between Selic and the forecasts vary over time. For shorter time horizons, there is a mutual influence among the series: the Central Bank takes the market’s forecasts into consideration, and the market is strongly influenced by Selic. For a longer time horizon, the influence of Selic over the market is still strong, but the role of the market’s predictions on the decisions of the Central Bank decreases.
The high influence of Selic over market forecasts indicates that market agents seem to take the Central Bank’s reports into consideration. This result suggests that forecasts for Brazilian short-term interest rates can be used as a tool for an evaluation of monetary policy. The important role of forecasts on monetary policy may be due to increased Central Bank credibility, that since the implementation of the IT regime in Brazil, in 1999, it has adopted a transparent policy, aiming to reduce the market’s doubts concerning monetary policy.
When analyzing the accuracy of the survey-based predictions, we can affirm that for all time horizons the market predicts correctly the direction of changes of Selic, but these forecasts are accurate only in short time intervals. For the longer time horizon studied (6 months), the joint hypothesis that the term premium ( ) is equal to zero and the parameter is equal to one is rejected with 5% significance. Thus, we can conclude that the predictions tend to get less precise as the time range increases.
An interesting extension of this paper would be to analyze how the IT regime affects the markets’ predictions for other variables, such as GDP and the price index. Thus, the credibility of monetary policy would be tested in an expanded structure.
Another useful future research is to investigate the role of macroeconomic variables, including output growth and money growth, on the determination of the short-term interest rate.
N
N
N
N
OTESOTES OTESOTES1 Benjamin M. Tabak gratefully acknowledges financial support from CNPQ Foundation. The opinions expressed in this paper are those of the authors and do not necessarily reflect those of Central Bank of Brazil.
2
3
In Brazil, the short-term interest rate, Selic, is determined by the Monetary Policy Committee (COPOM). Selic is the Brazilian shot-term interest rate because it is used in inter-bank operations and, therefore, determines the whole spectrum of long-term interest rates. Inasmuch, Selic is considered a floor for the interests paid by banks in the deposits, and, based on it, banks decide how much they will charge in loans for companies and individuals. Selic is a system for custody issued by the Brazilian Treasury and the Central Bank. By means of this system, the monetary authorities set the interest rate for secondary market benchmark.
4
See Lo, W-C., Fung, H-G., & Morse, J. N. (1995). A note on Euroyen and domestic yen interest rates. Journal of Banking and Finance, 19(7), 1309-1321, Webb, R. H. (1984). Vector autoregression as a tool for forecast evaluation. Economic Review, (Q I), 3-11, Stock, J. H., & Watson, M. W. (2001). Vector autoregressions. The Journal of Economic Perspective, 15(4), 101-115, and Engsted, T. (1995). Does the long-term interest rate predict future inflation? A multi-country analysis.
The Review of Economics and Statistics, 77(1), 42-54 for examples of the use of VAR models in forecasts.
5
The equation
2
R
R
R
-R
R
beginning 2 last 2
beginning 2 last 2 2
was used for estimate the adjusted R2 variation.
6
See Lam, M. C-H. (2001). Herd behaviour and interest rate defence. Journal of Policy Modeling, 24(2), 181-193 for an analysis of government policies to the prevention of crises.
R
R
R
R
EFERENCESEFERENCESEFERENCESEFERENCESAmato, J. D., & Laubach, T. (2000). The role of forecasts in monetary policy. Economic Review, (Q II), 21-32.
Baghestani, H. (2006). An evaluation of the professional forecasts of U.S. long-term interest rates.
Review of Financial Economics, 15(2), 177-191.
Bauer, A., Eisenbeis, R. A., Waggoner, D. F., & Zha, T. (2006). Transparency, expectations, and forecasts. Economic Review, (Q I), 1-25.
Bernanke, B., & Woodford, M. (1997). Inflation forecasts and monetary policy. Journal of Money
Credit and Banking, 29(4), 653-684.
Bevilacqua, A. S., Mesquita, M., & Minella, A. (2007). Brazil: taming inflation expectaions [Working Paper Series 129], Central Bank of Brazil. Brasília, DF, Brazil.
Diebold, F., & Mariano, R., (1995). Comparing predictive accuracy. Journal of Business and Economic Statistics, 13(3), 253-263.
Dua, P. (1991). Survey evidence on the term structure of interest rates. Journal of Economics and Business, 4(2), 133-142.
Fauvel, Y., Paquet, A., & Zimmermann, C. (1999). A survey on interest rate forecasting [Working Paper nº 1999-087]. Université du Québec à Montréal.Montréal, Québec, Canada.
Friedman, B. M. (1980). Survey evidenceon the ‘rationality’ of interest rate expectations. Journal of
Monetary Economics, 6(4), 453-465.
Granger, C. W. J. (1996). Can we improve the perceived quality of economic forecasts? Journal of
Applied Econometrics, 11(5), 455-473
Greer, M. (2003). Directional accuracy tests of long-term interest rate forecast. Journal of Forecasting, 19(2), 291-298.
Jones V, D. S., & Roley, V. (1983). Rational expectations and the expectations model of the term structure: A test using weekly data. Journal of Monetary Economics, 12(3), 453-465.
Kolb, R. A., & Stekler, H. O. (1998). How well do analysts forecast interest rates? Journal of Forecasting, 15(5), 385-394.
Lyziak, T., Mackiewicz, J., & Stanislawska, E. (2007). Central bank transparency and credibility: the case of Poland, 1998–2004. European Journal of Political Economy, 23(1), 67-87.
Mehra, Y. P. (2002). Survey measures of expected inflation: revisiting the issues of predictive content and rationality. Economic Quaterly, 88(3), 17-36.
Minella, A. (2003). Monetary policy and inflation in Brazil (1975-2000): a VAR estimation. Revista
Brasileira de Economia, 57(3), 605-635.
Minella, A., Freitas, P. S. de, Goldfajn, I., & Muinhos, M. K. (2003). Inflation targeting in Brazil: constructing credibility under exchange rate volatility. Journal of International Money and Finance, 22(7), 1015-1040.
Mishkin, S. F. (1981). Are market forecasts rational? The American Economic Review, 71(3), 295-306.
Mitchell, K., & Pearce D. K. (2007). Professional forecasts of interest rates and exchange rates: evidence from the Wall Street Journal’s panel of economists. Journal of Macroeconomic, 29(4), 840-854.
Newey, W. K., & West, K. D. (1987). A simple, positive semi-definite, heteroskedasticity and autocorrelation consistent covariance matrix. Econometrica, 55(3), 703-708.
Orphanides, A., & Williams, J. C. (2005). Inflation scares and forecast-based monetary policy. Review of Economic Dynamics, 8(2), 498-527.
Pesando, J. E. (1981). On forecasting interest rates: An efficient markets perspective. Journal of
Monetary Economics, 8(3), 305-318.
Tabak, B. M. (2004).A note on the effects of monetary policy surprises on the Brazilian term structure of interest rates. Journal of Policy Modeling,26(3), 283-287.
Telatar, E., Telatar, F., & Ratti, R. A. (2003).On the predictive power of the term structure of interest rates for future inflation changes in the presence of political instability: the Turkish economy.
Journal of Policy Modeling, 25(9), 931-946.