BRAZILIAN JOURNAL OF OCEANOGRAPHY, 55(4):281-292, 2007
ICHTHYOFAUNA COMPOSITION ACROSS A WAVE - ENERGY GRADIENT ON
SOUTHERN BRAZIL BEACHES
Fabiana Cézar Félix1*, Henry Louis Spach2, Pietro Simon Moro3, Carlos Werner Hackradt4,
Guilherme Mac Laren Nogueira de Queiroz4 and Maurício Hostim-Silva5 1Universidade Federal do Paraná,
Departamento de Zoologia, Pós-Graduação em Zoologia, (P.O. Box 19020, 81531-980 Curitiba, PR, Brasil)
*E-mail: [email protected]
2Universidade Federal do Paraná
Centro de Estudos do Mar
(Av. Beira Mar s/n, 83255-000, P.O. Box: 50002, Pontal do Paraná, PR, Brasil)
3Universidade Federal do Ceará
(Av. da Universidade, 2853, 60020-181 Fortaleza, CE, Brasil)
4Universidade Federal do Paraná
Setor de Ciências Biológicas, Pós-Graduação em Ecologia e Conservação, (P. O. Box 19031, 81531-980 Curitiba, PR, Brasil)
5Universidade Vale do Itajaí
(Rua Uruguai 458, 88302-202 Itajaí, SC, Brasil)
A
BSTRACTWave action in sandy beach surf zones and its influence on species composition were evaluated at three sites at Pontal do Paraná, Paraná State, between June/2004 and May/2005. At each sampling site, five hauls were performed monthly using a 15 m long, 2.6 m height beach seine with a 5 mm mesh-size. Samplings were carried out at low water spring tides during daylight. A total of 26,866 fishes were collected, amounting to a total weight of 84,838 kg, which were distributed amongst 28 families and 63 taxa. Multi- and univariated methods used indicated that sheltered and moderately exposed beach samples had similar ichthyofaunal composition, being clupeids and engraulids the most abundant at these beaches. Although abiotic factors differed significantly between beaches, depth appears to exert the major influence on ichthyofauna structure by providing less turbulent waters which might have permitted shoals maintenance. Conversely, exposed beach samples differed largely from the other beaches and were influenced primarily by wave height and salinity variables. These were displayed at CCA diagram and through the occurrence of P. virginicus, M. littoralis and T. goodei.
R
ESUMOA ação das ondas em zonas de arrebentação de praias arenosas e sua influência na composição de espécies foram avaliadas em três praias em Pontal do Paraná, Paraná, entre junho/2004 e maio/2005. Cinco arrastos mensais foram realizados em cada local amostral durante maré de sizígia em período diurno, usando uma rede de arrasto de 15 m de comprimento, 2,6 m de altura e malha de 5 mm. Um total de 26.866 peixes foram coletados pesando aproximadamente 84 kg e distribuídos em 28 famílias e 63 taxa. Métodos multi- e univariados utilizados indicaram que as amostras das praias protegidas e moderadas foram semelhantes em composição da ictiofauna, sendo os clupeídeos e engraulídeos os mais abundantes nestas praias. Por mais que os fatores abióticos sejam diferentes entre as praias, a profundidade parece exercer maior influência na estruturação da ictiofauna provendo águas menos turbulentas, o que pode ter permitido a manutenção de cardumes. Em tendência oposta, as amostras da praia exposta diferem em grande parte das outras sendo influenciada principalmente pelas variáveis altura de onda e salinidade mostradas no diagrama CCA e pela ocorrência de P. virginicus, M. littoralis e T. goodei.
I
NTRODUCTIONSand beach surf zones represent narrow, though expansive, transitional habitat lying between sea and land (ROMER, 1990). These zones are important areas for feeding, growing and reproduction of many marine species (GIBSON, 1973; LASIAK, 1984a, 1986; CLARK et al., 1996) and economically important fish such as many species of carangid, scianid and clupeid families (GAELZER; ZALMON, 2003). Although frequented by a wide variety of species, these shallow habitats are characterized by few numerically dominant species (McFARLAND, 1963; LASIAK, 1984b; BENNET, 1989) that are small in size and predominantly juveniles (MODDE, 1980; ROBERTSON; LENANTON, 1984; SANTOS; NASH, 1995).
Ichthyofaunal assemblages are expected to change locally in response to many environmental parameters such as temperature, salinity and wave exposure (ROMER, 1990). According to Clark (1997), wave exposure is one of the main factors affecting the community structure of fish and invertebrates of sandy beach environments. Previous studies have indicated that increase in levels of exposure are generally followed by reduction of abundance and diversity index, whilst improving in dominance (DYE et al., 1981; DEXTER, 1984; CLARK, 1997; WATT-PRINGLE ; STRYDOM, 2003).
The objective of this study is to compare the ichthyofauna composition, abundance and community descriptors (diversity, richness and evenness) in three different sites at Pontal do Sul, Paraná State, Brazil, which have distinct wave exposure gradients (sheltered, moderately and exposed). In addition, the influence of the environmental variables on the local fish community structure throughout the year was also verified. To investigate these questions the following hypotheses were formulated: Are there any changes in community structure between the beaches studied and amongst the months? Are there any relationships between changes in community structure and environmental variables?
M
ATERIALS ANDM
ETHODSStudy Site
Paraná coast consists of 98 km of uninterrupted sandy beaches limited at north and south by two important estuaries: Paranaguá Bay, and Guaratuba Bay, respectively. The studied beaches are located next to the entrance of Paranaguá Bay, across a wave energy gradient conferred by submerged bars and channels formed by tidal currents and drainage of the harbor channel.
The sheltered beach, Estuarina, is the closest to the bay entrance and located southwesterly of Mel Island (Fig. 1), which acts as a barrier from north and east winds. Village Beach is not influenced by neither Mel Island nor submerged troughs and ridges, and therefore, is an exposed beach. Pontal Beach, on the other hand, has moderate levels of wave energy owing to its intermediate position (Fig. 1). Approximately 1 km separates adjacent beaches from one another and according to Godefroid et al. (1997), the beaches are classified as dissipative in accordance to the morphodynamic scale of Wright and Short (1984). Mean sediment grain size increases southward (BIGARELLA et al., 1969) toward the most exposed beaches, but at the studied sites it remains homogeneous (GODEFROID et al., 1997). The beaches are microtidal (tidal range < 1.5 m) with two ebb tides per day.
The innermost beach, Estuarina (25º33’979’’S 48º21’119’’W), has the narrowest surf zone wherein tides are the principal source of power, and is classified as a estuarine beach (BORZONE et al., 2003). Moreover, a steep slope profile created by deep navigable channels is present. Pontal Beach (25º34’769’’S 48º21’018’’W) is located outside the protection provided by the Mel Island, however, troughs and ridges formed by tidal currents have a great influence at the surf zone dynamics. As waves encounter these submerged obstacles, their energy is lost and they are broken several times up to the beach face. At low water of spring tides, extensive pools are formed parallel to the beach line, separated from one another by ridges, but with lateral communication to the sea. From the three existing troughs, the first is the shallowest (approximately 0.5–0.9 m), with depth increasing gradually seaward. The second trough location where most seine hauls took place, has an average depth of 1.5m, and the third through was not assessed. Finally, the largest wave heights and consequently the highest exposure were found in Village (25º35’354’’S-48º22’025’’W), the most external beach. This surf zone is longer than that at Estuarina but no longer when compared to that in Pontal, which is characterized by multiple breaking waves formed by the submarine profile, as described above.
Sampling Methods
conducted by two people, one on each end of the net. The net was taken in the direction of the surf zone by one of them to a depth of 1.5 m, approximately between 10 and 30 m in the sea, and were pulled up simultaneously and parallel to the beach face.
All fish collected were identified to species following Fischer, 1978; Figueiredo and Menezes, 1978; Figueiredo and Menezes, 1980; Menezes and Figueiredo, 1980; Menezes and Figueiredo, 1985; Barletta and Corrêa, 1992; Figueiredo and Menezes, 2000.These were then weighted (g) and measured to the nearest 1 mm (total length and standard length), except when samples were very large. In these occasions, measurements were restricted to a sub sample of 30 individuals per species. The excess was weighted, counted and incorporated as weight and number counts. In addition, sex (male, female or non
identified) and maturity stages were documented for the sub- sample trough direct observation, according to macroscopic scale of gonadal maturation of Vazzoler (1981).
To verify the environmental influence on the faunal composition and structure, surf zone water temperature (°C), salinity (Practical Salinity Scale – PSS), wave height (m) and period (s) were measured at each site monthly (since no differences between successive hauls were observed). Wave height was taken with a 2 m ruler and obtained from the metric difference between crest and sea level of the largest waves breaking on the surf zone. Wave period was measured from the duration (in sec) of 11 successive breaking waves and dividing it by 10 to obtain the period of a single wave. This procedure was applied twice to produce an average.
Fig. 1. Location of the three sampling sites (1-Estuarina, 2-Pontal and 3-Village) next to Paranaguá Bay Estuarine Complex, Paraná, South Brazil.
Data Analysis
All environmental and biological data were tested for normality (normal probability plot and Kolmogorov-Smirnov test) and homogeneity of variances (Bartlett Chi-square test) (SOKAL; ROHLF, 1995). Number of individuals and weight were log-transformed, while number of species was square root transformed in order to meet the assumptions of ANOVA. Two-way ANOVA’s were carried out to test the effects of factors “month” and “site” on the following variables: the community parameters (Shannon-Wiener diversity and Pielou evenness indexes), abundance, weight and species richness. For the significant results (p < 0.05), Tukey post-hoc tests were conducted to evaluate which means differred from each other. As the results of post-hoc tests are difficult to visualize, due to high level interactions, these are not displayed. Interpretation of ANOVA results were focused on general differences observed at the interactions and on the main differences found in the analyses performed on isolated factors.
The weight abundance data (square root transformed) were converted into a matrix of similarities between all months and sites, using the Bray-Curtis similarity coefficient. Results are displayed on a dendrogram using group average linking (Cluster), and an ordination plot, generated by a non-metric multidimensional scaling (MDS) procedure (CLARKE; WARWICK, 1994). To evaluate the level of correlation to which environmental variables interferred in the samples grouping, a Canonical Correspondence Analysis (CCA) was performed. The matrix included weight abundance of all species collected at each site during the 12 months (log transformed) as well as environmental values of temperature, salinity, and wave height and period.
For operational purposes some abbreviations were adopted to distinguished between two different species: Mugil sp.1 is a species of Mugil genus that cannot be identified since scales were absent on individuals analyzed; Mugil sp.2 is the code to Mugil gaimardianus species name that no longerexists; and
S. brasiliensis 1 is Sardinella brasiliensis to be distinguished from Scomberomorus brasiliensis
abbreviation, S. brasiliensis 2 (ICZN, 2000).
R
ESULTSEnvironmental Data
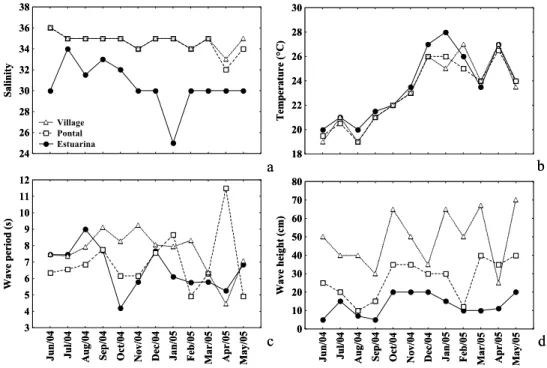
While salinity was lowest at Estuarina beach, the variation was also the largest recorded during the study period. On the remainder of the beaches, salinity values showed similar fluctuation pattern along the year (Fig. 2a). Water temperature did
not change among sites but varied along the months, following a seasonal pattern. Highest values occurred between December/04-February/05 and lowest in June and August/04 (Fig. 2b). Morphodynamic parameters did not display any seasonal pattern. Highest and lowest wave period values oscillated across sampling sites, but nearly always, minimum values were recorded in Estuarina or Pontal Beach (Fig. 2c). Moreover, wave height was spatially distinct, with smallest values at Estuarina, intermediate at Pontal, and highest at Village (Fig. 2d).
Species Composition
A total of 26,866 fish from 63 taxa and 28 families was collected in the 180 seine net hauls carried out throughout the year. Harengula clupeola
(42.10%), Sardinella brasiliensis (14.52%),
Trachinotus carolinus (11.76%), Anchoa lyolepis
(10.85%) and Odontesthes bonariensis (8.47%) dominated numerically the catches; overall, accounting for nearly 90% of the total catch. With regard to biomass, H. clupeola (41%), T. carolinus
and O. bonariensis remained the most important species captured, representing 54.5% of the 84,838 kg of fish collected.
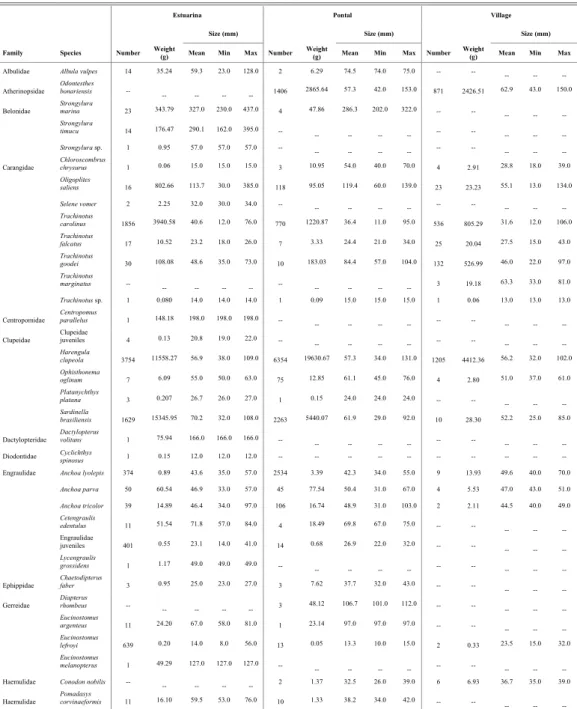
Species composition, abundance and structure of fish in seine net hauls at the three sampling sites are presented in Table 1. The trend in total abundance recorded per site displayed a clear convex profile, where more individuals were caught at the moderately exposed site than at the sheltered and exposed ones (Tab. 1). However, in terms of species richness and weight a linear increase occurred from Village (28 species and 11 kg) to Pontal (40 species and 35 kg) and finally to Estuarina (52 species and 37 kg) (Table 1).
Spatial Variation
The beaches studied presented 19 taxa in common. Exclusively from Estuarina 17 species were found, whilst at Pontal and Village, only 5 and 3 exclusive species were observed, respectively (Table 1). Some species have shown distinct occupation patterns across the sites sampled. Following the abundance trends of higher fish catches at moderate wave-energy levels, were O. bonariensis, H. clupeola, S. brasiliensis and A. lyolepis, usually found in shoals. Furthermore, T. carolinus, Engraulidae juveniles, E. lefroyi and Mugil sp. 1, also commonly found in aggregates, showed higher total catches at low energy levels; and T. goodei, P. virginicus and M. littoralis
0
4
0
4 04
0
4
0
4 04
0
4 05
0
5 05 05
0 5 24 26 28 30 32 34 36 38 Salinity Village Pontal Estuarina 0
4 04 04 04
0
4 04 04 05 05 05 05 05
18 20 22 24 26 28 30 Temperature ( °C) Jun/ 04 Ju l/04 Aug/04 Sep/ 04 Oct/ 0 4 Nov/04 Dec/ 04
Jan/05 Feb/05 Mar/05 Apr/05 May/05
3 4 5 6 7 8 9 10 11 12
Wave period (s)
Jun/ 04 Ju l/04 Aug/04 Se p/ 04
Oct/04 Nov/04 Dec/04 Jan/05 Fe
b/05 Mar/05 Apr /05 May/05 0 10 20 30 40 50 60 70 80
Wave height (cm)
a
b
c
d
0
4
0
4 04
0
4
0
4 04
0
4 05
0
5 05 05
0 5 24 26 28 30 32 34 36 38 Salinity Village Pontal Estuarina 0
4 04 04 04
0
4 04 04 05 05 05 05 05
18 20 22 24 26 28 30 Temperature ( °C) Jun/ 04 Ju l/04 Aug/04 Sep/ 04 Oct/ 0 4 Nov/04 Dec/ 04
Jan/05 Feb/05 Mar/05 Apr/05 May/05
3 4 5 6 7 8 9 10 11 12
Wave period (s)
Jun/ 04 Ju l/04 Aug/04 Se p/ 04
Oct/04 Nov/04 Dec/04 Jan/05 Fe
b/05 Mar/05 Apr /05 May/05 0 10 20 30 40 50 60 70 80
Wave height (cm)
a
b
c
d
Fig. 2. Monthly variation of environmental variables recorded at sampling sites Estuarina (sheltered), Pontal (moderated) and Village (exposed) in Pontal do Paraná, Paraná, South Brazil. a) salinity, b) temperature, c) wave height and d) wave period.
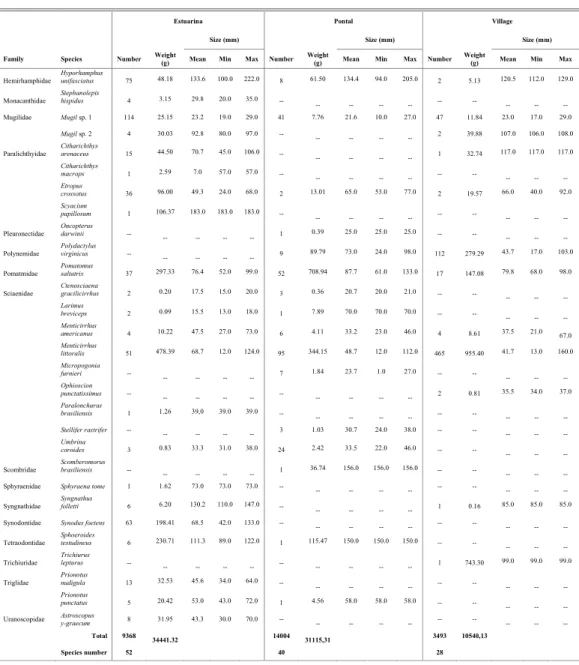
These differences were also observed at the results from the two-way ANOVA. All community descriptors used were statistically different among months (n=12), sites (n=3) and in the interaction of these factors (n=36), except for evenness and diversity indexes which were only significant (p < 0.05) among months and sites, and among months, respectively (Fig. 3).
Abundance (month: F = 19.97, df = 11, p < 0.05; site: F = 12.54, df = 2, p < 0.05 ), weight (month: F = 9.59, df = 11, p < 0.05; site: F = 15.19, df = 2, p < 0.05) and species richness (month: F = 11.97, df = 11, p < 0.05; site: F = 15.47, df = 2, p < 0.05) presented strong seasonal influence with significant differences found in September and March when highest and lowest values occurred, respectively. However, spatial differences were registered only for Village Beach (Fig. 3a-c). Regarding to the evenness index, July was significantly different from the other months (F = 5.4, df = 11, p < 0.05) due to great catches of shoals and also, spatially (F = 10.23, df = 2, p < 0.05) different at Village, where higher values observed for evenness could be attributed to homogeneous species distribution and lower shoals capture (Fig. 3d). Diversity index only suffered influence of seasonal
fluctuation (F = 5.14, df = 11, p < 0.05), and high values of abundance and species richness were responsible for the statistical difference occurring in March (Fig. 3e).
Similarities among sites could be seen at ordination and dendrogram plots (Fig. 4). Although masked by seasonal influence, the studied beaches revealed a distinct faunal composition. Almost all samples taken from Village Beach were under higher degree of similarity (>40%) than the other samples, which varied at 20-30% similarity level (Fig. 4). Results of Simper (Table 2) analysis between these 2 groups (1 – Estuarina + Pontal and 2 – Village) indicated that H. clupeola (33.27%), M. littoralis
(23.49%), T. carolinus (19.53%) and T. goodei
(11.74%) provided the greatest contribution (~89%) to similarity levels in the samples from Village. H. clupeola (55.78%) and T. carolinus (22.05%) were the major contributors for grouping the remainder of the samples, while most (66.36%) of the dissimilarity between the two groups was attributed to seven species. These are, in order of importance: H. clupeola
(22.27%), T. carolinus (9.30%), M. littoralis (8.21%),
O. bonariensis (8.04%), S. brasiliensis (6.98%), T. goodei (5.85%) and P. saltatrix (4.49%).
Table 1. Number (ind.), Weight (g) and Size (mm; standard length) of species caught at the sampling sites in Paraná, South Brazil.
Estuarina Pontal Village
Size (mm) Size (mm) Size (mm)
Family Species Number Weight
(g) Mean Min Max Number
Weight
(g) Mean Min Max Number
Weight
(g) Mean Min Max
Albulidae Albula vulpes 14 35.24 59.3 23.0 128.0 2 6.29 74.5 74.0 75.0 -- -- -- -- --
Atherinopsidae Odontesthes bonariensis --
-- -- -- -- 1406 2865.64 57.3 42.0 153.0 871 2426.51 62.9 43.0 150.0
Belonidae
Strongylura
marina 23 343.79 327.0 230.0 437.0 4 47.86 286.3 202.0 322.0 -- --
-- -- -- Strongylura
timucu 14 176.47 290.1 162.0 395.0 --
-- -- -- -- -- -- -- -- --
Strongylura sp. 1 0.95 57.0 57.0 57.0 --
-- -- -- -- -- -- -- -- --
Carangidae
Chloroscombrus
chrysurus 1 0.06 15.0 15.0 15.0 3 10.95 54.0 40.0 70.0 4 2.91 28.8 18.0 39.0 Oligoplites
saliens 16 802.66 113.7 30.0 385.0 118 95.05 119.4 60.0 139.0 23 23.23 55.1 13.0 134.0 Selene vomer 2 2.25 32.0 30.0 34.0 --
-- -- -- -- -- -- -- -- --
Trachinotus
carolinus 1856 3940.58 40.6 12.0 76.0 770 1220.87 36.4 11.0 95.0 536 805.29 31.6 12.0 106.0 Trachinotus
falcatus 17 10.52 23.2 18.0 26.0 7 3.33 24.4 21.0 34.0 25 20.04 27.5 15.0 43.0 Trachinotus
goodei 30 108.08 48.6 35.0 73.0 10 183.03 84.4 57.0 104.0 132 526.99 46.0 22.0 97.0 Trachinotus
marginatus --
-- -- -- -- -- -- -- -- -- 3 19.18 63.3 33.0 81.0
Trachinotus sp. 1 0.080 14.0 14.0 14.0 1 0.09 15.0 15.0 15.0 1 0.06 13.0 13.0 13.0
Centropomidae
Centropomus
parallelus 1 148.18 198.0 198.0 198.0 --
-- -- -- -- -- -- -- -- --
Clupeidae
Clupeidae
juveniles 4 0.13 20.8 19.0 22.0 --
-- -- -- -- -- -- -- -- --
Harengula
clupeola 3754 11558.27 56.9 38.0 109.0 6354 19630.67 57.3 34.0 131.0 1205 4412.36 56.2 32.0 102.0 Ophisthonema
oglinum 7 6.09 55.0 50.0 63.0 75 12.85 61.1 45.0 76.0 4 2.80 51.0 37.0 61.0 Platanychthys
platana 3 0.207 26.7 26.0 27.0 1 0.15 24.0 24.0 24.0 -- --
-- -- -- Sardinella
brasiliensis 1629 15345.95 70.2 32.0 108.0 2263 5440.07 61.9 29.0 92.0 10 28.30 52.2 25.0 85.0
Dactylopteridae
Dactylopterus
volitans 1 75.94 166.0 166.0 166.0 --
-- -- -- -- -- -- -- -- --
Diodontidae Cyclichthys
spinosus 1 0.15 12.0 12.0 12.0 -- -- -- -- -- -- -- -- -- --
Engraulidae Anchoa lyolepis 374 0.89 43.6 35.0 57.0 2534 3.39 42.3 34.0 55.0 9 13.93 49.6 40.0 70.0
Anchoa parva 50 60.54 46.9 33.0 57.0 45 77.54 50.4 31.0 67.0 4 5.53 47.0 43.0 51.0 Anchoa tricolor 39 14.89 46.4 34.0 97.0 106 16.74 48.9 31.0 103.0 2 2.11 44.5 40.0 49.0 Cetengraulis
edentulus 11 51.54 71.8 57.0 84.0 4 18.49 69.8 67.0 75.0 -- --
-- -- -- Engraulidae
juveniles 401 0.55 23.1 14.0 41.0 14 0.68 26.9 22.0 32.0 -- --
-- -- -- Lycengraulis
grossidens 1 1.17 49.0 49.0 49.0 --
-- -- -- -- -- -- -- -- --
Ephippidae
Chaetodipterus
faber 3 0.95 25.0 23.0 27.0 3 7.62 37.7 32.0 43.0 -- --
-- -- --
Gerreidae
Diapterus rhombeus --
-- -- -- -- 3 48.12 106.7 101.0 112.0 -- -- -- -- --
Eucinostomus
argenteus 11 24.20 67.0 58.0 81.0 1 23.14 97.0 97.0 97.0 -- --
-- -- -- Eucinostomus
lefroyi 639 0.20 14.0 8.0 56.0 13 0.05 13.3 10.0 15.0 2 0.33 23.5 15.0 32.0 Eucinostomus
melanopterus 1 49.29 127.0 127.0 127.0 --
-- -- -- -- -- -- -- -- --
Haemulidae Conodon nobilis --
-- -- -- -- 2 1.37 32.5 26.0 39.0 6 6.93 36.7 35.0 39.0
Haemulidae
Pomadasys
corvinaeformis 11 16.10 59.5 53.0 76.0 10 1.33 38.2 34.0 42.0 -- --
Table 1. Continued.
Estuarina Pontal Village
Size (mm) Size (mm) Size (mm)
Family Species Number Weight
(g) Mean Min Max Number
Weight
(g) Mean Min Max Number
Weight
(g) Mean Min Max
Hemirhamphidae
Hyporhamphus
unifasciatus 75 48.18 133.6 100.0 222.0 8 61.50 134.4 94.0 205.0 2 5.13 120.5 112.0 129.0
Monacanthidae
Stephanolepis
hispidus 4 3.15 29.8 20.0 35.0 --
-- -- -- -- -- -- -- -- --
Mugilidae Mugil sp. 1 114 25.15 23.2 19.0 29.0 41 7.76 21.6 10.0 27.0 47 11.84 23.0 17.0 29.0
Mugil sp. 2 4 30.03 92.8 80.0 97.0 --
-- -- -- -- 2 39.88 107.0 106.0 108.0
Paralichthyidae
Citharichthys
arenaceus 15 44.50 70.7 45.0 106.0 --
-- -- -- -- 1 32.74 117.0 117.0 117.0
Citharichthys
macrops 1 2.59 7.0 57.0 57.0 --
-- -- -- -- -- -- -- -- --
Etropus
crossotus 36 96.00 49.3 24.0 68.0 2 13.01 65.0 53.0 77.0 2 19.57 66.0 40.0 92.0 Scyacium
papillosum 1 106.37 183.0 183.0 183.0 --
-- -- -- -- -- -- -- -- --
Pleuronectidae Oncopterus darwinii --
-- -- -- -- 1 0.39 25.0 25.0 25.0 -- -- -- -- --
Polynemidae
Polydactylus virginicus --
-- -- -- -- 9 89.79 73.0 24.0 98.0 112 279.29 43.7 17.0 103.0
Pomatmidae
Pomatomus
saltatrix 37 297.33 76.4 52.0 99.0 52 708.94 87.7 61.0 133.0 17 147.08 79.8 68.0 98.0
Sciaenidae
Ctenosciaena
gracilicirrhus 2 0.20 17.5 15.0 20.0 3 0.36 20.7 20.0 21.0 -- --
-- -- -- Larimus
breviceps 2 0.09 15.5 13.0 18.0 1 7.89 70.0 70.0 70.0 -- --
-- -- -- Menticirrhus
americanus 4 10.22 47.5 27.0 73.0 6 4.11 33.2 23.0 46.0 4 8.61 37.5 21.0 67.0 Menticirrhus
littoralis 51 478.39 68.7 12.0 124.0 95 344.15 48.7 12.0 112.0 465 955.40 41.7 13.0 160.0 Micropogonia
furnieri --
-- -- -- -- 7 1.84 23.7 1.0 27.0 -- -- -- -- --
Ophioscion punctatissimus --
-- -- -- -- -- -- -- -- -- 2 0.81 35.5 34.0 37.0
Paralonchurus
brasiliensis 1 1.26 39,0 39.0 39.0 --
-- -- -- -- -- -- -- -- --
Stellifer rastrifer --
-- -- -- -- 3 1.03 30.7 24.0 38.0 -- -- -- -- --
Umbrina
coroides 3 0.83 33.3 31.0 38.0 24 2.42 33.5 22.0 46.0 -- --
-- -- --
Scombridae
Scomberomorus brasiliensis --
-- -- -- -- 1 36.74 156.0 156.0 156.0 -- -- -- -- --
Sphyraenidae Sphyraena tome 1 1.62 73.0 73.0 73.0 --
-- -- -- -- -- -- -- -- --
Syngnathidae
Syngnathus
folletti 6 6.20 130.2 110.0 147.0 --
-- -- -- -- 1 0.16 85.0 85.0 85.0
Synodontidae Synodus foetens 63 198.41 68.5 42.0 133.0 --
-- -- -- -- -- -- -- -- --
Tetraodontidae
Sphoeroides
testudineus 6 230.71 111.3 89.0 122.0 1 115.47 150.0 150.0 150.0 -- --
-- -- --
Trichiuridae
Trichiurus lepturus --
-- -- -- -- -- -- -- -- -- 1 743.30 99.0 99.0 99.0
Triglidae
Prionotus
nudigula 13 32.53 45.6 34.0 64.0 --
-- -- -- -- -- -- -- -- --
Prionotus
punctatus 5 20.42 53.0 43.0 72.0 1 4.56 58.0 58.0 58.0 -- --
-- -- --
Uranoscopidae Astroscopus
y-graecum 8 31.95 43.3 30.0 70.0 -- -- -- -- -- -- -- -- -- --
Total 9368
34441.32 14004 31115,31 3493 10540,13
Species number 52 40 28
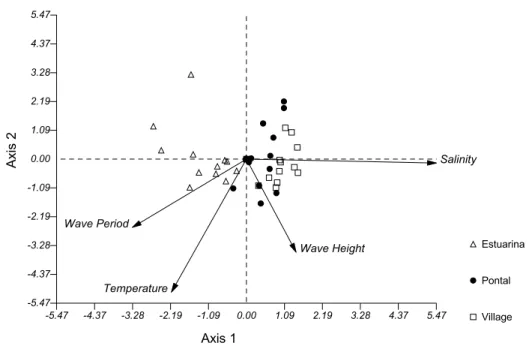
The Canonical Correspondence Analysis - CCA explained 72.08% of data variance. The axis 1 was responsible for 47.80% of data variation. This axis shows the formation of two distinctive groups. One group directly related to highest values of salinity and wave height, which is comprised mostly by the samples from Village and Pontal Beaches. The second
is influenced by wave period and temperature, and is formed almost entirely by samples from Estuarina. The axis 2 accounted for 24.28% of data variation. The group is formed by samples from all beaches studied which suffered a strong influence of temperature, and in lower proportion to wave period and height (Fig. 5).
Jun/04 Ju l/0 4 Aug/ 04 Se p/04 Oct/04 Nov/ 04 Dec/0 4 Jan/ 0 5 Fe b/ 05
Mar/05 Apr/05 May/
05 0,0 0,2 0,4 0,6 0,8 1,0 1,2 1,4 1,6 1,8 2,0 Div ersity (H')
F(22, 136) = 1,57; p > 0,05 Jun/04 J
u l/0 4 Aug/ 04 Se p/04 Oct/04 Nov/ 04 Dec/0 4 Jan/ 0 5 Fe b/ 05
Mar/05 Apr/05 May/
05 0,0 0,1 0,2 0,3 0,4 0,5 0,6 0,7 0,8 0,9 1,0 1,1 1,2 Eve nne ss ( J )
F(22, 136) = 1,27; p > 0,05
0
4
0
4 04
0 4 0 4 0 4 0 4 0 5 0 5 0 5 0 5 0 5 0,5 1,0 1,5 2,0 2,5 3,0 3,5 4,0 4,5 S p ecies n u m b er (square rooted)
F(22, 144) = 2,62; p < 0,05
4 4 4 4 4 4 4 5 5 5 5 5
-1 0 1 2 3 4 5 6 7 8 9 Fi sh numbe
r (logx+1)
Village Pontal Estuarina F(22, 144)= 4,75; p < 0,05
4 4 4 4 4 4 4 5 5 5 5 5
0 1 2 3 4 5 6 7 8 9 10 Weight (logx+1)
F(22, 144)= 3,94; p < 0,05
Jun/ 04 J u l/0 4 Aug/ 04 Se p/ 04 Oct/04 Nov/ 04 D ec/0 4 Jan/ 0 5 Fe b/ 05 Mar/05 Apr /05 May/ 05 0,0 0,2 0,4 0,6 0,8 1,0 1,2 1,4 1,6 1,8 2,0 Div ersity (H')
F(22, 136) = 1,57; p > 0,05 Jun/
04 J u l/0 4 Aug/ 04 Se p/ 04 Oct/04 Nov/ 04 D ec/0 4 Jan/ 05 Fe b/ 05 Mar/05 Apr /05 May/05 0,0 0,1 0,2 0,3 0,4 0,5 0,6 0,7 0,8 0,9 1,0 1,1 1,2 Eve nne ss ( J )
F(22, 136) = 1,27; p > 0,05
0
4
0
4 04
0 4 0 4 0 4 0 4 0 5 0 5 0 5 0 5 0 5 0,5 1,0 1,5 2,0 2,5 3,0 3,5 4,0 4,5 S p ecies n u m b er (square rooted)
F(22, 144) = 2,62; p < 0,05
4 4 4 4 4 4 4 5 5 5 5 5
-1 0 1 2 3 4 5 6 7 8 9 Fi sh numbe
r (logx+1)
Village Pontal Estuarina F(22, 144)= 4,75; p < 0,05
4 4 4 4 4 4 4 5 5 5 5 5
0 1 2 3 4 5 6 7 8 9 10 Weight (logx+1)
F(22, 144)= 3,94; p < 0,05
a
b
c
d
e
Jun/ 04 J u l/0 4 Aug/ 04 Se p/ 04 Oct/04 Nov/ 04 D ec/0 4 Jan/ 0 5 Fe b/ 05 Mar/05 Apr /05 May/ 05 0,0 0,2 0,4 0,6 0,8 1,0 1,2 1,4 1,6 1,8 2,0 Div ersity (H')F(22, 136) = 1,57; p > 0,05 Jun/
04 J u l/0 4 Aug/ 04 Se p/ 04 Oct/04 Nov/ 04 D ec/0 4 Jan/ 05 Fe b/ 05 Mar/05 Apr /05 May/05 0,0 0,1 0,2 0,3 0,4 0,5 0,6 0,7 0,8 0,9 1,0 1,1 1,2 Eve nne ss ( J )
F(22, 136) = 1,27; p > 0,05
0
4
0
4 04
0 4 0 4 0 4 0 4 0 5 0 5 0 5 0 5 0 5 0,5 1,0 1,5 2,0 2,5 3,0 3,5 4,0 4,5 S p ecies n u m b er (square rooted)
F(22, 144) = 2,62; p < 0,05
4 4 4 4 4 4 4 5 5 5 5 5
-1 0 1 2 3 4 5 6 7 8 9 Fi sh numbe
r (logx+1)
Village Pontal Estuarina F(22, 144)= 4,75; p < 0,05
4 4 4 4 4 4 4 5 5 5 5 5
0 1 2 3 4 5 6 7 8 9 10 Weight (logx+1)
F(22, 144)= 3,94; p < 0,05
Jun/ 04 J u l/0 4 Aug/ 04 Se p/ 04 Oct/04 Nov/ 04 D ec/0 4 Jan/ 0 5 Fe b/ 05 Mar/05 Apr /05 May/ 05 0,0 0,2 0,4 0,6 0,8 1,0 1,2 1,4 1,6 1,8 2,0 Div ersity (H')
F(22, 136) = 1,57; p > 0,05 Jun/
04 J u l/0 4 Aug/ 04 Se p/ 04 Oct/04 Nov/ 04 D ec/0 4 Jan/ 05 Fe b/ 05 Mar/05 Apr /05 May/05 0,0 0,1 0,2 0,3 0,4 0,5 0,6 0,7 0,8 0,9 1,0 1,1 1,2 Eve nne ss ( J )
F(22, 136) = 1,27; p > 0,05
0
4
0
4 04
0 4 0 4 0 4 0 4 0 5 0 5 0 5 0 5 0 5 0,5 1,0 1,5 2,0 2,5 3,0 3,5 4,0 4,5 S p ecies n u m b er (square rooted)
F(22, 144) = 2,62; p < 0,05
4 4 4 4 4 4 4 5 5 5 5 5
-1 0 1 2 3 4 5 6 7 8 9 Fi sh numbe
r (logx+1)
Village Pontal Estuarina F(22, 144)= 4,75; p < 0,05
4 4 4 4 4 4 4 5 5 5 5 5
0 1 2 3 4 5 6 7 8 9 10 Weight (logx+1)
F(22, 144)= 3,94; p < 0,05
a
b
c
d
e
3 3 3 2 2 3 2 3 3 3 1 2 1 1 2 2 3 3 1 2 1 1 2 3 3 2 3 1 2 1 1 2 1 2 1 1
100
80
60
40
20
1
1
1
1
1
1
1
1
1
1
1
1
2
2
2
2
2
2
2
2
2
2
2
2
3
3
3
3
3
3
3
3
3
3
3
3
Stress: 0,19
B
ra
y
-C
u
rtis
S
im
ila
ri
ty
%
3 3 3 2 2 3 2 3 3 3 1 2 1 1 2 2 3 3 1 2 1 1 2 3 3 2 3 1 2 1 1 2 1 2 1 1
100
80
60
40
20
1
1
1
1
1
1
1
1
1
1
1
1
2
2
2
2
2
2
2
2
2
2
2
2
3
3
3
3
3
3
3
3
3
3
3
3
Stress: 0,19
B
ra
y
-C
u
rtis
S
im
ila
ri
ty
%
Fig. 4. Multidimensional scaling (MDS) of fish samples captured per site from June/04 to May/05, using the abundance of species caught as attributes. Hauls were pooled by month and labeled as 1-Estuarina (sheltered), 2- Pontal (moderated) and 3-Village (exposed).
Mean Similarity % Mean Dissimilarity %
1 2 1 x 2
Species
35.95 45.40 66.36
H. clupeola 55.78 33.27 22.27
T. carolinus 22.05 19.53 9.3
P. saltatrix 3.46 4.49
M. littoralis 2.89 23.49 8.21
T. goodei 11.74 5.85
O. bonariensis 8.04
S. brasiliensis 6.98
FÉLIX ET AL.: ICHTHYOFAUNA COMPOSITION ACROSS A WAVE – ENERGY GRADIENT 289
Estuarina
Pontal
Village
Axis 2
Axis 1 -1.09
-2.19
-3.28
-4.37
-5.47 0.00 1.09 2.19 3.28 4.37 5.47
-1.09 -2.19 -3.28 -4.37
-5.47 0.00 1.09 2.19 3.28 4.37 5.47
Temperature
Salinity
Wave Height Wave Period
Vector scaling: 6,15
Fig. 5. Factorial diagram from the Canonical Correspondence Analysis showing the distribution of samples and their relationship to environmental variables. Samples are labeled as 1-Estuarina (sheltered), 2- Pontal (moderately) and 3-Village (exposed).
D
ISCUSSIONTwo general trends were evident in the composition of catches across the sites studied: 1) overall species and family numbers, and weight decreased as wave exposure increased, and 2) high abundance values were recorded at intermediate level of exposure. Both findings contrast with some morphodynamic studies where higher species richness and diversity occurred at intermediate levels of energy and abundance generally decreases when exposure increases (HILMAN et al., 1977; DYE et al., 1981; ROMER, 1990; CLARK et al. 1994, 1996; CLARK, 1997).
Bottom morphology not only made comparisons between beaches impossible but could have also exerted major influence on the catches composition. According to Naughton and Saloman’s (1978) work at nearshore zones in Florida, USA, deeper areas are associated with larger captures and higher diversity values. Thus, the elevated fish number encountered at Pontal beach may be directly related to trough presence, since less turbulent waters due to high depths could have facilitated the permanence of
these fish. The fact that only the number and not fish weight was higher in this beach indicates that contributing species were made up basically by small size fish, such as H. clupeola, S. brasiliensis and A. lyolepis. These are usually found in shoals which may explain the elevated catch in number, despite the low biomass. Moreover, trough depth may also have contributed to their aggregation. High larval occurrence in surf zones with ridge and runnel system has been investigated by Watt-Pringle and Strydom (2003). They suggested that aggregation behavior would serve as a temporary refugee next to the coast, in which fish would use long shore currents to move without swimming effort and consequently, wasting little energy. This behavior does not occur in the same intensity in high energy surf zones due to the water column agitation, which would result in high energy consumption (BROWN; McLACHLAN, 1990).
Paranaguá Bay drainage channel, could have also permitted the approximation of large species. Fishes such as C. parallelus, O. saliens, S. timucu and the heavy S. testudineus could raise the total amount of catches in weight at this beach as a consequence.
Robertson and Lenanton (1984) believed that exposed beaches are structurally more homogeneous environment to nektonic organisms. At this study, the segregation of exposed beach samples at MDS and Cluster plots and the significant spatial differences displayed in the ANOVA results pointed to the uniqueness of this beach in relation to ichthyofaunal composition and structure. In addition, a major contributor for that was the great abundances of
M. littoralis and T. goodei when comparing to other beaches, and to a minor proportion of P. virginicus. Despite seasonal fluctuations, Village was nearly always the beach with the highest values of evenness index, which shows its structural homogeneity and equalitarian species distribution among the months.
Dexter (1984) found higher faunal similarity coefficients amongst protected beaches when 4 of them, with distinct exposure degree, were studied in Australian sandy beaches. In our work, according to the univariate and multivariate techniques discussed above, a mixture between Pontal and Estuarina samples was observed, probably, reflection of the similar occupation patterns of fishes in response to the similar submerged profiles of high depths. This is in contrast to patterns expected to occur on beaches of distinct energetic features such as the two mentioned above. In agreement with CCA results, there is an environmental alteration across the three studied beaches. Although Pontal and Village were more similar due to their salinity and wave height measurements, the former is closest to axis 2, and thus, less explicable by the factors analyzed. Estuarina, on the other hand, was in an opposite trend and was more related to temperature and wave period. Samples altogether revealed a gradual change related to environmental variables, like an energy gradient. Although wave-energy influence was not tested properly, data variance can largely be explained by the measured variables, demonstrating its susceptibility to short-term changes.
In summary, beach morphodynamic state are reflex of many interacting environmental parameters such as sediment, submerged profile, winds, and tidal regime among others, but only few were analyzed in this work. Possibly depth more than energy accounted for most differences found between these beaches, particularly, to shoaling behavior of certain species. Probably the existence of troughs in Pontal Beach made it more similar to Estuarina. Although these beaches are considered to have completely distinct energy levels, they provided temporary refugees to transient fish species. Integrated studies (planktologic,
trophic, behavioral, geomorphologic and chemical studies) are now necessary to understand spatial and temporal species segregation and the many distinct behaviors presented by these species.
A
CKNOWLEDGEMENTSWe are very thankful to all students who helped in this field work, Mauricio Garcia de Camargo for advices in statistical analysis and Centro de Estudos do Mar for the physical structure and assistance in developing this study. We also thank CAPES for providing the author’s postgraduate scholarship.
R
EFERENCESBARLETTA, M.; CORRÊA, M. F. M. Guia para identificação de peixes da costa do Brasil. Curitiba: Editora da UFPR, 1992. 131 p.
BENNET, B. A. The fish community of a moderately exposed beach on the southern Cape Coast of South Africa and an assessment of this habitat as nursery for juvenile fish. Estuar. coast. Shelf Sci., v. 28, p. 293-305, 1989.
BIGARELLA, J. J.; ALESSI, A. H.; BECKER, R. D.; DUARTE, G. M. Textural characteristics of the coastal dune, sand ridge and beach sediments. Bolm. Univ. Paraná, Geologia, v. 27, p. 15 – 80, 1969.
BORZONE, C.A.; MELO, S.G.; REZENDE, K.V.; VALE, R.; KRUL, R. Macrobenthic intertidal communities from wave to tide dominated beach environments. A case study in two Brazilian beaches. J. coast. Res., v. 35, p. 472-480, 2003.
BROWN, A. C.; MCLACHLAN, A. Ecology of Sandy Beaches. New York: Elsevier Science Publishers, 1990. 328 p.
CLARK, B. M. Variation in surf-zone fish community structure across a wave exposure gradient. Estuar. coast.
Shelf Sci., v. 44, p. 659-674, 1997. doi:
10.1006/ecss.1996.0151.
CLARK, B. M.; BENNET, B. A.; LAMBERTH, S. J. A comparison of the ichthyofauna of two estuaries and their adjacent surf zones, with as assessment of the effects of beach-seining on the nursery function on estuaries for fish. S. Afr. J. mar. Sci., v. 14, p. 121-131, 1994.
CLARK, B. M.; BENNET, B. A.; LAMBERTH, S. J. Factors affecting spatial variability in seine net catches of fishes in the surf zone of False Bay, South Africa. Mar. Ecol. Prog. Ser., v. 131, p. 17-34, 1996.
CLARKE, K. R.; WARWICK, R. M. Change inmarine communities: An approach to statistical analysis and interpretation. Plymouth: Plymouth Marine Laboratory, 1994. 144 p.
DEXTER, D. M. Temporal and spatial variability in the community structure of the fauna of four sandy beaches in South-eastern New South Wales. Aust. J.mar. Freshwat. Res., v. 34, p. 663-672, 1984.
DEXTER, D. M. Temporal and spatial variability in the community structure of the fauna of four sandy beaches in South-eastern New South Wales. Aust. J. mar. Freshwat. Res., v. 34, p. 663-672, 1984.
DYE, A H.; MCLACHLAN, A.; WOOLDRIDGE, T. The ecology of sandy beaches in Natal. S. Afr. J. Zool. v. 16, n. 4, p. 200-209, 1981.
FIGUEIREDO, J. L.; MENEZES, N. Manual de peixes marinhos do sudeste do Brasil. II. Teleostei (1). São Paulo: Museu de Zoologia da USP, 1978. 110 p. FIGUEIREDO, J. L.; MENEZES, N. Manual de peixes
marinhos do sudeste do Brasil. III.Teleostei (2). São Paulo: Museu de Zoologia da USP, 1980. 90 p. FIGUEIREDO, J. L.; MENEZES, N. Manual de peixes
marinhos do sudeste do Brasil. VI.Teleostei (5). São Paulo: Museu de Zoologia da USP, 2000. 116 p. FISCHER, W. FAO species identification sheets for fishery
purposes. Western Central Atlantic (Fishing area 31). Roma: FAO, 1978. 1-7, p.v.
GAELZER, L. R.; ZALMON, I. R. The influence of wave gradient on the ichthyofauna of southeastern Brazil: focusing the community structure in surf zone. J. coast. Res., v. 35, p. 56–462, 2003.
GIBSON, R. N. The intertidal movements and distribution of young fish on sandy beach with special reference to the plaice (Pleuronectes platessa L.). J. expl. mar. Biol. Ecol., v. 12, p. 79-102, 1973.
GODEFROID, R. S. ; HOFSTAETTER, M.; SPACH, H. L. Structure of the fish assemblage in the surf zone of the beach at Pontal do Sul, PR. Neritica, v. 11, p. 77-93, 1997.
HILLMAN, R. E.; DAVIS, N. W.; WENNENER, J. Abundance, diversity, and stability in shore - zone fish communities in an area of Long Island Sound Affected by the thermal discharge of a nuclear power station.
Estuar. coast. Shelf Sci., v. 5, p. 355 – 381, 1977. ICZN – International Code of Zoological Nomenclature.
Artigo 16: Recomendações 16.1. London: International Trust for Zoological Nomenclature, 2000.
LASIAK, T. A. Structural aspects of the surf zone fish assemblage at King’s Beach, Algoa Bay, South Africa: Short - term fluctuations. Estuar. coast. Shelf Sci., v. 18, p. 347-360, 1984a.
LASIAK, T. A. Structural aspects of the surf zone fish assemblage at King’s beach, Algoa Bay, South Africa: Long-term fluctuations. Estuar. coast. Shelf Sci., v. 18, p. 459-483, 1984b.
LASIAK, T. A. Juveniles, food, and the surf zone habitat: implications for the teleost nursery areas. S. Afr. J. Zool., v. 21, p. 51- 55, 1986.
McFARLAND, W. N. Seasonal change in the number and the biomass of fishes fro the surf at Mustang Island, Texas. Pub. Inst. mar. Sci. Univ. Tex., v. 9, p. 91-105, 1963.
MENEZES, N.; FIGUEIREDO, J. L. Manual de peixes marinhos do sudeste do Brasil. IV. Teleostei (3). São Paulo: Museu de Zoologia da USP, 1980. 90 p. MENEZES, N.; FIGUEIREDO, J. L. Manual de peixes
marinhos do sudeste do Brasil. V. Teleostei (4). São Paulo: Museu de Zoologia da USP, 1985. 90 p. MODDE, T. Growth and residency of juveniles fishes within
a surf zone habitat in the Gulf of Mexico. Gulf Res. Repts, v. 6, n. 4, p. 377-385, 1980.
NAUGHTON, S. P.; SALOMAN, C. H. Fishes of the nearshore zone of St. Andrew Bay, Florida, and adjacent coast. Northeast Gulf Sci., v. 2, n. 1, p. 43–55, 1978. ROBERTSON, A. I.; LENANTON, R. C. Fish community
structure and food chain dynamics in the surf zone of sandy beaches: the role of aquatic macrophyte detritus. J. expl. mar. Biol.Ecol., v. 84, p. 265-283, 1984. ROMER, G. S. Surf zone fish community and species
response to wave energy gradient. J. Fish Biol., v. 36, p. 279-287, 1990.
SANTOS, R. S.; NASH, R. D. M. Seasonal changes in a sandy beach fish assemblage at Porto Pim, Faial, Azores.
Estuar. coast. Shelf Sci., v. 41, p. 579–591, 1995. SOKAL, R. R.; ROHLF, H. J. Biometry. 3rd
ed. W. H. San Francisco: Freeman and Company, 1995. 859 p. VAZZOLER, A. E. A. M. Manual de métodos paraestudos
biológicos de populações de peixes - reprodução e crescimento. Brasília: CNPq, 1981. 108 p.
WATT-PRINGLE, P.; STRYDOM, N. A. Habitat use by larval fishes in a temperate South African surf zone.
Estuar. coast. Shelf Sci., v. 58, p. 765–774, 2003. WRIGHT, L. D.; SHORT, A D. Morphodynamic variability
of surf zones and beaches: a synthesis. Mar. Geol., v. 56, p. 93–118, 1984.