ON THE EVALUATION OF BRAZILIAN LANDLINE TELEPHONE SERVICES COMPANIES
José Virgílio Guedes de Avellar Alexandre Olympio Dower Polezzi Armando Zeferino Milioni *
Divisão de Engenharia Mecânica-Aeronáutica Instituto Tecnológico de Aeronáutica
São José dos Campos – SP E-mails: [email protected]
[email protected] [email protected]
* Corresponding author / autor para quem as correspondências devem ser encaminhadas Received September 2001; accepted October 2002 after one revision.
Abstract
In this work we investigate the relative efficiency of 34 Brazilian Landline Telephone Service companies using Data Envelopment Analysis with weight constraints in the input and output variables. We formulate two different models that take into account the performance of the companies with respect to the criteria defined by Brazilian National Agency of Telecommunications (ANATEL). We also illustrate the potential of efficiency improvement through the simulation of corporate Merger.
Keywords: DEA, telecommunications, weight constraints.
Resumo
Neste trabalho investigamos a eficiência relativa das 34 operadoras do Setor de Telefonia Fixa Comutada através da utilização de Análise de Envoltória de Dados com restrições nos pesos das variáveis de input e output. Formulamos dois modelos distintos que levam em consideração o desempenho das empresas quanto aos critérios definidos pela Agência Nacional de Telecomunicações (ANATEL). Também ilustramos o potencial de melhoria de eficiência através de simulações de fusões corporativas (Merger).
1. Introduction
The privatization of the Landline Telephone Services in Brazil and the opening of the market for international operators caused significant changes in the profile of the companies offering these services, since they are now operating in a highly competitive environment as opposed to what happened in the past.
The Brazilian National Agency of Telecommunications (ANATEL) maintains an intense control of those companies, rewarding good results – for instance, through the permission of access to competition in new operation areas – and punishing through fines the non-accomplishment of the established goals.
In July of 1998 ANATEL settled goals to be measured on the last day of the up coming 5 years. Goals were settled for each company with regard to the Quality of the services provided (see “Plano Geral de Metas de Qualidade para o STFC”, 1998) and the so called “Universality” issue – which says respect to all citizens right to wide access to telecommuni-cations services (see “Plano Geral de Metas de Universalização para o STFC”, 1998).
This work fits in the context of ANATEL’s continuous effort in evaluating the performance of 34 companies that are regular operators in the Brazilian Landline Telephone Service (called STFC – Serviços de Telefonia Fixa Comutada – operators). With a similar purpose Milioni developed for ANATEL (Milioni, 2001-a) an AHP model (Analytical Hierarchical Process) that took in consideration specific aspects of Universality, Quality and Fees associates to each company. Milioni concluded that for the comparison of the companies the Fee aspect was practically irrelevant, since all companies practice the maximum allowed fee except for very specific schedules of the day or punctual promotions and loyalty contracts. Although interesting, the results of Milioni, as a consequence of the technique used in his work, are limited to the ranking of the analyzed companies.
The methodology we use in this work is Data Envelopment Analysis (DEA), a non-parametric method developed to evaluate the relative efficiency of different entities of a common nature. Based on linear programming techniques, DEA is considered a robust tool for the evaluation of relative efficiencies as well as for the establishment of goals (or benchmarks) for the entities out of the efficiency border (or envelope). The analyzed entities or DMU’s (for Decision Making Units) are compared under Farrel’s concept of efficiency (Farrel et al., 1962), that consists of a ratio of the weighted sum of the outputs y over the weighted sum of the inputs x of each DMU. The decision variables are u, the vector of weights of the outputs y, and v, the vector of weights of the inputs x. The choice of intervals that restrict the weights u and v is a subject of current research and it constitutes object of interest of this work.
The first DEA formulation (Charnes et al., 1978), which became well known as CCR Model,
supposes constant returns to scale (CRS). The also well known BCC Model (Banker et al.,
1984) supposes variable return to scale (VRS). One of the purposes of a DEA formulation is establishing projections of inefficient DMU’s on the efficiency border, settling down goals that turn them efficient. One way of doing that, in the so-called input-oriented models, is through the decrease of the input, keeping the output constant. Similarly, in the output-oriented models, we increase the output holding the input constant (Cooper et al., 2000).
Our second model deals with the evaluation of the services provided (Quality and Universality) taking into consideration the situation in two distinct instants of time: July of 1998, when the Quality and Universality goals were settled, and December 31st of 2000, the most recent instant for which there were data allowing the comparison of actual figures with settled goals.
In Section 2 we describe each model and in Section 3 we address the issue of imposing constraints on the values of the decision variables. In Section 4 we present our results and in Section 5 we develop a simulation on the consequences of two possible merges. Finally, we close with Section 6 where we present our final remarks.
2. The Models
2.1 Model 1
In this model the inputs represent the main cost components and the outputs represent the products that generate revenue for the companies. The variables we use are the following:
Inputs:
• L – Labor (or, number of regular employees + subcontracts): represents the largest
cost component.
• PT – Number of Public Telephones Installed: relates to the investment on both, the
installation and the maintenance of public phones.
• AI – Number of Fixed Accesses Installed: same as above for non-public phones. Outputs:
• MN – Number of charged minutes in national connections: according to ANATEL,
it is the first revenue indicator.
• P – Number of local pulse: second revenue indicator.
• AS – Number of Fixed Accesses in Service: it produces a monthly account
subscription fee plus installation costs covered by the user.
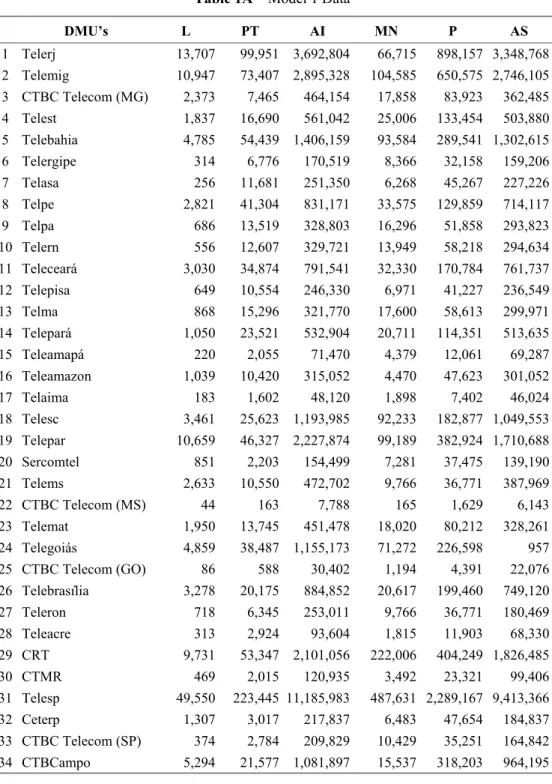
The data were supplied by ANATEL and refers to the situation observed on December 31st,
2000 (see Table 1A, Appendix).
Since the discretionary variable is Labor, we will use an input-oriented formulation. We use a BCC and a CCR model in order to compute both, the technical and global efficiencies, respectively. We also compute the CCR and BCC efficiencies ratio, or scale efficiency. Then, we analyze the companies in terms of their relative size for the business and their competence in managing internal resources.
2.2 Model 2
Inputs:
L / ) P MN (
X1= 4 + (1)
In the numerator of the ratio we have a revenue indicator (the average revenue per minute in national connection is four times the same for local connections) and in the denominator we have a cost indicator. Companies with greater X1 values achieve higher profit levels and thus they have greater potential of investing in Quality and Universality.
AI / AS
X2= (2)
Revenue is proportional to the number of fixed accesses in service (AS), whereas cost is proportional to the number of fixed accesses installed (AI). Thus, the X2 ratio is an indicator of the quality of the investments of each company.
Outputs:
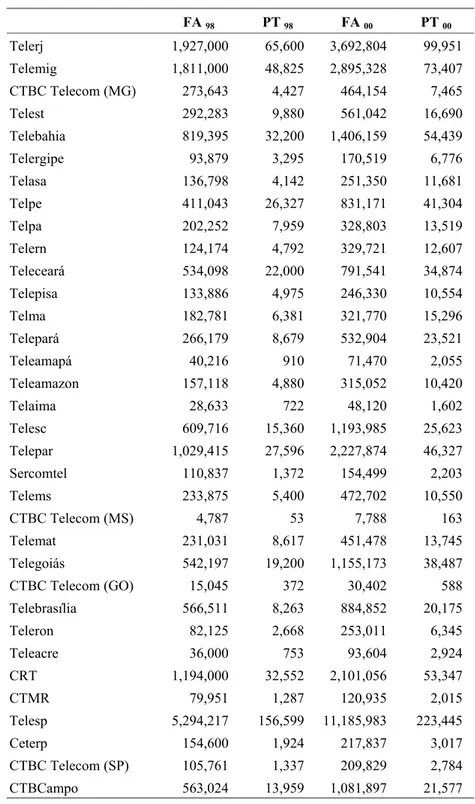
As we have seen, AI and PT (number of public telephones installed) data refer to December 31st of the year 2000. Now, let AI98 be the same as AI and let PT98 be the same as PT but
now both measured in July of 1998, when Quality and Universality goals were settled by ANATEL. Let us also consider, as in Milioni’s AHP formulation (Milioni, 2001-a), that the improvement on the number of fixed accesses and public telephones are equally important for ANATEL. Then, our first output, defined as an indicator of Universality, will be:
Y1 =[(AI−AI98)/AI98]+[(PT−PT98)/PT98] (3)
i.e., Y1 is the sum of the relative increase on the number of fixed accesses and public telephones installed in December of 2000 with respect to July of 1998, when the goals were settled by ANATEL. Data on AI98 and PT98 can be found on Table 3A in the Appendix.
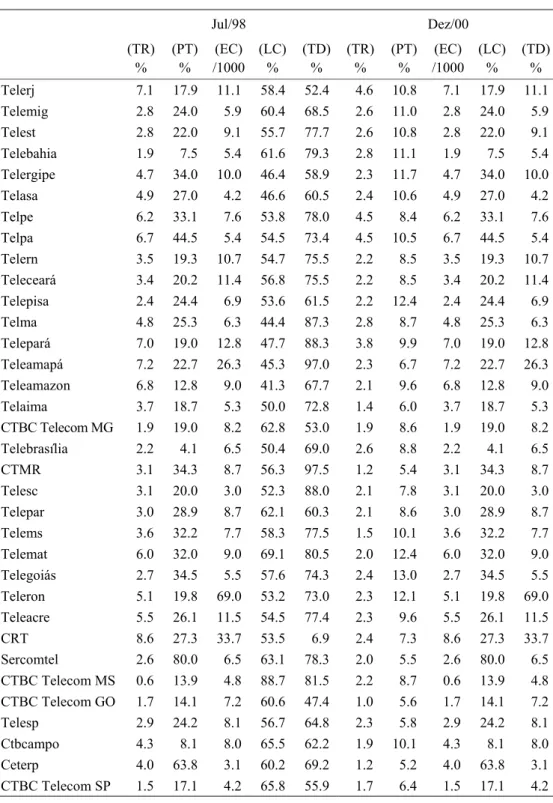
Output 2 is a measure of Quality improvement. Five indicators were chosen to compose output 2: Number of Repair Request per 100 accesses (RR); Number of Repair Request per 100 Public Telephones (RP); Invoice account error per 1000 invoices (IE); Relative Frequency of Local Completed Calls (LC) and Level of Digitalization (DL). For the establishment of each one of them, the following procedure was adopted: We first compute the difference among the value of the indicator for each DMU in December of 2000 and in July of 1998. Then we compute the average of all those values. Next we compute the reason between the value obtained for each DMU and the overall average. The final result is a weighted sum of the five ratios computed as above. We considered the same relative weights as in Milioni’s AHP formulation (Milioni, 2001-a), i.e.: 10% for RR, 20% for RP, 20% for IE, 20% for LC and 30% for DL. Thus, Output 2 becomes:
Y2 =
m o m
o m
o m
o m
o
DL DL LC
LC IE
IE RP
RP RR
RR
. .
. .
.1 02 02 02 03
0 + + + + (4)
Subscript zero represents the result associated to the DMU under analysis and subscript m represents the average value of referred indicator for all DMU’s.
3. Restrictions on virtual inputs and outputs
The concept of virtual input (output), defined as the product of the value of the input (output) and its respective weight was created in order to make possible the verification of the relative share of each input or output in the objective function.
Specialists arbitrarily establish the range of share of each input (output) in the objective function by choosing the constants ϕr e ψr (Allen et al., 1997) such that:
r s
1 r r rj
rj r r ψ y u y u
φ ≤ ≤
∑
=(5)
A variation of equation (5) is used when we want to establish an approximate interval for all DMU’s through the mean value of the inputs (outputs). This way, we define general tendencies of relative share of the variable in the objective function.
r N j rj s r r rj N j r r ψ ) N / y ( u N / y u
φ ≤ ≤
∑
∑
∑
= = = 1 1 1 (6)In the case of three outputs we can rewrite above equation, for instance, in the following way:
1 3
2 1
1
1 u MO1/(u MO1 u MO2 u MO3) ψ
φ ≤ + + ≤ (7)
where MOq is the average of output q, q=1,2,3.
In order to run Models 1 and 2 we used the pattern of dividing each output (input) by its respective mean value (Allen et al., 1997). Therefore, the value of MOq will be equal to 1 for all q. Let thus be the notation u' for the weight of the output divided by its mean value and v' the same for the input.
3.1 Model 1
Among the three inputs of Model 1, the one known to be the most relevant for the company is Labor (L). Thus, we adopted that such variable has a tendency of share in the objective function varying from 50% to 75%, including the following restriction in the virtual input:
75 0 50
0. ≤v1'/(v1'+v2'+v3')≤ . (8)
where the indexes 1, 2 and 3 are with respect to L, PT and AI, respectively.
Treating v2' + v3' as just one variable represented by (v2' + v3') we arrived, starting from
inverting the equation presented in (8) followed by a simple algebraic treatment, to the following equations, that are the constraints to be included in the model:
0
3 2 1'−(v '+v ')≥
v and −v1'+3.(v2'+v3')≥0 (9)
Now, considering that, in general, the maintenance and operation costs of a public telephone are larger than the ones of a fixed access, we arbitrate that the relationship of the share of those two variables is of 3 to 1, i.e.:
' v . '
v2 ≥3 3 (10)
We acted in a totally similar way in the case of the outputs, considering that the main output of a company says respect to the Number of charged minutes in national connections (MN). Thus: 75 0 50 0 3 2 1 1 . . ' u ' u ' u ' u ≤ + +
≤ −u1'+3(u2'+u3')≥0 and u1'−(u2'+u3')≥0 (11)
where the indexes 1, 2 and 3 are defined with, to MN, P and AS, respectively.
We also defined, in relation to the outputs P and AS, that the relative share of the first should be 3 times greater than the one of the second. Thus,
' u . '
u2 ≥3 3 (12)
3.2 Model 2
In Model 2 we have two input and two output variables. Considering X1, as the most relevant variable in Model 2, we adopted as before (Model 1) that it has a tendency of share in the objective function varying from 50% to 75%. Thus, we have:
75 0 50
0. ≤u1'/(u1'+u2')≤ . (13)
where the indexes 1 and 2 are with respect to X1 and X2, respectively. From (13), we get, as before: 3 1 4 1 2 1 2 1
2 + ≤ ⇒ ≤ ≤
≤ ' u ' u ' u ' u
⇒ −u1'+u2'≥0 and 3u1'−u2'≥0 (14)
Considering both outputs as equally important, we defined a constraint rule designed not to allow that the DEA solution has either very low or very high values for each of them. In that sense, we impose:
70 0 30
0. ≤v1'/(v1'+v2')≤ . (15)
where the indexes 1 and 2 are with respect to Y1 and Y2, respectively. From (15), we get:
0 43
0 1+ 2 ≥
− . v ' v ' and 2.33v1'−v2'≥0 (16)
4. Results
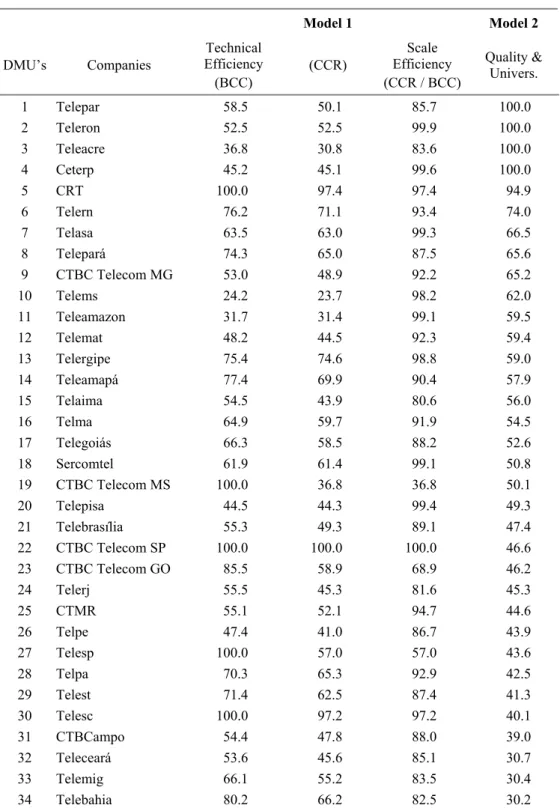
Table 1 – Efficiency results according to Models 1 and 2 (all in %)
Model 1 Model 2
DMU’s Companies
Technical Efficiency (BCC)
(CCR)
Scale Efficiency (CCR / BCC)
Quality & Univers.
1 Telepar 58.5 50.1 85.7 100.0
2 Teleron 52.5 52.5 99.9 100.0
3 Teleacre 36.8 30.8 83.6 100.0
4 Ceterp 45.2 45.1 99.6 100.0
5 CRT 100.0 97.4 97.4 94.9
6 Telern 76.2 71.1 93.4 74.0
7 Telasa 63.5 63.0 99.3 66.5
8 Telepará 74.3 65.0 87.5 65.6
9 CTBC Telecom MG 53.0 48.9 92.2 65.2
10 Telems 24.2 23.7 98.2 62.0
11 Teleamazon 31.7 31.4 99.1 59.5
12 Telemat 48.2 44.5 92.3 59.4
13 Telergipe 75.4 74.6 98.8 59.0
14 Teleamapá 77.4 69.9 90.4 57.9
15 Telaima 54.5 43.9 80.6 56.0
16 Telma 64.9 59.7 91.9 54.5
17 Telegoiás 66.3 58.5 88.2 52.6
18 Sercomtel 61.9 61.4 99.1 50.8
19 CTBC Telecom MS 100.0 36.8 36.8 50.1
20 Telepisa 44.5 44.3 99.4 49.3
21 Telebrasília 55.3 49.3 89.1 47.4
22 CTBC Telecom SP 100.0 100.0 100.0 46.6
23 CTBC Telecom GO 85.5 58.9 68.9 46.2
24 Telerj 55.5 45.3 81.6 45.3
25 CTMR 55.1 52.1 94.7 44.6
26 Telpe 47.4 41.0 86.7 43.9
27 Telesp 100.0 57.0 57.0 43.6
28 Telpa 70.3 65.3 92.9 42.5
29 Telest 71.4 62.5 87.4 41.3
30 Telesc 100.0 97.2 97.2 40.1
31 CTBCampo 54.4 47.8 88.0 39.0
32 Teleceará 53.6 45.6 85.1 30.7
33 Telemig 66.1 55.2 83.5 30.4
In Figure 1 we plot the results obtained by Model 1 (Technical Efficiency) and Model 2. 20,00% 40,00% 60,00% 80,00% 100,00%
20,00% 40,00% 60,00% 80,00% 100,00%
Model 2 Mo d e l 1 - T e c h n ic a l Effi c ie n c y 5 A B 19 22 27 30 3 4 2 1
Figure 1 – Model 1 (Technical Efficiency) vs. Model 2
In Figure 1 we first observe the presence of a prominence point marked with the arrow. The company associated to the point (CRT) is a benchmark in terms of technical efficiency for Model 1 and it belongs to the set of 5 most efficient companies with respect to Quality and Universality criteria (Model 2).
Companies belonging to Cluster A (Telepar, Teleron, Ceterp e Teleacre) present low Technical Efficiency levels perhaps as a consequence of large investments on Quality and Universality, for they are benchmarks with respect to Model 2. Together with CRT, these companies are, in principle, candidates for some kind of reward from ANATEL, such as the right to explore other markets. Within the same context, companies belonging to Cluster B (CTBC Telecom MS e SP, Telesp e Telesc) would be the first addressed by ANATEL in order to explain their low performance in terms of Quality and Universality, considering that they are benchmarks in terms of Technical Efficiency regarding Model 1.
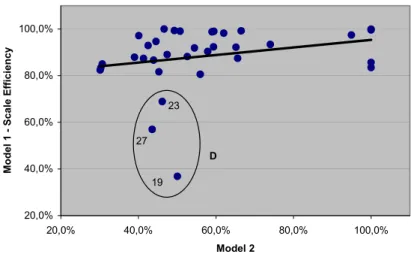
In Figure 2 we plot the results obtained by Models 1 and 2 but now considering Scale Efficiency for Model 1.
20,0% 40,0% 60,0% 80,0% 100,0%
20,0% 40,0% 60,0% 80,0% 100,0%
Model 2 M o d e l 1 - S c a le E ffi c ie n c y D 27 19 23
The increasing tendency line shows that companies with larger Scale Efficiency tend to have larger Quality and Universality efficiencies as well, what is desirable and could be considered expected. This is an indicator that expected merges for 2003, provided they are well conducted, are likely to produce better companies overall.
Companies belonging to Cluster D (Telesp, CTBC Telecom MS and GO) show very low values for Scale Efficiency. This indicates that they are currently with wrong sizes for the business, what could be affecting their capability of achieving good Quality and Universality indicators.
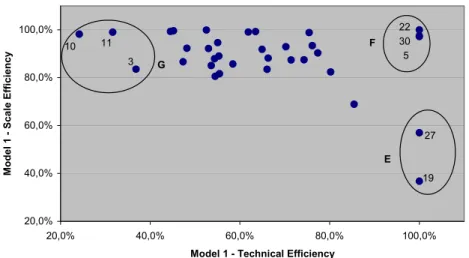
Next, in Figure 3, we plot the Scale Efficiency against Technical Efficiency obtained from Model 1.
20,0% 40,0% 60,0% 80,0% 100,0%
20,0% 40,0% 60,0% 80,0% 100,0%
Model 1 - Technical Efficiency
Mo
d
e
l
1
-
Sc
a
le
Effi
c
ie
n
c
y F
G
E
10 11
3 5
30 22
27
19
Figure 3 – Model 1: Scale Efficiency vs. Technical Efficiency
It is interesting to point out that in the study conducted by Milioni (2001-b), the 2 companies belonging to Cluster E (Telesp e CTBC Telecom MS) were considered among the best in terms of financial situation. In his work developed for ANATEL, 20 companies among the 34 studied in this article had their 2000 annual balance statement data analyzed using both, a Logit model developed by Scarpel & Milioni (2001), and a DEA model developed by Almeida & Milioni (2001). In none of them Scale Efficiency was taken into consideration. With our present results we can see that these two companies obtained the smallest values for Scale Efficiency, whereas achieving benchmarks in terms of Technical Efficiency. According to Cooper et al. (2000), such companies could be facing problems as a consequence of their current size or due to regional specificity.
Cluster F (CTBC Telecom SP, CRT e Telesc) represents the group of most successful companies regarding Model 1. They all appear among top 10 in the study conducted by Milioni (2001-b) and the last 2 belong to top 5.
5. Merger Simulation
Analyzing the results obtained in Model 1, where the companies were evaluated according to both, a CCR and a BCC formulation, we observe that CTBC Telecom MS is the company with the smallest Scale Efficiency among them all, in spite of the fact that it is a benchmark in terms of Technical Efficiency. In order to improve the Scale Efficiency of CTBC Telecom MS we propose a merger with other CTBC Telecom companies (GO, SP and MG). We will evaluate the efficiency of the new company that we will call just CTBC.
On the other hand we have Sercomtel, a company with good Scale Efficiency but Technical Efficiency below the average. For the sake of illustration we will also consider the merger of Sercomtel with Telesc, chosen according to the criteria of geographical proximity, since they are companies located in neighboring states. We will call this second company South.
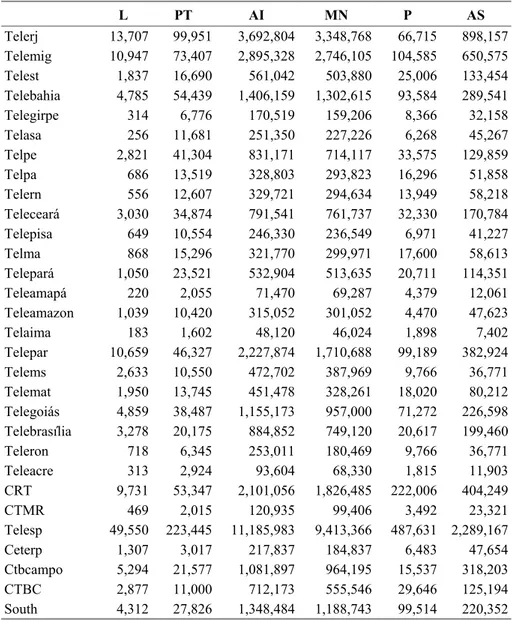
Following Cooper et al. (2000), we conduct the mergers by simply adding all inputs and
outputs. The data we used can be found in Table 4A, Appendix.
Next we show the efficiencies resulting from the use of the input-oriented model over the set of 30 companies resultant after the merges:
Table 2 – Efficiency results after Merger (all in %)
DMU’s BCC CCR Scale Efficiency
CRT 100.0 100.0 100.0
South * 100.0 100.0 100.0
Telegoiás 70.9 71.0 99.9
Telebahia 84.2 84.4 99.8
Telepar 59.4 59.7 99.6
Teleceará 59.2 59.6 99.5
Telpe 52.7 53.1 99.3
Telest 80.1 80.8 99.2
Telepará 84.4 85.3 98.9
Telemig 66.1 66.9 98.8
Telerj 55.2 56.0 98.5
Telebrasília 58.6 59.6 98.2
CTBCampo 56.9 58.0 98.1
Telma 76.7 78.2 98.1
Telpa 83.8 85.6 97.8
Telern 91.4 93.5 97.7
CTBC * 72.1 74.4 96.9
Telemat 53.4 55.1 96.8
Telergipe 96.0 100.0 96.0
Telasa 81.0 84.3 96.0
Telepisa 56.8 59.5 95.5
Teleron 67.1 71.0 94.5
Teleamazon 40.3 42.7 94.3
Table 2 (cont.) – Efficiency results after Merger (all in %)
DMU’s BCC CCR Scale Efficiency
Ceterp 55.1 62.3 88.5
Teleamapá 86.7 100.0 86.7
CTMR 63.6 80.4 79.1
Telesp 68.0 100.0 68.0
Teleacre 39.2 60.7 64.6
Telaima 54.8 100.0 54.8
* resultant from Merger
Analyzing the results presented in Table 2 we observe that the Technical Efficiency of CTBC (72,1%) falls below the average of the former CTBC Telecom companies, which was equal to 84,6%. The Scale Efficiency, however, increases to 96,9% with respect to the
former average of 74,5%. This results are the same as those registered by Cooper et al.
(2000) in a Bank Merger Simulation, i.e., when two locally (BCC) efficient DMU’s merge to form a new DMU, the new DMU is neither locally (BCC) nor globally (CCR) efficient, if increasing returns-to-scale prevails at all three DMU’s.
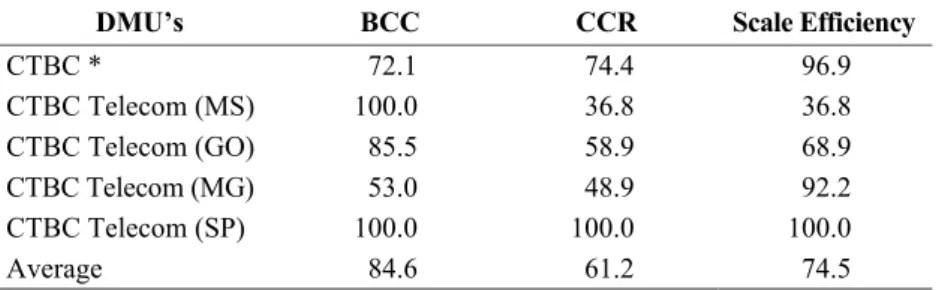
Table 3 – CTBC’s efficiency results after Merger (all in %)
DMU’s BCC CCR Scale Efficiency
CTBC * 72.1 74.4 96.9
CTBC Telecom (MS) 100.0 36.8 36.8 CTBC Telecom (GO) 85.5 58.9 68.9 CTBC Telecom (MG) 53.0 48.9 92.2 CTBC Telecom (SP) 100.0 100.0 100.0
Average 84.6 61.2 74.5
* resultant from Merger
Results presented in Table 3 suggest that a simple Merger would not be sufficient in this case, in the sense that a reduction in the input would be also necessary in order to improve Technical Efficiency.
In the second Merge (South) the opposite was observed, since the resulting company became a benchmark both in Technical and Scale Efficiencies.
Table 4 – South’s efficiency results after Merger (%)
DMU’s BCC CCR Scale Efficiency
South * 100.0 100.0 100.0
Telesc 100.0 97.2 97.2
Sercomtel 61.9 61.4 99.1
6. Final Remarks
In this work we investigated the relative efficiency of telephone companies using Data Envelopment Analysis, a tool that can be used by ANATEL as additional support in its continuous task of evaluating the performance of the companies currently providing Landline Telephone Services in Brazil. Our results enabled us to put in evidence, for instance, the companies that could be considered candidates for an eventual reward by ANATEL, such as the concession to explore other areas. We also illustrated how to estimate the potential efficiency improvement through the simulation of corporate merger.
Acknowledgements
The authors would like to present their acknowledgments to ANATEL and Fapesp, through Research Grant Number 99/10081-9.
References
(1) Allen, R.; Athanassopoulos, A.; Dyson, R.G. & Thanassoulis, E. (1997). Weights
restrictions and value judgements in Data Envelopment Analysis. Annals of Operations
Research, 73, 14-25.
(2) Almeida, H.R. & Milioni, A.Z. (2000). Análise de Envoltória de Dados na Decisão de
Concessão de Crédito. Anais do XXXII SBPO – Simpósio Brasileiro de Pesquisa
Operacional, Viçosa, MG, 636-649.
(3) Banker, R.D.; Charnes, A. & Cooper, W.W. (1984). Some Models for Estimating
Technical and Scale Inefficiencies in Data Envelopment Analysis. Management
Science, 30, 1078-1092.
(4) Charnes, A.; Cooper, W.W. & Rhodes, E. (1978). Measuring the efficiency of decision making units. European Journal of Operational Research, 2, 429-444.
(5) Cooper, W.W.; Seiford, L.M. & Tone, K. (2000). Data Envelopment Analysis: A
comprehensive Text with Models, Applications, References and DEA – Solver Software. Kluwer Academic, Boston.
(6) Farrel, M.J. & Fieldhouse, M. (1962). Estimating efficient production functions under increasing returns to scale. Journal of the Royal Statistical Society, Series A, 252-267. (7) Milioni, A.Z. (2001-a). Relatório Trimestral de Análise dos Resultados da Prestação do
STFC, Período Outubro a Dezembro de 2000. Relatório Interno do Departamento de Organização (IEMB) do Instituto Tecnológico de Aeronáutica (ITA), São José dos Campos, SP.
(8) Milioni, A.Z. (2001-b). Relatório Comparativo dos Balanços das Prestadoras do STFC, Ano 2000. Relatório Interno do Departamento de Organização (IEMB) do Instituto Tecnológico de Aeronáutica (ITA), São José dos Campos, SP.
(9) Plano Geral de Metas de Qualidade para o STFC (Serviço Telefônico Fixo Comutado). Resolução No. 30 da ANATEL, 29 de Junho de 1998.
(10) Plano Geral de Metas de Universalização para o STFC (Serviço Telefônico Fixo Comutado). Decreto No. 2592 de 15 de Maio de 1998.
Appendix
Table 1A – Model 1 Data
DMU’s L PT AI MN P AS
1 Telerj 13,707 99,951 3,692,804 66,715 898,157 3,348,768 2 Telemig 10,947 73,407 2,895,328 104,585 650,575 2,746,105
3 CTBC Telecom (MG) 2,373 7,465 464,154 17,858 83,923 362,485 4 Telest 1,837 16,690 561,042 25,006 133,454 503,880
5 Telebahia 4,785 54,439 1,406,159 93,584 289,541 1,302,615 6 Telergipe 314 6,776 170,519 8,366 32,158 159,206 7 Telasa 256 11,681 251,350 6,268 45,267 227,226
8 Telpe 2,821 41,304 831,171 33,575 129,859 714,117
9 Telpa 686 13,519 328,803 16,296 51,858 293,823 10 Telern 556 12,607 329,721 13,949 58,218 294,634 11 Teleceará 3,030 34,874 791,541 32,330 170,784 761,737
12 Telepisa 649 10,554 246,330 6,971 41,227 236,549 13 Telma 868 15,296 321,770 17,600 58,613 299,971
14 Telepará 1,050 23,521 532,904 20,711 114,351 513,635 15 Teleamapá 220 2,055 71,470 4,379 12,061 69,287
16 Teleamazon 1,039 10,420 315,052 4,470 47,623 301,052 17 Telaima 183 1,602 48,120 1,898 7,402 46,024
18 Telesc 3,461 25,623 1,193,985 92,233 182,877 1,049,553 19 Telepar 10,659 46,327 2,227,874 99,189 382,924 1,710,688
20 Sercomtel 851 2,203 154,499 7,281 37,475 139,190 21 Telems 2,633 10,550 472,702 9,766 36,771 387,969
22 CTBC Telecom (MS) 44 163 7,788 165 1,629 6,143 23 Telemat 1,950 13,745 451,478 18,020 80,212 328,261
24 Telegoiás 4,859 38,487 1,155,173 71,272 226,598 957 25 CTBC Telecom (GO) 86 588 30,402 1,194 4,391 22,076
26 Telebrasília 3,278 20,175 884,852 20,617 199,460 749,120 27 Teleron 718 6,345 253,011 9,766 36,771 180,469
28 Teleacre 313 2,924 93,604 1,815 11,903 68,330 29 CRT 9,731 53,347 2,101,056 222,006 404,249 1,826,485
30 CTMR 469 2,015 120,935 3,492 23,321 99,406 31 Telesp 49,550 223,445 11,185,983 487,631 2,289,167 9,413,366
32 Ceterp 1,307 3,017 217,837 6,483 47,654 184,837 33 CTBC Telecom (SP) 374 2,784 209,829 10,429 35,251 164,842
Table 2A – Model 2 Data (Quality)
Jul/98 Dez/00
(TR) %
(PT) %
(EC) /1000
(LC) %
(TD) %
(TR) %
(PT) %
(EC) /1000
(LC) %
(TD) %
Telerj 7.1 17.9 11.1 58.4 52.4 4.6 10.8 7.1 17.9 11.1 Telemig 2.8 24.0 5.9 60.4 68.5 2.6 11.0 2.8 24.0 5.9 Telest 2.8 22.0 9.1 55.7 77.7 2.6 10.8 2.8 22.0 9.1 Telebahia 1.9 7.5 5.4 61.6 79.3 2.8 11.1 1.9 7.5 5.4 Telergipe 4.7 34.0 10.0 46.4 58.9 2.3 11.7 4.7 34.0 10.0 Telasa 4.9 27.0 4.2 46.6 60.5 2.4 10.6 4.9 27.0 4.2
Telpe 6.2 33.1 7.6 53.8 78.0 4.5 8.4 6.2 33.1 7.6 Telpa 6.7 44.5 5.4 54.5 73.4 4.5 10.5 6.7 44.5 5.4 Telern 3.5 19.3 10.7 54.7 75.5 2.2 8.5 3.5 19.3 10.7 Teleceará 3.4 20.2 11.4 56.8 75.5 2.2 8.5 3.4 20.2 11.4 Telepisa 2.4 24.4 6.9 53.6 61.5 2.2 12.4 2.4 24.4 6.9 Telma 4.8 25.3 6.3 44.4 87.3 2.8 8.7 4.8 25.3 6.3 Telepará 7.0 19.0 12.8 47.7 88.3 3.8 9.9 7.0 19.0 12.8 Teleamapá 7.2 22.7 26.3 45.3 97.0 2.3 6.7 7.2 22.7 26.3 Teleamazon 6.8 12.8 9.0 41.3 67.7 2.1 9.6 6.8 12.8 9.0
Telaima 3.7 18.7 5.3 50.0 72.8 1.4 6.0 3.7 18.7 5.3 CTBC Telecom MG 1.9 19.0 8.2 62.8 53.0 1.9 8.6 1.9 19.0 8.2 Telebrasília 2.2 4.1 6.5 50.4 69.0 2.6 8.8 2.2 4.1 6.5 CTMR 3.1 34.3 8.7 56.3 97.5 1.2 5.4 3.1 34.3 8.7 Telesc 3.1 20.0 3.0 52.3 88.0 2.1 7.8 3.1 20.0 3.0 Telepar 3.0 28.9 8.7 62.1 60.3 2.1 8.6 3.0 28.9 8.7 Telems 3.6 32.2 7.7 58.3 77.5 1.5 10.1 3.6 32.2 7.7 Telemat 6.0 32.0 9.0 69.1 80.5 2.0 12.4 6.0 32.0 9.0 Telegoiás 2.7 34.5 5.5 57.6 74.3 2.4 13.0 2.7 34.5 5.5
Teleron 5.1 19.8 69.0 53.2 73.0 2.3 12.1 5.1 19.8 69.0 Teleacre 5.5 26.1 11.5 54.5 77.4 2.3 9.6 5.5 26.1 11.5 CRT 8.6 27.3 33.7 53.5 6.9 2.4 7.3 8.6 27.3 33.7 Sercomtel 2.6 80.0 6.5 63.1 78.3 2.0 5.5 2.6 80.0 6.5 CTBC Telecom MS 0.6 13.9 4.8 88.7 81.5 2.2 8.7 0.6 13.9 4.8 CTBC Telecom GO 1.7 14.1 7.2 60.6 47.4 1.0 5.6 1.7 14.1 7.2 Telesp 2.9 24.2 8.1 56.7 64.8 2.3 5.8 2.9 24.2 8.1 Ctbcampo 4.3 8.1 8.0 65.5 62.2 1.9 10.1 4.3 8.1 8.0 Ceterp 4.0 63.8 3.1 60.2 69.2 1.2 5.2 4.0 63.8 3.1
Table 3A – Model 2 Data (Universality)
FA 98 PT 98 FA 00 PT 00
Telerj 1,927,000 65,600 3,692,804 99,951
Telemig 1,811,000 48,825 2,895,328 73,407
CTBC Telecom (MG) 273,643 4,427 464,154 7,465
Telest 292,283 9,880 561,042 16,690
Telebahia 819,395 32,200 1,406,159 54,439
Telergipe 93,879 3,295 170,519 6,776
Telasa 136,798 4,142 251,350 11,681
Telpe 411,043 26,327 831,171 41,304
Telpa 202,252 7,959 328,803 13,519
Telern 124,174 4,792 329,721 12,607
Teleceará 534,098 22,000 791,541 34,874
Telepisa 133,886 4,975 246,330 10,554
Telma 182,781 6,381 321,770 15,296
Telepará 266,179 8,679 532,904 23,521
Teleamapá 40,216 910 71,470 2,055
Teleamazon 157,118 4,880 315,052 10,420
Telaima 28,633 722 48,120 1,602
Telesc 609,716 15,360 1,193,985 25,623
Telepar 1,029,415 27,596 2,227,874 46,327
Sercomtel 110,837 1,372 154,499 2,203
Telems 233,875 5,400 472,702 10,550
CTBC Telecom (MS) 4,787 53 7,788 163
Telemat 231,031 8,617 451,478 13,745
Telegoiás 542,197 19,200 1,155,173 38,487
CTBC Telecom (GO) 15,045 372 30,402 588
Telebrasília 566,511 8,263 884,852 20,175
Teleron 82,125 2,668 253,011 6,345
Teleacre 36,000 753 93,604 2,924
CRT 1,194,000 32,552 2,101,056 53,347
CTMR 79,951 1,287 120,935 2,015
Telesp 5,294,217 156,599 11,185,983 223,445
Ceterp 154,600 1,924 217,837 3,017
CTBC Telecom (SP) 105,761 1,337 209,829 2,784
Table 4A – Data of 30 Companies after Merger
L PT AI MN P AS
Telerj 13,707 99,951 3,692,804 3,348,768 66,715 898,157 Telemig 10,947 73,407 2,895,328 2,746,105 104,585 650,575
Telest 1,837 16,690 561,042 503,880 25,006 133,454 Telebahia 4,785 54,439 1,406,159 1,302,615 93,584 289,541
Telegirpe 314 6,776 170,519 159,206 8,366 32,158 Telasa 256 11,681 251,350 227,226 6,268 45,267 Telpe 2,821 41,304 831,171 714,117 33,575 129,859
Telpa 686 13,519 328,803 293,823 16,296 51,858
Telern 556 12,607 329,721 294,634 13,949 58,218 Teleceará 3,030 34,874 791,541 761,737 32,330 170,784 Telepisa 649 10,554 246,330 236,549 6,971 41,227 Telma 868 15,296 321,770 299,971 17,600 58,613 Telepará 1,050 23,521 532,904 513,635 20,711 114,351 Teleamapá 220 2,055 71,470 69,287 4,379 12,061 Teleamazon 1,039 10,420 315,052 301,052 4,470 47,623
Telaima 183 1,602 48,120 46,024 1,898 7,402
Telepar 10,659 46,327 2,227,874 1,710,688 99,189 382,924
Telems 2,633 10,550 472,702 387,969 9,766 36,771 Telemat 1,950 13,745 451,478 328,261 18,020 80,212 Telegoiás 4,859 38,487 1,155,173 957,000 71,272 226,598 Telebrasília 3,278 20,175 884,852 749,120 20,617 199,460 Teleron 718 6,345 253,011 180,469 9,766 36,771 Teleacre 313 2,924 93,604 68,330 1,815 11,903 CRT 9,731 53,347 2,101,056 1,826,485 222,006 404,249
CTMR 469 2,015 120,935 99,406 3,492 23,321
Telesp 49,550 223,445 11,185,983 9,413,366 487,631 2,289,167