Use of densimetric table to improve the quality
of commercial castor bean seeds
1Antônio Lucrécio dos Santos Neto
2*, Maria Laene Moreira de Carvalho
3,
João Almir Oliveira
3, Antônio Carlos Fraga
3, Ademária Aparecida de Souza
2ABSTRACT - Castor bean fruits are already used for biodiesel production but obtaining quality seeds is still a challenge. Seed cleaning improves lot quality but little is known about the effects of upgrading castor bean seed lots on a densimetric table. The objective of this study was to evaluate the influence of cleaning castor bean seed lots on a densimetric table on their physical, physiological and sanitary characteristics. Two commercial lots of the AL Guarani 2002 cultivar, separated into five categories according to their classification on a densimetric table (uncleaned and low, low intermediate, high intermediate and high outlets), were evaluated. Tests for the yield, one-thousand seed weight, germination, seedling emergence, electrical conductivity and seed health were performed. The classification of castor bean seeds on a densimetric table significantly improved the physical, physiological and sanitary quality of commercial seed lots. The physiological response of the different classified lots varied according to their initial weight. Castor bean seeds separated on a densimetric table for the upper outlet showed a better physical, physiological and sanitary quality compared to those for the lower outlet.
Index terms: Ricinus communis L., cleaning, germination, vigor, seed health.
Uso da mesa densimétrica na melhoria da qualidade
de sementes comerciais de mamona
RESUMO - O uso de bagas de mamona para a produção de biodiesel já é realidade, entretanto, a obtenção de sementes de qualidade ainda é um desafio. O beneficiamento de sementes é uma etapa da produção que visa aprimorar a qualidade do lote, no entanto, pouco se conhece sobre os efeitos do aprimoramento de lotes de sementes de mamona em mesa densimétrica. O trabalho foi realizado com objetivo de avaliar a influência do beneficiamento de lotes de sementes de mamona em mesa densimétrica nos seus atributos físicos, fisiológicos e sanitários. Foram utilizados dois lotes comerciais da cultivar AL Guarany 2002 estratificados em cinco categorias de acordo com sua classificação em mesa densimétrica (alimentação e descargas inferior, inferior intermediária, superior intermediária e superior). Avaliaram-se: rendimento, peso de mil sementes, germinação, emergência de plântulas, condutividade elétrica e teste de sanidade. A classificação de sementes de mamona em mesa densimétrica melhora a qualidade física, fisiológica e sanitária de lotes comerciais. A resposta fisiológica dos diferentes lotes de sementes de mamona à classificação varia em função de sua densidade inicial. As sementes de mamona classificadas em mesa densimétrica na descarga superior apresentam melhor qualidade física, fisiológica e sanitária em relação àquelas provenientes da descarga inferior.
Termos para indexação: Ricinus communis L., beneficiamento, germinação, vigor, sanidade.
1Submitted on 07/15/2011. Accepted for publication on 06/29/2012.
2Universidade Federal de Alagoas, 57340-970-Arapiraca, AL, Brasil.
3Departamento de Agricultura, UFLA, Caixa Postal 3037, 37200-000-Lavras,
MG, Brasil.
Introduction
The increase in carbon dioxide emissions in the world and the possible exhaustion of petroleum reserves has resulted in more research and development programs on biomass and energy production, besides the development of raw materials for the chemical industry, as part of a potentially sustainable economy (Silva and Freitas, 2008).
Alternative energy sources drive the development of “clean” energy and place Brazil in an outstanding position due to the country’s favorable edaphoclimatic conditions, extensive territory and a variety of plants to grow. The castor bean plant produces oil, which is a raw material for biodiesel production (Holanda, 2004), a fuel derived from animal or plant materials, or for use in the chemical industry (Freire, 2001).
Castor bean seeds have a high oil content and yield (Azevedo and Lima, 2001; Savy Filho, 2005), but could potentially produce more considering that mean productivity for the last crop was only 633 kg.ha-1 (Brasil, 2011).
The use of high quality seeds is a basic requisite for a profitable and productive agriculture. The physiological quality of commercial seeds starts in the seed production field and they must be cleaned to improve the physical characteristics of lots. (Fessel et al., 2003; Giomo et al., 2004). During the cleaning of seed lots, undesirable materials are eliminated and the seeds are classified according to their size and weight, resulting in lots with uniform characteristics. However, the use of all the available resources in a Cleaning Unit, such as the densimetric table, which separates seeds according to their weight, has been uncommon for castor bean seeds (Martins et al., 2005).
Most commercial lots of castor bean seeds have a uniform width, depth and length but little is known about how weight influences seed quality. The separation of seeds on a densimetric table has been efficient for improving the seed lot quality of various species (Nascimento et al., 1994; Possenti et al., 1997; Alexandre and Silva, 2000; Fantinatti et al., 2002; Gadotti et al., 2006; Mertz et al., 2007).
The objective of this study was to evaluate the physical, physiological and sanitary quality of commercial seed lots of castor bean (Ricinuscommunis L.) collected in different fractions from the densimetric table.
Material and Methods
The present study was done in the Seed Analysis Laboratory and Seed Unit of the Agricultural Department, and in the Seed Pathology Laboratory of the Phytopathology
Department, of the Federal University of Lavras, between April and August 2007.
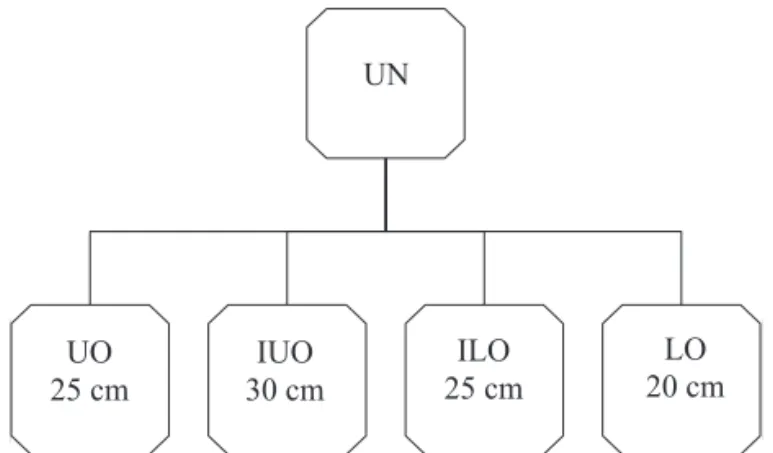
Castor bean seeds of the AL Guarani 2002 cultivar, from two commercial lots collected in the 2005/2006 (lot 1) and 2006/2007 (lot 2) crop years were used, with water contents of 6.7% and 6.5% respectively. The seeds were cleaned on a regulated, rectangular densimetric table and the lots classified into different categories, which constituted the treatments. Ten samples were taken at regular intervals during the seed flow on the densimetric table and repeated three times for uncleaned seed (control) and for the lower, lower intermediate, upper intermediate and upper outlets (Figure 1).
AL
DS
25cm
DSI
30cm
DII
25cm
DI
20cm
UO25 cm
IUO 30 cm
ILO 25 cm
LO 20 cm UN
Figure 1. Classification of castor bean seeds on a densimetric table for uncleaned (UN); upper output (UO); intermediate upper output (IUO); intermediate lower output (ILO); lower output (LO).
During the process and after reduction of the samples in a Gamet type homogenizer the following parameters were measured:
Participation in the outlets and yield: after the seeds,
the participation of each outlet in the total seed weight was determined as a percentage (weight/weight) and also the total yield of the cleaned seeds in kg.h-1 on a densimetric table.
Weight of one thousand seeds: the weight of one
thousand seeds was calculated by separating eight sub-samples of 100 seeds at random with the results being expressed in grams (Brasil, 2009).
Germination test: this test was done with eight replications
of 25 seeds per plot on rolls of germitest-type paper, moistened with a volume of water equivalent to 2.5 times the dry weight of the substrate. The rolls were kept in a germinator, without a regular photoperiod, at 25 °C. Counts were made 7 and 14 days after sowing and the results expressed as a percentage of the normal seedlings (Brasil, 2009).
by noting the percentages of normal seedlings seven days after sowing. The results were expressed as a percentage of normal seedlings.
Seedling emergence: 200 seeds were evaluated per
treatment, divided into four replications. The seeds were sown in a 10.0 x 1.0 m bed, with 0.05 m spacing within rows and 0.07 m between rows. The percentage of emerged seedlings was calculated 21 days after sowing.
Initial stand: determined with seedling emergence by
analyzing the percentage of emerged seedlings with their cotyledons above the soil surface, 14 days after the test began.
Electrical conductivity: the bulk conductivity test was
made using four replications of 25 seeds, carefully weighed to two decimal places and placed for imbibition in 300 mL plastic cups containing 75 mL of deionized water (< 2.0 μmhos.cm-1 of conductivity). They were then kept in a BOD
at a constant temperature of 25 °C for six hours (Souza et al., 2009). After this period, the electrical conductivity of the solution was measured by reading off the values from a Digimed CD-21 conductivity meter and the results were expressed as μS.cm-1.g-1.
Seed health test: itwas made by the incubation method
on filter paper without freezing (Neergaard, 1979), with eight replications of 25 seeds per plot. The seeds were distributed on a 15 cm diameter Petri dish containing three sheets of filter paper previously sterilized and moistened in a solution of 2,4-D. The seeds were incubated at 20 ± 2 °C in a chamber with a 12 hour light and dark photoperiod for seven days. A stereoscopic and optical microscopes were used to identify pathogens on the seeds. Incidence was evaluated as a percentage of the seeds with fungi.
Statistical analysis: the experimental design was a
completely random factorial, evaluating lots (1 and 2) and seed classes (uncleaned and upper, intermediate upper, intermediate lower and lower outlets) obtained after on a densimetric table. The R (R Development Core Team, 2007) and SISVAR (Ferreira, 2011) softwares used were to verify the basic assumptions of the variance analysis and compare means by the Scott-Knott test at the 5% probability level.
Results and Discussion
The percentage seed distribution of both castor bean lots according to the outlets and collection on the densimetric table is shown in Figure 2. Most seeds were from the upper outlets, with the total of those belonging to the upper (UO) and intermediate upper outlets (IUO) being 65% and 76% for lots 1 and 2, respectively. The percentage of seeds classified
on the densimetric table for both lots for the upper outlet was significantly higher than for the other outlets (Figure 2).
a
d
b
c b
b
c a
36.0%
29.0%
26.0%
9.0%
48.0%
28.0%
18.0%
6.0%
UO IUO ILO LO
1 Batches 2
Figure 2. Percentage of castor bean seeds in the outputs for two lots of castor bean seeds classified on a densimetric table for the upper output (UO); intermediate upper output (IUO); intermediate lower output (ILO); lower output (LO).
Means followed by the same letter within each lot do not differ between
themselves at the 5% significance level using the Scott-Knott test.
However, the seeds distributed to the lower outlet (LO) in lots 1 and 2 were a mean 7.5%, which was a higher value than those observed for other crops, such as dry beans – 6.6% (Buitrago et al., 1991), blue lupins – 6.0% (Ahrens and Krzyzanowski, 1998) and tobacco – 6.0% (Gadotti et al., 2011), which these authors considered as rejects.
The total yield of the densimetric table for lots 1 and 2 was 843.3 kg.h-1 and 870.9 kg.h-1 respectively, representing
data which were virtually unknown for cleaning castor bean seeds on a densimetric table.
The thousand seed weight (PMS) as a function of the lot and class of cleaned seed on a densimetric table is shown in Table 1. Both lots showed a higher thousand seed weight for seeds collected from the upper outlets. The seeds from the upper outlet (UO) of lot 1 were 109.1 g (28.6%) heavier than those from the lower outlet (LO). The stratification of the classes for lot 2 was significantly more for those seeds collected from the upper outlet, with a weight increase of 44.7 g (12.2%) compared to the uncleaned seeds (UN). It was possible to see a statistically significant stratification by weight within this lot for the different seed classes from the outlets of the densimetric table, demonstrating the efficiency of the gravitational table for separating by weight and/ or density. Gadotti et al. (2012) commented that it was possible to obtain higher quality seeds from those distributed to the upper areas of the densimetric table.
UO IUO ILO LO
36.0%
9.0%
26.0% 29.0%
48.0%
6.0%
28.0%
18.0%
a a
b b
b
c
b d
Lots Class WMS (g)
1 UN 473.2 b
1 UO 490.8 a
1 IUO 489.2 a
1 ILO 461.1 b
1 LO 381.7 c
2 UN 365.2 c
2 UO 409.9 a
2 IUO 387.6 b
2 ILO 321.8 d
2 LO 235.6 e
CV = 2.8%
UN - uncleaned; UO – Upper output; IUO – Intermediate upper output; ILO – Intermediate lower output; LO - Lower output.
Means followed by the same letter in the column do not differ between
themselves at the 5% significance level using the Scott-Knott test.
Lots Class Values (%)
FC GER AI DOR DS
1 UN 42b 46b 21c 26a 3a
1 UO 51a 65a 13d 17a 1a
1 IUO 54a 63a 17c 18a 1a
1 ILO 42b 47b 28b 22a 4a
1 LO 16c 20c 37a 32a 12a
2 UN 28b 37c 21a 27a 10b
2 UO 50a 58a 24a 21a 1b
2 IUO 34b 49a 23a 25a 2b
2 ILO 11c 23b 20a 36a 19b
2 LO 2d 5d 3b 16a 52a
CV (%) 11.8 9.7 11.0 14.9 77.6
Table 1. Mean weights of 1000 seeds (WMS) for two lots of castor bean classified on a densimetric table.
The results from the germination test show that those seeds from the first germination count collected from the highest part of the densimetric table were significantly more vigorous (Table 2). The percentage germination of seeds from the upper outlets was also high compared to the other classifications, demonstrating the efficiency of the table for cleaning castor bean seeds. A comparison of uncleaned seeds with those collected from the upper outlet showed a mean increase for both castor bean seed lots regarding vigor (first germination count) and a germination of 44.3% and 48.2%, respectively. Increases of 10.5% and 17.7% were also obtained for vigor and germination of coffee seeds (Giomo et al., 2004).
The percentage of infected, abnormal seedlings in lot 1 gradually increased in the samples collected from the lower outlets but in lot 2 there was a reduction in those seeds collected from the lower outlet. Cleaning had no effect on the percentage of dormant seeds for either lot. However, the percentage of dead seeds was higher in those samples from the lower outlet of the densimetric table but with a significant difference only for lot 2. According to Carvalho and Nakagawa (2000) and Gadotti et al. (2011), seeds collected from the lower outlet are badly-formed, attacked by fungi and empty, and weighed less and they were efficiently separated on the densimetric table.
The behavior of the initial stand and the emerging seedlings was similar to the seed classification on the densimetric table (Figure 3). There was no difference between those seeds collected from the upper outlets in lot 1 with uncleaned seeds. However, there was an increase in the initial stand and seedling emergence for lot 2 seeds collected from the upper outlet compared to the others, with the seeds being more vigorous and having a higher percentage emergence.
There was a 41.4% and 38.6% increase in the initial stand and seedling emergence respectively for seeds collected from the upper outlet for both lots compared to uncleaned seeds. Gadotti et al. (2006) observed that seed germination and vigor in cabbage-brocolli increased when they originated from the upper outlets of the densimetric table.
Table 2. Mean values for the first germination count (FC), germination (GER), abnormal infected seedlings (AI), dormant (DOR) and dead seeds (DS) for two castor bean seed lots classified on a densimetric table.
UN - uncleaned; UO – Upper output; IUO – Intermediate upper output; ILO – Intermediate lower output; LO - Lower output.
Means followed by the same letter in the column do not differ between
themselves at the 5% significance level using the Scott-Knott test.
(B) (A) Initial Stand (% ) Emergence (% )
Lote 1 Lote 2
0 10 20 30 40 50 60 70 80 90 100
AL DS DSI DII DI
a a a
b c a b c d e
Lote 1 Lote 2
0 10 20 30 40 50 60 70 80 90 100
AL DS DSI DII DI
a a a b c a b c d e UN UO IUO ILO LO
Figure 3. Initial stand (A) and seedling emergence (B) for two lots of castor bean seeds classified on a densimetric table for uncleaned (UN); upper output (UO); intermediate upper output (IUO); intermediate lower output (ILO); lower output (LO).
Means followed by the same letter within each lot do not differ themselves
at the 5% significance level using the Scott-Knott test.
Lots
IUO
UN UO ILO LO (A)
(B)
Initial Stand (%)
Emer
gence (%)
1 2
a a a
El
ec
tri
ca
l c
on
du
ct
iv
ity
(µ
s c
m
-1g -1)
Lote 1 Lote 2
20 22 24 26 28 30 32 34 36 38 40 42 44 46 48 50
AL DS DSI DII DI
Lot 1 Lot 2
Lots
b
b b
b
a
b
c c c a
UN UO IUO ILO LO
Figure 4. Electrical conductivity (µS.cm-1.g-1) of castor
bean seed lots classified on a densimetric table for for uncleaned (UN); upper output (UO); intermediate upper output (IUO); intermediate lower output (ILO); lower output (LO).
Means followed by the same small letter in the categories of output zones of each lot and capital letters between lots do not differ at the 5%
significance level using the Scott-Knott test.
Lots
Lot 1 Lot 2
IUO UO
UN ILO LO
Electrical conductivity (
µs.cm
-1.
g
-1)
a
a b
b b
b
b
c c c 50
48
46 44 42 40
38
36 34 32 30
28
26 24 22 20
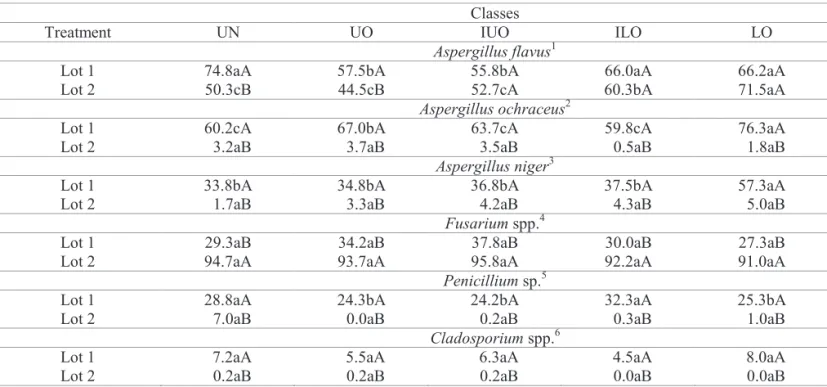
Table 3. Mean percentage fungus incidence on castor bean seed lots classified on a densimetric table.
Classes
Treatment UN UO IUO ILO LO
Aspergillus flavus1
Lot 1 74.8aA 57.5bA 55.8bA 66.0aA 66.2aA
Lot 2 50.3cB 44.5cB 52.7cA 60.3bA 71.5aA
Aspergillus ochraceus2
Lot 1 60.2cA 67.0bA 63.7cA 59.8cA 76.3aA
Lot 2 3.2aB 3.7aB 3.5aB 0.5aB 1.8aB
Aspergillus niger3
Lot 1 33.8bA 34.8bA 36.8bA 37.5bA 57.3aA
Lot 2 1.7aB 3.3aB 4.2aB 4.3aB 5.0aB
Fusarium spp.4
Lot 1 29.3aB 34.2aB 37.8aB 30.0aB 27.3aB
Lot 2 94.7aA 93.7aA 95.8aA 92.2aA 91.0aA
Penicillium sp.5
Lot 1 28.8aA 24.3bA 24.2bA 32.3aA 25.3bA
Lot 2 7.0aB 0.0aB 0.2aB 0.3aB 1.0aB
Cladosporium spp.6
Lot 1 7.2aA 5.5aA 6.3aA 4.5aA 8.0aA
Lot 2 0.2aB 0.2aB 0.2aB 0.0aB 0.0aB
1C.V.= 12.0%; 2C.V.= 23.8%; 3C.V.= 22.3%; 4C.V.= 8.6%; 5C.V.= 21.7%; 6C.V.= 68.4%;
UN - uncleaned; UO – Upper output; IUO – Intermediate upper output; ILO – Intermediate lower output; LO - Lower output.
Means followed by the same small letter in the rows and capital letters in the columns do not differ between themselves at the 5% significance level
using the Scott-Knott test.
The seed lots were easily separated by the electrical conductivity test (Figure 4), where values for the older lot (lot 1) – 2005/2006 crop – were significantly higher compared to those for the newer lot (No. 2) – 2006/2007 crop, independently of the seed weight. Seed cell membranes become unstructured with storage time, consequently increasing deterioration and product leaching. Souza et al. (2009) obtained identical results when differentiating seed lots from two castor bean cultivars using the electrical conductivity test.
Seed weight also affected the quantity of leachates with generally higher electrical conductivity values observed for lighter seeds, which may have been related to low seed quality. In the lot 2 seeds, leachate volumes increased from 21.18 µS.cm-1.g-1 to 40.15 µS.cm-1.g-1 for seeds collected at
the highest and lowest outlets respectively. Similar results with cowpea seeds of different genotypes were described by Mertz et al. (2007), where the electrical conductivity values of seeds from the higher and lower outlets varied from 24.37 µS.cm-1.g-1 to 35.17 µS.cm-1.g-1, respectively.
The results of the mean incidence of fungi on castor bean seeds (Table 3) indicated a high percentage of contamination by Aspergillus spp., Fusarium spp. and
Penicillium spp., also described by Souza et al. (2009) for
the seeds of two cultivars of the same species. Aspergillus
flavus was commoner in more than 50% of both lots.
directing of contaminated seeds to the lower outlet may be associated with the parasitic action of pathogens on the seeds resulting in the consumption of part of the dry matter and, consequently, leaving them lighter (Amaral et al., 1984).
Although Fusarium spp. and Cladosporium spp. were found on the castor bean seeds, cleaning on a densimetric table did not affect fungal incidence in contrast to the results obtained by Bicca et al. (1998) with rice seeds, where the former fungus was significantly reduced on those seeds collected from the upper outlet of the table. However, the percentage of fungi present on the castor bean seeds varied, with lot 1 having a higher percentage of Cladosporium spp., whereas Fusarium spp. predominated in lot 2, demonstrating a difference in lot sanitary. The greater presence of Fusarium
spp. in lot 2 coincided with a reduction in the incidence of other fungi, such as A. ocrhaceus, A.niger, Penicillium sp. and
Cladosporium spp. (Table 3). This result can also be explained
by the storage time since the seeds from lot 2 were harvested a year after those from lot 1.
Conclusions
The classification of castor bean seeds on a densimetric table significantly improved the physical and physiological quality of commercial lots.
The physiological response of the different classified lots of castor bean seeds varied according to their initial weight.
Castor bean seeds classified in the upper outlet of the densimetric table have a higher physical, physiological and sanitary quality compared to those discharged lower down.
References
AHRENS, D.C.; KRZYZANOWSKI, F.C. Efeito do beneficiamento de sementes de tremoço azul sobre suas qualidades física, fisiológica
e sanitária. Scientia Agrícola, v.55, n.2, p.242-248, 1998. http://www.
scielo.br/scielo.php?script=sci_arttext&pid=s0103-90161998000200012
ALEXANDRE, A.D.; SILVA, W.R. Mesa gravitacional e qualidade física
de sementes de ervilhaca-comum (Vicia sativa L.). Revista Brasileira de Sementes, v.22, n.2, p.223-230, 2000. http://www.abrates.org.br/revista/ artigos/2000/v22n2/artigo30.pdf
AMARAL, A.S.; BICCA, L.H.; WOBETO, L.A. Classificação de
sementes de ervilha. Lavoura Arrozeira, v.37, n.348, p.32-35, 1984.
AZEVEDO, D.M.P.; LIMA, E.F. O agronegócio da mamona no Brasil.
Brasília, DF: EMBRAPA Informação Tecnológica, 2001. 212p.
BICCA, F.M.; BAUDET, L.; JAIMEZIMMER, G. Separação de
sementes manchadas de lotes de sementes de arroz, utilizando a mesa de
gravidade e sua influência na qualidade sanitária. Revista Brasileira de Sementes, v.20, n.1, p.106-111, 1998. http://www.abrates.org.br/revista/
artigos/1998/v20n1/artigo19.pdf
BRASIL. Ministério da Agricultura, Pecuária e Abastecimento.
Regras para análise de sementes. Ministério da Agricultura, Pecuária e Abastecimento. Secretaria de Defesa Agropecuária. Brasília, DF:
MAPA/ACS, 2009. 395p. http://www.agricultura.gov.br/arq_editor/ file/laborat%c3%b3rio/sementes/regras%20para%20analise%20de%20
sementes.pdf
BRASIL. Ministério do Planejamento, Orçamento e Gestão. Instituto
Brasileiro de Geografia e Estatística. Levantamento Sistemático da Produção Agrícola. 2010. Disponível: http://www.ibge.gov.br/home/
estatistica/indicadores/agropecuaria/lspa/lspa_201010.pdf. Acesso em:
15 nov. 2011.
BUITRAGO, I.C.; VILLELA, F.A.; TILLMANN, M.A.; SILVA, J.B. Perdas de qualidade de sementes de feijão beneficiadas em máquina
de ventiladores e peneiras e mesa de gravidade. Revista Brasileira de Sementes, v.13, n.2, p.99-104, 1991. http://www.agrolink.com.br/
downloads/81552.pdf
CARVALHO, N.M.; NAKAGAWA, J. Sementes: ciência, tecnologia e
produção. 4.ed. Jaboticabal: FUNEP, 2000. 588p.
FANTINATTI, J.B.; HONÓRIO, S.L.; RAZERA, L.F. Qualidade de
sementes de feijão de diversas densidades obtidas na mesa gravitacional.
Revista Brasileira de Sementes, v.24, n.1, p.24-32, 2002. http://www. scielo.br/pdf/rbs/v24n1/v24n1a05.pdf
FERREIRA, D.F. Sisvar: a computer statistical analysis system. Revista Ciência e Agrotecnologia, v.35, n.6, p.1039-1042, 2011. http://www. scielo.br/pdf/cagro/v35n6/a01v35n6.pdf
FESSEL, S.A.; SADER, R.; PAULA, R.C.; GALLI, J.A. Avaliação da qualidade física, fisiológica e sanitária de sementes de milho durante o beneficiamento. Revista Brasileira de Sementes, v.25, n.2, p.70-76, 2003. http://www.scielo.br/pdf/rbs/v25n2/19651.pdf
FREIRE, R.M.M. Ricinoquímica. In: AZEVEDO, D.M.P.; LIMA, E.F. O agronegócio da mamona no Brasil. Brasília, DF: EMBRAPA Informação
Tecnológica, 2001. cap.13, p.295-336.
GADOTTI, G.I.; CÔRREA, C.L.; LUCCA FILHO, O.A.; VILLELA, F.A. Qualidade de sementes de couve-brócolis beneficiadas em mesa
densimétrica. Revista Brasileira de Sementes, v.28, n.2, p.123-127, 2006.
http://www.scielo.br/pdf/rbs/v28n2/a16v28n2.pdf
GADOTTI, G.I.; VILLELA, F.A.; BAUDET, L. Influência da mesa
densimétrica na qualidade de sementes de cultivares de tabaco. Revista Brasileira de Sementes, v.33, n.2, p.372-378, 2011. http://www.scielo.br/
pdf/rbs/v33n2/20.pdf
GADOTTI, G.I.; BAUDET, L.; VILLELA, L. Several regulations in
v.32, n.2, p.361-368, 2012. http://www.scielo.br/pdf/eagri/v32n2/
a16v32n2.pdf
GIOMO, G.S.; RAZERA, L.F.; GALLO, P.B. Beneficiamento e
qualidade de sementes de café arábica. Bragantia, v.63, n.2, p.291-297,
2004. http://www.scielo.br/pdf/brag/v63n2/21378.pdf
HOLANDA, A. Biodiesel e inclusão social. Brasília, DF: Câmara dos
Deputados, 2004. 200p. (Série Caderno de Altos Estudos, 1).
MARTINS, G.N.; SILVA, R.F.; ARAÚJO, E.F.; PEREIRA, M.G.; VIEIRA, H.D.; VIANA, A.P. Influência do tipo de fruto, peso específico das sementes e período de armazenamento na qualidade fisiológica de
sementes de mamão do grupo formoso. Revista Brasileira de Sementes,
v.27, n.2, p.12-17, 2005. http://www.scielo.br/pdf/rbs/v27n2/a03v27n2.pdf
MERTZ, L.M.; HENNING, F.A.; MAIA, M.S.; MENEGHELLO, G.E.; HENRIQUES, A.; MADAIL, R. Qualidade fisiológica e sanitária de sementes de feijão-miúdo beneficiadas em mesa gravitacional. Revista Brasileira de Sementes, v.29, n.3, p.1-8, 2007. http://www.scielo.br/pdf/
rbs/v29n3/a01v29n3.pdf
NASCIMENTO, W.M.; PESSOA, H.B.S.V.; BOITEUX, L.S. Qualidade fisiológica de sementes de milho-doce submetidas a diferentes processos de colheita, debulha e beneficiamento. Revista Brasileira de Sementes,
v.29, n.8, p.1211-1214, 1994. http://webnotes.sct.embrapa.br/pdf/
pab1994/agosto/pab05ago94.pdf
NEERGAARD, P. Seed pathology. 2.ed. London: MacMillan, 1979. v.1,
839p.
POSSENTI, J.C.; VILELLA, F.A.; ZIMMER, G.J. Eficiência das máquinas no beneficiamento de sementes de trigo para remoção de
sementes de aveia-preta. Pesquisa Agropecuária Brasileira, v.32,
n.8, p.1-11, 1997. http://seer.sct.embrapa.br/index.php/pab/article/ view/4718/7319
R DEVELOPMENT CORE TEAM. R: a language and environment for statistical computing. R Foundation for Statistical Computing, 2007. Disponível: http://www.r-project.org. Acesso em: dez. 2011.
SAVY FILHO, A. Mamona tecnologia agrícola. Campinas: EMOPI, 2005. 105p.
SILVA, P.R.F.; FREITAS, T.S.F. Biodiesel: o ônus e o bônus de se
produzir combustível.Ciência Rural, v.38, n.3, p.843-851, 2008. http://
www.scielosp.org/pdf/cr/v38n3/a44v38n3.pdf
SOUZA, L.A.; CARVALHO, M.L.M.; KATAOKA, V.Y.; OLIVEIRA,