Excavation of attractor modules for nasopharyngeal
carcinoma via integrating systemic module inference
with
attract
method
T. Jiang, C.-Y. Jiang, J.-H. Shu and Y.-J. Xu
Department of Otolaryngology Head and Neck Surgery, The First Affiliated Hospital of Bengbu Medical College, Bengbu, Anhui Province, China
Abstract
The molecular mechanism of nasopharyngeal carcinoma (NPC) is poorly understood and effective therapeutic approaches are needed. This research aimed to excavate the attractor modules involved in the progression of NPC and provide further understanding of the underlying mechanism of NPC. Based on the gene expression data of NPC, two specific protein-protein interaction networks for NPC and control conditions were re-weighted using Pearson correlation coefficient. Then, a systematic tracking of candidate modules was conducted on the re-weighted networks via cliques algorithm, and a total of 19 and 38 modules were separately identified from NPC and control networks, respectively. Among them, 8 pairs of modules with similar gene composition were selected, and 2 attractor modules were identified via theattractmethod. Functional analysis indicated that these two attractor modules participate in one common bioprocess of cell division. Based on the strategy of integrating systemic module inference with theattractmethod, we successfully identified 2 attractor modules. These attractor modules might play important roles in the molecular pathogenesis of NPC via affecting the bioprocess of cell division in a conjunct way. Further research is needed to explore the correlations between cell division and NPC.
Key words: Nasopharyngeal carcinoma; Protein-protein interaction;Attract; Module; Cell division
Introduction
Nasopharyngeal carcinoma (NPC), a malignant tumor of the nasopharynx, has a strong geographical distribution with a high incidence in Southern China (1). Despite advances in technology and improved treatment outcome of NPC, local recurrence still represents a major mode of failure particularly in patients with locally advanced disease (2). A combination of factors, including viral, environmental and hereditary, has been indicated to be associated with NPC (3). However, the understanding of NPC at the genetic level is poor and effective therapeutic approaches are needed.
Complex human diseases, such as cancers, are caused by dysregulations of biological networks (4). During the past few years, high-throughput experimental technologies and large amounts of protein-protein interaction (PPI) data made it possible to study proteins systematically (5). As is known, functionally related genes are frequently co-expressed across various organisms constituting conserved transcrip-tion modules (6), where modules are groups of genes whose expression profiles are highly correlated across the samples (7). The established methods now begin with
identifying differentially expressed genes (DEGs) between two conditions, and then performing a functional analysis to identify the disease-related genes (8). However, this often restricts the analyses to well-annotated biological processes.
Attract, proposed by Mar et al. (9), is a knowledge-driven analytical approach for identifying and annotating the gene-sets that best discriminate between different cell phenotypes. This method conducts analysis on the biologically related modules that differentiate the pheno-types, and the modules are regarded as attractors. The
attract method can find meaningful, discriminatory gene sets between different cell phenotypes, not restricted to the well-annotated genes.
Therefore, in this paper, to further reveal the mecha-nism of NPC, systemic analysis was conducted on gene expression profile of NPC via integrating systemic module inference. The attract method was applied to determine the attractor modules that were identified by the clique-merging algorithm. The results might indicate potential biomarkers for early diagnosis and therapy of NPC, and
Correspondence: C.-Y.Jiang:<[email protected]>
give insight to reveal the pathological mechanism under-lying this disease.
Material and Methods
Data recruitment and preprocessing
Prior to analysis, data recruitment was conducted from ArrayExpress database (http://www.ebi.ac.uk/arrayexpress/). The gene expression profile of NPC, with accessing num-ber of E-GEOD-53819, was downloaded to investigate the molecular mechanism of NPC. E-GEOD-53819 is on Agilent-014850 Whole Human Genome Microarray 4x44K G4112F Platform, and is composed of 36 samples (18 NPC primary tumors and 18 non-cancerous nasopharyngeal tissues).
For data preprocessing, Micro Array Suite 5.0 (MAS 5.0) algorithm was used to revise perfect match and mismatch probe values (10). Robust multichip average method (11) and quantile based algorithm (12) were carried out to perform background correction and normalization to elim-inate the influence of nonspecific hybridization. Meanwhile, a gene-filter package was used to discard probes if they could not match any genes. The values from multiple probes mapping to the same gene symbol were averaged. Finally, a total of 11,843 genes were gained for subsequent analysis.
PPI network construction
In the present study, all human PPI relationships were obtained from the Search Tool for the Retrieval of Interacting Genes/Proteins database (STRING, http://string-db.org/). In STRING database, each interaction has a combined score. All of the protein IDs were converted into gene symbols, and IDs that could not mark any genes were removed. Under the threshold value of a combined score X0.8, a PPI network including 5,531 nodes and 22,728 highly correlated interac-tions was constructed. Furthermore, the 11,843 genes in the gene expression profile were mapped to the PPI network, and a new PPI network with 4,985 nodes was established.
PPI network re-weighting
As it is known, the reliabilities of the interactions are reflected by their weights, and the lower the scores of the interactions the more likely are the interactions to be false positives (13). In the present study, the Pearson correla-tion coefficient (PCC) (14) was used to re-weight the new PPI network. The absolute value of the PCC was used as the re-weighted value of the new PPI network. In this case, two specific PPI networks with each edge assigned a re-weighted value were built for NPC and control groups. Furthermore, the p-value of each interaction under the two conditions was detected by the one-sided Student’st-test (15), and interactions whose P-value was o0.05 were exacted out to build the destination network.
Identification of modules
It is known that proteins interact with each other, so they are usually dense modules in PPI networks. In the
present study, the clique algorithm (16) was performed to identify modules from the destination networks for NPC and control groups. Generally speaking, the module mining mainly contained the following two steps:
Identifying maximal cliques. It is well known that the larger the clique, the more nodes it contains and the higher the weights (17). Thus, the maximal clique was selected first in the present study, and the module-identification algorithm in Genelibs (http://www.genelibs. com/gb/index.jsp), which was based on the fast depth-first search with pruning-based algorithm, was utilized to iden-tify maximal clique for case and control groups. The maxi-mal cliques whose nodes wereX4 andp20 remained for further analysis.
Refining of modules. Each clique was assigned a score, which was defined as the weighted interaction density (WID). The WID was calculated according to the following formula:
scoreðKÞ ¼ P
a2K;b2KKða;bÞ
K
j j:ðjKj 1Þ
where K (a, b) is the weight of the interaction betweena
andbcalculated using fast depth-first method. The higher the score, the more important the maximal clique.
Furthermore, the highly overlapped maximal cliques were merged to form a module. The inter-connectivity between two cliques was used to determine whether two overlapped cliques should be merged or not, and the overlap-threshold value of these two cliques X0.5 was set as the merge-threshold value. The weighted inter-connectivity between the non-overlapping proteins of K1 andK2was calculated according to the following formula:
inter scoreðK1;K2Þ ¼
ffiffiffiffiffiffiffiffiffiffiffiffiffiffiffiffiffiffiffiffiffiffiffiffiffiffiffiffiffiffiffiffiffiffiffiffiffiffiffiffiffiffiffiffiffiffiffiffiffiffiffiffiffiffiffiffiffiffiffiffiffiffiffiffiffiffiffiffiffiffiffiffiffiffiffiffiffiffiffiffiffiffiffiffiffiffiffiffiffiffiffiffiffiffiffiffiffiffiffiffiffiffiffiffiffiffi P
a2ðK1 K2Þ
P
b2K2Kða;bÞ
K1 K2
j j jK2j
P
a2K2 K1
P
b2K1Kða;bÞ
K2 K1
j j jK1j
s
Identification of modules with similar composition In addition, the module correlation density of the modules from the case and control groups was calculated according to the following formula:
dccðSnÞ ¼
P
p;q2SnPCCðða;bÞ;NÞ
Sn
j j
2
dccðTmÞ ¼
P
p;q2TmPCCðða;bÞ;MÞ
Tm
j j
2
where S = {S1, S2,y, Sn} and T = {T1, T2, y , Tm}
of control and NPC groups, respectively. The correla-tion densities for disease module T were calculated similarly.
Then, the Jaccard similarity of the modules in NPC and control conditions were calculated according to JðSn;TmÞ ¼jSn\Tmj=jSn[Tmj. The modules with
JðSn;TmÞ 0:7 were considered similar modules in gene composition. Moreover, modules with nodes that are too small in size might be too simple and insufficient to characterize the relationship between the biomarkers and the disease. Thus, the modules with nodes X5 were selected for further analysis.
Identification of attractor modules
To identify differential expression between NPC and control conditions, we used theattractmethod (9) on the above identified modules. In the present study, a gene set enrichment algorithm named GSEA-ANOVA was applied to determine the differential expression on the attractor level data.
Under this implementation, an ANOVA model wasfirst
fit to each gene after their expression was modeled by a single factor. Taking gene s as an example, it was modeled according to the following formula:
yrðgsÞ¼OþOgþmrg
where r (r = 1,y, pf) were replicate samples,g are cell
types (g = 1,y, G),Orepresented the overall mean,Og denotes theg-th cell type group’s effect on the expression of the genes, andmrgreflects the random normal residual error term.
Then, we assumed that the expression values among all of the cell types were equivalent and a null hypothesis
L: O1 = O2 = y = Og was proposed. The average expression for cell typegwas calculated according to the following formula:
yð:gsÞ¼ 1
pg X
pg
r¼1
yrðgsÞ
The F-statistic was computed for genesbased on the ANOVA model.
FðsÞ¼MSSs
RSSs
where MSSs represents the mean treatment sum of squares, which was determined as follows:
MSSs¼ 1
G 1
XG
g¼1
pg y ðsÞ
:g y::ðsÞ h i2
RSSsdenotes the residual sum of squares:
RSSs¼ 1
S G
XG
g¼1
Xpr
r¼1
yrðgsÞ y
ðsÞ
:: h i2
where S represents the total number of samples. After this, we calculated the overall average value according to the following formula:
y::ðsÞ¼ 1
G
XG
g¼1
1
pg
X
pg
r¼1
yrðgsÞ !
It is well known that the F-statistic captures the strength of association of a gene’s expression over the dif-ferent cell types. The larger the F-statistic value, the larger the type-specific expression change of the cell (18). In the present study, to test this relationship more formally, we used a t-test and a Welch modification to determine the difference of the F-statistic.
Taking module M that consisted of A genes as example, the t-statistic value was obtained according to the following formula:
TM ¼
1
A
PA
s¼1
FðsÞ
1
V
PV
r¼1
FðrÞ
ffiffiffiffiffiffiffiffiffiffiffiffiffiffiffiffiffiffiffiffiffiffiffiffiffiffiffiffi S2 M A
þ S2V
V
r
where V represents the total number of well-annotated genes within a module and and represent the sample variances, which are defined as:
S2A ¼ 1
A 1
XA
r¼1
FðrÞ 1 A
XA
s¼1
FðsÞ
!2
s2v¼ 1
V 1
XV
r¼1
FðrÞ 1 V
XV
s¼1
FðsÞ
!2
At last, we performed Welch-Satterthwaite equation to specify the degrees of freedom:
w¼ S2 A A þ S2 V V 2 S4 A
A2ðA 1Þþ S4
V
V2ðV 1Þ
In short, attract used an F-statistic from an ANOVA model to assess condition-specific changes in expression across two conditions. The ANOVA model collapsed down to being equivalent to a two-sample t-test in this study. To increase the sensitivity of the differences between the global distribution of F-statistics and the module distribu-tion, we performed multiple-testing by using Benjamini-Hochberg FDR-based method to adjust the P-values (19). Finally, these pathways with adjusted P-values o0.05 were regarded as attractor modules.
Functional enrichment analysis of genes in differential modules
enrichment analysis based on Database for Annotation, Visualization and Integrated Discovery (DAVID) (20) was performed in genes contained in the differential modules. The bioprocesses with a P-valueo0.05 were considered to be significant for NPC.
Results
PPI network re-weighting
To determine the significant biomarkers for NPC,first the data of gene expression profile of NPC and PPI data were recruited and preprocessed. Based on the data, a PPI network was constructed. To further assess the reli-ability of protein interactions, the PPI network re-weighting was conducted on the original network, and the absolute PCC values for each interaction was used as the re-weighted PPI network value. The distributions of the re-weighted values of interactions in NPC and control groups are shown in Figure 1. We found that the number of interactions in two groups were all in descending order according to the re-weighted values. In addition, the number of interactions in the NPC group was higher than that in the control group when the interaction correlation arranged 0.0B0.5, and the number of interactions in NPC
group was lower than that in the control group when the interaction correlation arranged 0.6B1.0. Moreover, under
the threshold P-value of o0.05, two re-weighted PPI networks were separately gained for NPC and control conditions, with 5,423 and 7,480 interactions, respectively.
Identifying modules from the PPI networks
In order to identify the disrupted modules from the re-weighted PPI networks, the maximal cliques were searched via the fast depth-first method. A total of 4,769 and 4,029 maximal cliques were identified for NPC and
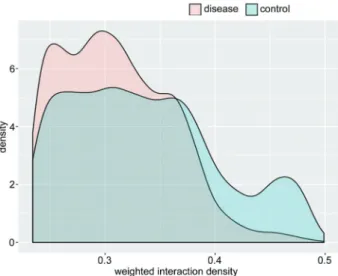
control conditions, respectively. Under the threshold node values of X4 and p20, 863, and 598 maximal cliques were separately determined for NPC and control groups, respectively. The frequency distribution of cliques is shown in Figure 2. In addition, the WID value was intro-duced to determine the importance of the maximal cliques. Figure 3 shows the distribution of WID values in the two conditions. Under the overlap-threshold value of the inter-connectivity between two groups X0.5, 19 and 38 modules were identified for the NPC and control groups, respectively.
Identification of attractor modules
Prior to determining the differential modules between the two groups, modules with similar gene composition were determined via the Jaccard similarity parameter. Under the Jaccard similarity cutoff value ofX0.7, 8 pairs of modules, which we named Module 1BModule 8, were
gained.
As mentioned above,attractcan identify and annotate the gene-sets (modules) that best discriminate different cell phenotypes and might be associated with the occurrence and development of a certain disease. In the present study,
Figure 1.Pearson correlation coefficient distribution of interac-tions in the nasopharyngeal carcinoma group and the control group.
the attract method was used to perform analysis on the module pairs. Under the threshold P-value of o0.05, 2 modules were considered as attractor modules. Module 1 (P=0.042) and Module 3 (P=0.047) were considered to be significant for NPC (Figure 4). The details are shown in Table 1.
Functional analysis of genes in attractor modules To further determine the biological functions of attrac-tor modules, GO analysis was conducted based on DAVID. Under the cutoff P-value ofo0.05, the bioprocess of cell division was identified for both modules (Table 1). In this case, these two attractor modules might affect the bioprocess of cell division to perform their function during the occurrence and development of NPC.
Discussion
Over the past several years, radiotherapy equipment and techniques have been improved tremendously, and several genes, such as BCAT1 (21), MST1R (22) and
FEZF2 (23), were indicated to be aberrantly expressed in NPC. However, the molecular mechanisms of NPC have not been elucidated clearly yet, and the five-year survival rate of NPC patients has not radically changed and remains around 50–60% (21). Therefore, it is of great
importance to comprehensively disclose the pathologi-cal mechanism and explore new approaches for NPC treatment.
The traditional expression-based analysis methods search for genes that are differentially expressed between different conditions, then a meta-analysis follows to iden-tify potential functional interpretations of these genes (24). Network strategies, such as co-expression networks, have been largely performed to select the initial significant gene lists, and the potential functional roles are predicted based on a post-hoc application (25). For annotating large datasets, it is indeed a useful way. However, the subsequent analyses are invariably restricted to well-annotated genes. Conversely, the attract method first identifies the candidate gene sets, then decomposes the module-defined gene lists into highly correlated sub-groups and extends those by going back to the entire body of data to find additional genes that are highly correlated with each individual subgroup (9). Therefore, theattractmethod can not only identify the well-annotated gene sets, but can also integrate novel elements via their correlated expression patterns to the well-annotated functions.
In the present study, attractor modules for NPC were excavated via integrating systemic module inference with the attractmethod. By defining each module as a signal Figure 3.Distribution of weighted interaction density values in the
nasopharyngeal carcinoma group and the control group.
attractor, we identified two attractor modules, Module 1 and Module 3. Functional analysis showed that both modules were related to the bioprocess of cell division. Next, we attempted to further disclose the relationships between the bioprocess of cell division and development of NPC. Cell division is an essential process for healthy growth of an organism. Advanced studies in complex genetic mechanism are attempting to explain how normal cells become tumorigenic. Numerous studies have indi-cated that mutation accumulation in genes that control cell division can cause cancer by accelerating cell division rates or inhibiting normal controlling systems (26–28). Cell
division cycle checkpoint has been conducted on ther-apeutic strategies of NPC (29,30). Our study identified two cell division-related attractor modules in NPC, confirming the critical roles of uncontrolled cell division bioprocess in the development of NPC.
Based on the strategy of integrating systemic module inference with the attract method, we successfully iden-tified two cell division-related attractor modules in NPC. These two attractor modules were predicted to play sig-nificant roles during the occurrence and development of NPC, and may provide useful information for identifying better therapeutic strategies for this disease.
References
1. Nicholls J, Niedobitek G. Histopathological diagnosis of nasopharyngeal carcinoma: Looking beyond the blue book.
Nasopharyngeal Carcinoma2013; 10–22, doi:
10.1007/978-1-4614-5947-7_2.
2. Ng WT, Chan OS, Sze HC, Lee AW. Nasopharyngeal carcinoma. 2016, doi: 10.1016/j.radonc.2012.08.001. 3. Li Z, An L, Li H, Wang S, Zhou Y, Yuan F, Li L. Identifying
novel genes and chemicals related to nasopharyngeal cancer in a heterogeneous network. Sci Rep 2016; 5,6: 25515, doi: 10.1038/srep25515.
4. Cho D-Y, Kim Y-A, Przytycka TM. Network biology approach to complex diseases.PLoS Comput Biol2012; 8: e1002820, doi: 10.1371/journal.pcbi.1002820.
5. Jordán F, Nguyen T-P, Liu W-c. Studying protein–protein
interaction networks: a systems view on diseases. Brief Funct Genomics 2012; 11: 497–504, doi: 10.1093/bfgp/
els035.
6. Choi JK, Yu U, Yoo OJ, Kim S. Differential coexpression analysis using microarray data and its application to human cancer.Bioinformatics2005; 21: 4348–4355, doi: 10.1093/
bioinformatics/bti722.
7. Ravasz E, Somera AL, Mongru DA, Oltvai ZN, Barabasi AL. Hierarchical organization of modularity in metabolic net-works.Science2002; 297: 1551–1555, doi: 10.1126/science. 1073374.
8. Khatri P, Drăghici S. Ontological analysis of gene expression data: current tools, limitations, and open problems. Bioinfor-matics 2005; 21: 3587–3595, doi: 10.1093/bioinformatics/
bti565.
9. Mar JC, Matigian NA, Quackenbush J, Wells CA. attract: A method for identifying core pathways that define cellular phenotypes.PloS One2011; 6: e25445, doi: 10.1371/journal. pone.0025445.
10. Pepper SD, Saunders EK, Edwards LE, Wilson CL, Miller CJ. The utility of MAS5 expression summary and detection call
algorithms.BMC Bioinformatics2007; 8: 273, doi: 10.1186/ 1471-2105-8-273.
11. Ma L, Robinson LN, Towle HC. ChREBPMlx is the principal mediator of glucose-induced gene expression in the liver.
J Biol Chem 2006; 281: 28721–28730, doi: 10.1074/jbc. M601576200.
12. Rifai N, Ridker PM. Proposed cardiovascular risk assess-ment algorithm using high-sensitivity C-reactive protein and lipid screening.Clin Chem2001; 47: 28–30.
13. Liu G, Wong L, Chua HN. Complex discovery from weighted PPI networks. Bioinformatics2009; 25: 1891–1897, doi:
10.1093/bioinformatics/btp311.
14. Li M, Zhang H, Wang JX, Pan Y. A new essential protein discovery method based on the integration of protein-protein interaction and gene expression data.BMC Syst Biol2012; 6: 15, doi: 10.1186/1752-0509-6-15.
15. Tavazoie SF, Alarcn C, Oskarsson T, Padua D, Wang Q, Bos PD, Gerald WL, Massagu J. Endogenous human micro-RNAs that suppress breast cancer metastasis.Nature2008; 451: 147–152, doi: 10.1038/nature06487.
16. Tomita E, Tanaka A, Takahashi H. The worst-case time complexity for generating all maximal cliques and computa-tional experiments. Theor Comput Sci 2006; 363: 28–42, doi: 10.1016/j.tcs.2006.06.015.
17. Liu G, Wong L, Chua HN. Complex discovery from weighted PPI networks. Bioinformatics 2009; 25: 1891–1897, doi:
10.1093/bioinformatics/btp311.
18. Tian L, Greenberg SA, Kong SW, Altschuler J, Kohane IS, Park PJ. Discovering statistically significant pathways in expression profiling studies.Proc Natl Acad Sci U S A
2005; 102: 13544–13549, doi: 10.1073/pnas.0506577
102.
19. Benjamini Y, Hochberg Y. Controlling the false discovery rate - A practical and powerful approach to multiple testing.
J Royal Statist Soc1995; 57: 289–300.
Table 1.Details of the differential modules.
Module Pa Size Gene Pathway Pg
1 0.042 6 NCAPG, CDC45, OIP5, RAD51AP1, CDCA3, TRIP13 Cell division 0.004
3 0.047 5 CCNB1, NCAPG, NDC80, CDCA3, NCAPH Cell division 0.001
20. Kanehisa M, Goto S. KEGG: Kyoto encyclopedia of genes and genomes.Nucleic Acids Res2000; 28: 27–30, doi:
10.1093/nar/28.1.27.
21. Zhou W, Feng X, Ren C, Jiang X, Liu W, Huang W, et al. Over-expression of BCAT1, a c-Myc target gene, induces cell proliferation, migration and invasion in nasopharyngeal carci-noma.Mol Cancer2013; 2: 1, doi: 10.1186/1476-4598-12-53. 22. Dai W, Zheng H, Cheung AKL, Tang CS, Ko JM, Wong BW, et al. Whole-exome sequencing identifies MST1R as a genetic susceptibility gene in nasopharyngeal carcinoma.
Proc Natl Acad Sci U S A 2016; 113: 3317–3322, doi:
10.1073/pnas.1523436113.
23. Shu XS, Li L, Ji M, Cheng Y, Ying J, Fan Y, et al. FEZF2, a novel 3p14 tumor suppressor gene, represses oncogene EZH2 and MDM2 expression and is frequently methylated in nasopharyngeal carcinoma.Carcinogenesis2013; 34: 1984–1993, doi: 10.1093/carcin/bgt165.
24. Rhodes DR, Barrette TR, Rubin MA, Ghosh D, Chinnaiyan AM. Meta-analysis of microarrays interstudy validation of gene expression profiles reveals pathway dysregulation in prostate cancer. Cancer Res 2002; 62: 4427–4433.
25. Mason MJ, Fan G, Plath K, Zhou Q, Horvath S. Signed weighted gene co-expression network analysis of transcrip-tional regulation in murine embryonic stem cells. BMC Genomics2009; 10: 1, doi: 10.1186/1471-2164-10-327. 26. Hampton T. Cell division on-off switches sought as targets
for cancer drugs.JAMA2005; 293: 1847, doi: 10.1001/jama. 293.15.1847.
27. Preston-Martin S, Pike MC, Ross RK, Jones PA, Henderson BE. Increased cell division as a cause of human cancer.
Cancer Res1990; 50: 7415–7421.
28. Altieri DC. Survivin, versatile modulation of cell division and apoptosis in cancer.Oncogene2003; 22: 8581–8589, doi:
10.1038/sj.onc.1207113.
29. Wang H, Chen H, Zhou H, Yu W, Lu Z. Cyclin-dependent kinase inhibitor 3 promotes cancer cell proliferation and tumorigenesis in nasopharyngeal carcinoma by targeting P27.Oncol Res2017, doi: 10.3727/096504017X148353117 18295.