Na elaboração desta tese, e nos termos do número 2 do Artigo 4o do Regulamento Geral dos Terceiros Ciclos de Estudos da Universidade do Porto e do Artigo 31º do D.L. 74/2006, de 24 de Março, com a nova redação introduzida pelo D.L. 230/2009, de 14 de Setembro, foi efetuado o aproveitamento total de um conjunto coerente de trabalhos de investigação já publicados ou submetidos para publicação em revistas internacionais indexadas e com arbitragem científica, os quais integram alguns dos capítulos da presente tese. Tendo em conta que os referidos trabalhos foram realizados com a colaboração de outros autores, o candidato esclarece que, em todos eles, participou ativamente na sua conceção, na obtenção e análise de dados, e discussão de resultados, bem como na elaboração da sua forma publicada.
I would first and foremost like to thank José Carlos Brito, my supervisor who has given me real guidance, support, direction, and confidence throughout my degree; In addition to being my supervisor, José Carlos was also a friend that was there for whatever, whenever was needed. Thank you.
To Kamran Safi, my co-supervisor, I would like to thank the opportunity of working in his group, and many contributions provided to this project.
I would like to acknowledge the Fundação para a Ciência e Tecnologia (FCT) for the financial support to this work plan (grant PD/BD/52605/2014) within the Doctoral Programme in Biodiversity, Genetics & Evolution (BIODIV).
I extend my acknowledgements to the institutions that have hosted me: CIBIO-InBIO; and Max Planck Institute of Animal Behavior of the University of Konstanz.
I would like to thank all the seniors and juniors of the BIODESERTS GROUP.
I thank all my friends, especially those in CIBIO, who have supported me emotionally through talks, events, and many coffee breaks close to Teresa’s bar. And a big thank to friendly people in Max Planck, Radolfzell.
I am grateful to all respondents who answered my questions through personal contacts and who shared their invaluable records; To name a few amongst these, T. Ghadirian, H. Fahimi, M. Soofi, H. Jowkar, A. Qashqaei, H. Abolghasemi, and A. Mahmoudi.
I would like to thank the Iranian Department of Environment (DoE), Conservation of Asiatic Cheetah Project CACP, Mohitban Society, Persian Wildlife Heritage Foundation PWHF, as well as several local NGOs that shared their unpublished species records with me. We also thank all the provincial offices of DoE that shared their species occurrence data (through questionnaires or by personal interviews) for developing the distributional maps.
I thanks experts from the mammal section of the Biodiversity and Wildlife Bureau of the Iranian DoE for their contribution during the data collection.
I owe a great debt to all my previous professors: Jamshid Darvish, Abdolhosein Vahabzadeh, Bahram H. Kiabi, Bahram Zehzad, Bijan F. Darreshouri and Hooshang Ziaie; I am honored, to be with them, learn from them and work with them.
I owe many thanks to Kaveh Faizolahi, who was my partner in crime throughout of these years, since we entered university. I would like to honour the memory of Hadi Fahimi, a good friend and colleague whose friendship is sorely missed; Most of my personal observations that I have used in this thesis came from enjoyable and memorable period that I had with him throughout of my fucking lovely country! Finally, I would like to remember my friends: Taher Ghadirian, Hooman Jowkar, Amir Hosein Khaleghi, and Sam Rajabi, those their situation blow my mind in the last year and made my hardest year of my life. These guys are innocent conservationists who are currently in jail for more than a year because of ludicrous spying charges!
In a sense, the preparation of this thesis began when I was a bachelor student at the Ferdowsi University of Mashahd (Iran), working my way around rodent’s taxonomy. This thesis arose from my passion and desire to integrate my knowledge of Iran’s mammal diversity and history with the sciences of conservation ecology and biogeography.
RESUMO
O Irão localiza-se no cruzamento de três áreas biogeográficas principais, apresentando altos níveis de diversidade fisiográfica e climática e de diversidade em mamíferos terrestres. No entanto, o país experimentou um intenso desenvolvimento humano nas últimas décadas, o que produziu impactos substanciais na biodiversidade, em particular nos mamíferos. Além disso, existem muitas lacunas de conhecimento sobre a diversidade, a distribuição e o estatuto de conservação dos mamíferos no Irão, os respectivos padrões biogeográficos e a vulnerabilidade à extinção e às futuras alterações climáticas. Estes tópicos são abordados nesta tese no âmbito da Biogeografia da Conservação.
Os objetivos gerais desta tese visam: 1) actualizar os conhecimentos sobre a diversidade e a distribuição dos mamíferos terrestres no Irão; 2) avaliar o respectivo estatuto de conservação; 3) identificar regiões biogeográficas na distribuição; 4) identificar os principais factores que determinam o risco de extinção; e 5) examinar a vulnerabilidade às alterações climáticas. Em conjunto, espera-se que os dados recolhidos sobre estes objectivos contribuam para o planeamento da conservação dos mamíferos no Irão e para minimizar as perdas globais de biodiversidade.
Os principais resultados encontrados foram:
1) A lista actual de mamíferos terrestres do Irão compreende 192 espécies distribuídas em 88 géneros, 34 famílias e sete ordens. Os nomes científicos de 45 taxa foram alterados, 13 deles são novas espécies ou novas observações, 32 tiveram mudanças na classificação ou nomenclatura, e 19 espécies previamente não registadas foram adicionadas à lista da fauna do Irão porque ocorrem em zonas contíguas de países adjacentes. As regiões das montanhas de Alborz e Zagros acumulam as maiores concentrações de riqueza em espécies;
2) Quase 13% das espécies de mamíferos terrestres do Irão estão ameaçadas (avaliadas como criticamente ameaçadas, ameaçadas ou vulneráveis), e outras 14% estão perto de serem qualificadas com estatuto de ameaça. A maioria dos grandes mamíferos (41%; 16 de 39), especialmente as espécies pertencentes aos grupos Artiodactyla, Perissodactyla e Carnivora, estão actualmente ameaçados de extinção. O estatuto de conservação dos ungulados (equídeos, suídeos, bovídeos e cervídeos) é particularmente preocupante, com 91,9% das espécies avaliadas como ameaçadas;
3) O Irão pode ser dividido em oito regiões climáticas distintas que são coerentes com as principais zonas bioclimáticas globais. O método baseado em redes detectou sete biorregiões e dois zonas de transição, enquanto o método baseado em distâncias sugeriu cinco biorregiões. O método baseado em redes foi aparentemente mais sensível do que o método baseado na distância;
4) A variação interespecífica no risco de extinção entre os mamíferos terrestres do Irão é determinada em grande parte pelo tamanho do corpo e menos pelo impacto das actividades humanas. O maior risco de extinção nos grandes mamíferos está associado à massa corporal do adulto (ABM) e, em certa medida, ao tamanho da ninhada e à taxa real de evapotranspiração. Nenhum sinal filogenético foi detectado na ABM, mas análises filogenéticas autocorrelativas identificaram correlações significativas na ABM aos níveis do género, família e ordem, indicando que os níveis de ameaça são mais similares entre as espécies dentro do mesmo género, géneros dentro das famílias e famílias dentro das ordens; 5) Quase toda a superfície do Irão está prevista com aumento de temperatura entre 5 a 7 ° C e decréscimos na precipitação de 50 a 250 mm em 2070, de acordo com o cenário climático
RCP8.5. As áreas de risco climático para temperatura estão distribuídas nas regiões costeiras da Mesopotâmia, Golfo Pérsico e Mar de Omã, e para precipitação na Bacia Central. Os hotspots do grupo funcional do deserto serão os mais expostos (17% da área ocupada) a temperaturas extremas, enquanto todos os grupos, mas principalmente os das espécies carnívoras, desérticas e de grande porte (44-54%) e das espécies ameaçadas (48%) serão expostos a níveis de precipitação típicos de zonas áridas. As áreas protegidas estarão em grande parte expostas a precipitações de zonas áridas (66% da área actual para 74% em 2070). Os hotspots protegidos dos grupos não-voadores, carnívoros e florestais (> 35% da área), mas principalmente os das espécies ameaçadas (60%), serão expostos a precipitações de zonas áridas.
Acima de tudo, esta tese fornece uma visão geral sobre os padrões de distribuição da diversidade de mamíferos terrestres no Irão. Mostra-se que os grandes mamíferos estão actualmente altamente ameaçados e são muito vulneráveis a alterações climáticas futuras. O desenvolvimento de Planos de Acção específcos para garantir a persistência a longo prazo dos mamíferos ameaçados é uma necessidade urgente. Acções de gestão, como o estabelecimento adicional de áreas protegidas em montanhas, são necessárias para mitigar os efeitos de ameaças adicionais, que podem agir em simultâneo com as alterações climáticas, e monitorizar as tendências populacionais em resposta aos processos de alteração climática. Os resultados obtidos fornecem informações úteis para o planeamento da conservação e para a gestão da biodiversidade. Tais informações são cruciais em países ou áreas geográficas onde, apesar da elevada diversidade, não existem ainda conhecimentos suficientes para suportar acções de conservação informadas.
Palavras-chave: Alterações Climáticas; Biodiversidade; Biogeografia; Bioregiões; Biorregionalização; Diversidade funcional; Estatuto de conservação; Hotspots; Irão; Lista de espécies; Lista Vermelha; Mamíferos terrestres; Mammalia; Mapeamento da distribuição; Regiões climáticas; Risco de extinção; Sudoeste Asiático; Vulnerabilidade.
Located on the crossroad of three main biogeographical realms, Iran displays high levels of physiographic and climatic diversity and has rich mammal diversity. However, the country has experienced intense human development over the past decades, which leads to substantial impacts on biodiversity, particularly in mammals. In addition, there are many knowledge gaps about the diversity, distribution and conservation status of Iranian mammals, their biogeographical patterns, and their vulnerability to extinction and to future climate change. These are topics covered in this thesis under the Conservation Biogeography framework. The general aims of this thesis are to: 1) update the species diversity and distribution of the terrestrial mammals of Iran; 2) assess their conservation status; 3) identify biogeographic regions in their distribution; 4) identify the main factors driving their extinction risk; and 5) examine their vulnerability to climate change. Taken together, data on these objectives are expected to contribute to the conservation planning of Iranian mammals and to minimize global biodiversity losses.
The main results found were:
1) The current species list of terrestrial mammals of Iran comprises 192 species distributed among 88 genera, 34 families, and seven orders. The scientific names of 45 taxa have changed, 13 of them are new species or new records, 32 had changes in classification or nomenclature, and 19 species not yet recorded in Iran were added to the faunal list because they occur in contiguous areas of adjacent countries. The regions of Alborz and Zagros mountains accumulate the highest concentrations of species richness;
2) Nearly 13% of the terrestrial mammals of Iran are threatened (assessed as Critically Endangered, Endangered, or Vulnerable), and a further 14% are near to qualifying for threatened status. Most of the large mammals (41%; 16 out of 39), especially the species belonging to Artiodactyla, Perissodactyla, and Carnivora, are currently threatened with extinction. The conservation status of ungulates (equids, suids, bovids, and cervids) is of particular concern, with 91.9% of the species assessed as threatened;
3) Iran can be divided in eight distinct climate regions that are congruent with the global bioclimatic zones. Network-based method detected seven bioregions and two transition zones while the distance-based method suggested five bioregions. The network-based method was apparently more sensitive than the distance-based method;
4) Interspecific variation in extinction risk among terrestrial mammals of Iran is largely determined by body size and less so by the impact of human activities. Higher extinction risk in large mammals is associated with adult body mass ABM, and to some extent to the litter size and actual evapotranspiration rate. No phylogenetic signal is detected for ABM but phylogenetic autocorrelative analyses identify significant correlations in ABM at the genus, family and order levels, indicating that levels of threat are more similar among species within the same genus, genera within families, and families within orders;
5) Almost all the surface of Iran is predicted with temperature increase from 5 to 7 °C and decreases in precipitation from 50 to 250 mm in 2070 according to RCP8.5 climate scenario. Climate risk areas for temperature will be distributed in Mesopotamian region, Persian Gulf and Oman Sea coastal areas, and for precipitation in the Central Basin. Hotspots of the desert functional group will be most exposed (17% of their area) to extreme temperatures, while all groups but mostly carnivore, desert, and large-sized (44-54%) and threatened species (48%)
will be exposed to dryland precipitation levels. The protected areas will be mostly exposed to to dryland precipitations (66% of their area currently to 74% in 2070). Protected hotspots of non-volant, carnivore and forest groups (>35% of area) but mostly threatened species (60%) will be exposed to dryland precipitations.
Overall, this thesis provides an overview on the distribution patterns of the diversity of terrestrial mammals in Iran. It is shown that large mammals are currently highly threatened and are very vulnerable to future climate change. The development of Action Plans to ensure long-term persistence of threatened mammals is urgently needed. Management actions, such as the establishment of additional mountain protected areas is needed to mitigate the effects of additional threats, which may act concurrently with climate change, and to monitor population trends responding to climate change processes. The results provide insights to inform conservation planning and biodiversity management. Such information is crucial in countries or geographic areas where, despite their high diversity, there is insufficient knowledge to support informed conservation actions.
Key words: Biodiversity; Biogeography; Bioregionalisation; Bioregions; Climate change;
Climate regions; Conservation status; Distribution mapping; Extinction risk; Functional diversity; Hotspots; Iran; Mammalia; IUCN Red List; Southwest Asia; Species list; Terrestrial mammals; Vulnerability.
CONTENTS
RESUMO……….... i
SUMMARY………. v
CHAPTER 1: GENERAL INTRODUCTION……….. 13
1.1 Biodiversity……….. 15
1.1.1 Biodiversity loss………. 15
1.1.2 Global initiatives to halt biodiversity loss……… 17
1.2 Conservation biogeography……….. 18
1.2.1 The Linnean shortfall………. 19
1.2.2 The Wallacean shortfall………... 19
1.2.3 The extinction risk shortfall………... 20
1.3 Biodiversity conservation……….…………. 20
1.3.1 Mapping biodiversity distribution………. 20
1.3.2 Bioregionalisation tools………. 21
1.3.3 Assessing conservation status and regional Red Listing………...………. 22
1.3.4 Estimating extinction risk……….. 23
1.3.5 Assessing vulnerability to climate change………. 25
1.4 Study area: Iran……….. 27
1.4.1 Biogeography of Iran………. 30
1.4.2 Biodiversity of Iran………. 32
1.4.3 Wildlife protection and conservation………... 32
1.5 Study group: mammals………. 33
1.5.1 History of research………. 33
1.5.2 Species distribution and diversity……… 34
1.5.3 Threats and conservation status………. 35
1.5.4 Extinction risk and vulnerability to climate change………... 36
1.6 Setting of the present work………... 37
1.7 References……….. 37
CHAPTER 2: OBJECTIVES AND THESIS STRUCTURE………. 49
2.1 General objectives……… 51
CHAPTER 3: MAPPING BIODIVERSITY DISTRIBUTION AND ASSESSING
CONSERVATION STATUS………. 55
Article I. The species diversity, distribution, and conservation status of the terrestrial mammals of Iran……… 57
CHAPTER 4: BIOREGIONALISATION COMPARISONS……….. 93
Article II. Network- and distance-based methods in bioregionalisation processes: an application to the terrestrial mammals of Iran……….. 95
CHAPTER 5: ESTIMATING EXTINCTION RISK………. 119
Article III. Body size as a key determinant of vulnerability to extinction in terrestrial mammals of Iran……… 121
CHAPTER 6: ASSESSING VULNERABILITY TO CLIMATE CHANGE……….. 143
Article IV. Dryness rather than warming severely threatens the functional diversity of Iranian terrestrial mammals………...………….. 145
CHAPTER 7: GENERAL DISCUSSION……… 171
7.1 Key findings………. 173
7.1.1 Mapping diversity and distribution………... 173
7.1.2 Conservation status………... 176
7.1.3 Biogeographical patterns……….. 177
7.1.4. Estimating extinction risk………. 178
7.1.5 Assessing vulnerability to climate change………. 179
7.2 Future prospects………. 180
7.3 Concluding remarks………... 182
7.4 References……….. 184
Appendix A: Supplementary Data of Article I………... 193
Appendix B: Supplementary Data of Article II……….. 423
Appendix C: Supplementary Data of Article III………. 441
Appendix D: Supplementary Data of Article IV……… 447
LIST OF TABLES
Table 1.1 Main technical responses to threats to biodiversity. Adapted from Cox et al. (2016)……… 17 Table 3.1 List of known land mammals of Iran, in this study, and Karami et al., (2008, 2016) with the number of records (N), zoogeographic affinities (ZOA), Regional IUCN Red List categories and criteria (IUCN-R) and global status (IUCN-G). Under ZOA, “indefinable” stands for species occurring in more than two zoogeographical regions……….. 62 Table 4.1 Factor matrix from a principal component analysis on 16 variables, with the percentage of variance explained and variable loadings on the first three components. Variable loadings above >0.3 are shown in bold………... 103 Table 4.2 Identified climate regions, bioregions and transitions zones by network-based and distance-based methods, with percentage occupied by each region in Iran (% area) and the percentage covered by protected areas (% protected)……….. 104 Table 5.1 Description of variables used in the extinction risk analyses in terrestrial mammals of Iran. N = Number……….. 127 Table 5.2 Results of simple linear regressions for predicting extinction risk in all terrestrial mammals of Iran and in small and large mammals separately. Variable codes as in Table 5.1. Coef = correlation coefficient; SE= standard error of the mean. All
variables significant at P ≤ 0.05.† ……….. 129
Table 5.3 Comparisons of generalized linear mixed models of the effects of adult body mass, life history, ecology and environment on extinction probability of Iranian mammals. The top five models for all terrestrial mammals of Iran and large mammals are shown, in order of increasing Akaike information criterion (AIC) value. ABM was log-transformed prior to analysis.†……… 130 Table 6.1 Summary of the number of pixels classified as hotspots (and percentage covered by protected areas; %PA) according to current species distributions (Current) of 12 functional groups, Threatened species and Total Iranian terrestrial mammals and their predicted levels of exposure to changes in temperature (BIO01) and precipitation (BIO12) in 2080 according to RCP8.5 scenario. BIO01: number of hotspot pixels (%) currently included in protected areas not exposed to future extreme temperatures (<UCT) or exposed (>UCT). BIO12: number of hotspot pixels (%) currently included in
protected areas that are not exposed to future low levels of precipitation (>200 mm) or exposed (<200 mm) (and the percentage covered by protected areas)……….
155 Appendix A: Table S1 List of known land mammals of Iran, author(s), estimated Area of Occupancy (AOO) and Extent of Occurrence (EOO)……… 200 Appendix B: Table S1 The list of 19 terrestrial ecoregions of Iran (Dinerstein et al., 2017) and the list of 1o major bioclimates of Iran belongs to the main three global macro-bioclimates of Temperate, Mediterranean and Tropical (Djamali et al., 2011; Rivas-Martinez et al., 2011)……… 424 Appendix B: Table S2 Description and sources of variables used in this study………… 425 Appendix B: Table S3 Identified bioregions by the network-based method, identifying the most common species in each bioregion and the number (NCS) of records, and the most indicator species and their scores (SCO). The number of records (NR), number of species (NS) and number of cells (NC) for each bioregion are given within parenthesis………... 426 Appendix C: Table S1 The 156 Iranian terrestrial mammals, the average Human Influence Index (HII; high values indicate high human influence), range size given by the extent of occurrence (EOO; km2) used to calculate HII, IUCN regional status (IUCN;
0=Least Concern, 1=Near Threatened, 2=Vulnerable, 3=Endangered, 4=Critically Endangered, and 5=Regionally Extinct), average adult body mass (ABM; gr), diet breadth (DB; number of diet categories), average gestation length (GL; days), habitat breadth (HB; 1=above ground dwelling, 2=aquatic, 3=fossorial, and 4=ground dwelling), average litter size (LS), trophic level (TL; 1=herbivore, 2=omnivore, and 3=carnivore), average weaning age (WA; days), and average actual evapotranspiration rate (AET; in mm). NA=Not available. * - Variables collected in PanTHERIA database. 442 Appendix D: Table S1 The 186 terrestrial mammals of Iran and their allocation to the threatened (THRE) group (i.e. taxa categorised as CR, EN or VU) and to each of the 12 functional groups. VOL: Volant; NVOL: Non-Volant; CARN: Carnivore; HERB: Herbivore; INSE: Insectivore; LARG: Large; SMAL: Small; SPEC: Specialist; GENE: Generalist; MOUN: Mountain; FORE: Forest; DESE: Desert……….. 448
LIST OF FIGURES
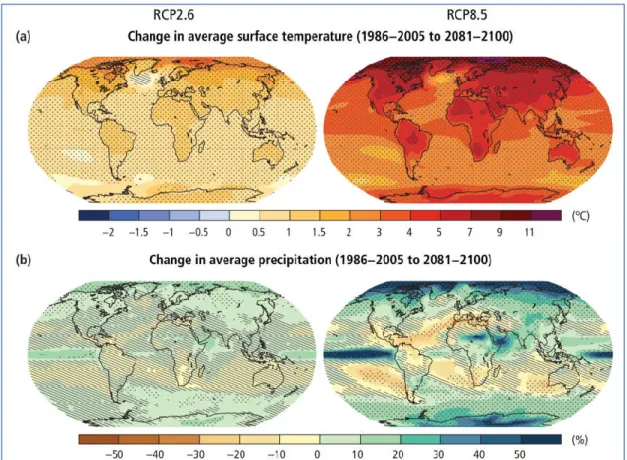
Figure 1.1 Changes in average surface temperature (a) and in average precipitation (b) based on multi-model mean projections for 2081–2100 relative to 1986–2005 under the RCP2.6 (left) and RCP8.5 (right) scenarios. Stippling (i.e. dots) shows regions where the projected change is large compared to natural internal variability and where at least 90% of models agree on the sign of change. Hatching (i.e. diagonal lines) shows regions where the projected change is less than one standard deviation of the natural internal variability. Source IPCC (2014)………..………. 16
Figure 1.2 Map of the terrestrial zoogeographic realms and regions of the world. Source: Holt et al. (2013)……….………...……… 21
Figure 1.3 The 846 global ecoregions of the world. Source: Dinerstein et al.
(2017)……… 22
Figure 1.4 A simple scheme for extinction risk. Reprinted from Purvis et al. (2005)…….. 23
Figure 1.5 Proposed and tested structural relationship between predictors of species extinction risk in birds. Rods represent postulated causal relationships and bubbles variables. Geographical range size, the environmental-niche latent variable, encroachment, and the life-history and ecological-niche latent variables (in decreasing order of importance) are the most significant correlates of extinction risk across 8,664 bird species. Source: Lee and Jetz (2011).………... 25
Figure 1.6 Maps of hotspots of species richness of terrestrial non-volant mammals (a) and proportion of species likely to be negatively impacted by climate change in the future under RCP8.5 scenario (b). Source: Pacifici et al. (2018)………..……….. 27
Figure 1.7 The map of the study area, main toponomies mentioned in text, and geographic location of Iran within global context (small inset)………. 28
Figure 1.8 The 17 global ecoregions of the Iran. Adopted from Dinerstein et al.
(2017)……… 30
Figure 1.9 Map of the zoogeographical regions of the Eastern Persia (Persia is the former name of Iran). Source: Blanford (1876)………..……… 31
Figure 1.10 Areas under protection by the Department of Environment (DoE) of Iran
Figure 3.1 Distribution of all occurrence records of terrestrial mammals in Iran, elevational variation, main place names mentioned in text, and geographic location of Iran (small inset)……….. 59 Figure 3.2 Regional Red List status of land mammals of Iran. The categories are: Regionally Extinct (RE), Critically Endangered (CR), Endangered (EN), Vulnerable (VU), Near Threatened (NT), Least Concern (LC), and Data Deficient (DD)……… 76 Figure 3.3 Species richness of the terrestrial mammals of Iran depicted at 100 x 100-km grid cell ize………... 77 Figure 4.1 The study area and identified climate regions (eight units) at 10 km pixel size. For the complete list of names of climate regions see table 2………... 99 Figure 4.2 Identified bioregions and transition zones by network-based (top – seven units) and by distance-based (bottom – eight units) methods of Iran at 10o km pixel size. For the complete list of names of bioregions see table 4.2……… 105 Figure 4.3 Spatial overlap between protected areas and the identified bioregions by network-based (top) and by distance-based (bottom) methods. For the complete list of names of bioregions see table 4.2……… 107 Figure 5.1 Bivariate plots of the top 6 significant predictors as a function of IUCN Red List status in all terrestrial mammals of Iran. IUCN Red List categories are 0 (Least Concern), 1 (Near Threatened), 2 (Vulnerable), 3 (Endangered), 4 (Critically Endangered) and 5 (Regionally Extinct).……….……...…. 131 Figure 5.2 Phylogenetic correlation (Moran’s I) of adult body mass in terrestrial mammals of Iran with species within genera, genera within families, and families within orders (P < 0.05 in all cases)………. 132 Figure 6.1 Climate risk areas in Iran predicted for 2070 according to scenarios RCP4.5 and RCP8.5. Top: areas experiencing mean annual temperature above the upper critical temperature threshold (mean UCT + sd: 29.6 °C). Bottom: areas experiencing total annual precipitation below the dryland threshold (< 200 mm), distinguishing the current and future predicted expanding drylands. Inset: Location of Iran in the geographic context of Southwest Asia………. 154 Figure 6.2 Geographic exposure of mammal functional diversity of Iran to climate risk areas. Top: Distribution of functional group richness in the areas with mean annual temperature above the upper critical temperature threshold (mean UCT + sd: 29.6 °C) in current time (left) and predicted in 2070 according to scenario RCP8.5 (right).
Bottom: Distribution of functional group richness in the areas with total annual precipitation below the dryland threshold (200 mm) in current time (left) and predicted in 2070 according to scenario RCP8.5 (right)………
156
Figure 6.3 Quantitative exposure of mammal functional diversity of Iran to climate risk areas. Left: Number of pixels of hotspots of 12 functional groups and threatened and total species (grey bar) and respective number of pixels that are exposed to mean annual temperatures above the upper critical temperature threshold (mean UCT + sd: 29.6 °C) in current time and predicted in 2070 according to scenario RCP8.5. Right: Number of pixels of hotspots exposed to total annual precipitation below the dryland threshold (200 mm) in current time and predicted in 2070 according to scenario RCP8.5………. 157 Figure 7.1 Occurrence data for all taxa hosted (accessed 04/01/2019) in Global Biodiversity Information Facility (GBIF; https://www.gbif.org/), showing considerable knowledge gaps in the desert regions of Iran (Dasht-e Kavir and Dasht-e Lut)………… 175 Appendix A: Figure S1 Administrative provinces of Iran: 1: Alborz, 2: Ardabil, 3: Bushehr, 4: Chaharmahal and Bakhtiari, 5: East Azarbaijan or Azarbaijan-e Sharghi, 6: Esfahan, 7: Fars, 8: Gilan, 9: Golestan, 10: Hamadan, 11: Hormozgan, 12: Ilam, 13: Kerman, 14: Kermanshah, 15: Khuzestan, 16: Kohgiluyeh and Boyer Ahmad, 17: Kordestan, 18: Lorestan, 19: Markazi, 20: Mazandaran, 21: North Khorasan or Khorasan-e Shomali, 22: Qazvin, 23: Qom, 24: Razavi Khorasan or Khorasan-e Razavi, 25: Semnan, 26: Sistan and Baluchestan, 27: South Khorasan or Khorasan-e Jonubi, 28: Tehran, 29: West Azarbaijan or Azarbaijan-e Gharbi, 30: Yazd, 31: Zanjan……… 197 Appendix A: Figure S2 Areas under protection by the Department of Environment (DoE) of Iran (DoE-GIS 2016)………... 198 Appendix A: Figure S3 The number of species occurrence records (observations) of land mammals of Iran (each grid cell is 10,000 km2). The brown scale legend
corresponds to the number of records (observations) per class………. 199 Appendix B: Figure S1 The map of the study area, main toponomies mentioned in text, and geographic location of Iran within global context (small inset)………. 429 Appendix B: Figure S2 Model-based clustering with Bayesian Information Criterion (BIC) for the identification of climate regions in Iran. The BIC used to find the single best model, which is “VVV” multivariate mixture ellipsoidal model in this case. The BIC increases with the number of clusters and most of the increase occurs with less than
eight clusters, which were chosen as the optimum number of clusters defining the climate regions. Higher number of clusters brings additional complexity to the analysis without a substantial increment of BIC value……….
430 Appendix B: Figure S3 Study area and environmental variability in Iran derived by Spatial Principal Components Analysis (SPCA). The composite map represents the three first axes of the SPCA, where each axis which coded by a distinct colour ramp (red, green or blue). The first PCs explained 55.3% of variance in the data set while the second and the third ones accounted for 21.0% and 9.4%, respectively. Several temperature-related variables had positive factor loadings for PC1 and PC2 (Table 1) which were interpreted as temperature factors. Precipitation-related variables had higher loadings in PC3 which was interpreted as a precipitation factor………. 431 Appendix B: Figure S4 Environmental characteristics of the identified climate regions of Iran. Average and range of variation of environmental factors in each of the eight climate regions. The climate regions are: 1) S Khorasan-Sistan; 2) Makran-Hormozgan-S Fars; 3) Makran-Hormozgan-S Alborz-E Zagros-Kerman Mts.; 4) Persian Gulf Makran-Hormozgan-Shores-Khuzestan-Lut; 5) Hyrcanian; 6) Central Basin-N Baluchestan; 7): Kordestan; and 8): N Alborz-Caucasus-Kopet Dag Mts. See Table S2 for names of each variable……… 432 Appendix B: Figure S5 Number of resulting clusters (or bioregions) from the simulations using network-based method with minimum and maximum patch sparse grid cells. In the simulations, the maximum cell capacity ranged from 10 to 300, and the minimum cell size ranged from 1/8° to 1°. The maximum cell size set to 1° and the minimum cell capacity to 1……… 434 Appendix B: Figure S6 The sequence of clustering of the mammal data using network-based method with minimum and maximum patch sparse grid cells. The maximum cell capacity ranged from 10 to 300 and the minimum cell size ranged from 1/8° to 1°. The maximum cell size set to 1° and the minimum cell capacity to 1. The distinct colours represent each bioregion……….. 435
Appendix B: Figure S7 Overlapping maps of the identified climate regions with the 13 main terrestrial ecoregions of Iran (out of 19) (Dinerstein et al., 2017). For the complete list of names of climate regions see table 2, and for names of ecoregions see table S1……… 438 Appendix B: Figure S8 Overlapping maps of the identified bioregions by network-based method (top) and by distance-based method (bottom) with the 13 main terrestrial ecoregions of Iran (out of 19) (Dinerstein et al., 2017). For the complete list of names
Appendix D: Figure S1: The map of the study area, main toponomies mentioned in text, and geographic location of Iran within global context (small inset)………. 454 Appendix D: Figure S2: Predicted changes in mean annual temperature (°C) and total annual precipitation (mm) in Iran in relation to current conditions under the RCP4.5 and RCP8.5 scenarios for 2070. Predictions in all pixels are of temperature increase and precipitation decrease………...………. 455 Appendix D: Figure S3: Distribution patterns of species richness (left column) and hotspots (right column) of 12 functional groups, Threatened species and Total Iranian terrestrial mammals. Hotspots correspond to pixels containing more than 50% of recorded species………. 456 Appendix D: Figure S4: Distribution patterns of hotspot pixels of 12 functional groups, Threatened species and Total Iranian terrestrial mammals in areas with UCT below (green) and above (red) the 29.6 °C threshold in the present and in 2070 according to RCP8.5 scenario. Non-hotspot areas above threshold are shown in grey……… 458 Appendix D: Figure S5: Distribution patterns of hotspot pixels of 12 functional groups, Threatened species and Total Iranian terrestrial mammals in areas with precipitation below (red) and above (green) the 200 mm threshold in the present and in 2080 according to RCP8.5 scenario. Non-hotspot areas below the threshold are shown in grey……… 460
LIST OF ABBREVIATIONS
ABM Adult Body Mass
AET Actual Evapo-transpiration
AOO Area of Occupancy
AR Assessment Report
BIC Bayesian Information Criterion
CBD Convention on Biological Diversity
CR Critically Endangered
DD Data Deficient
DB Diet Breadth
DoE Department of Environment
EN Endangered
EOO Extent of Occurrence
GAMM Generalized Additive Mixed Model
GIS Geographic information systems
GLMM Generalized Linear Mixed Models
GBIF Global Biodiversity Information Facility
GL Gestation Length
GPS Global positioning system
HB Habitat Breadth
HII Human Influence Index
IPCC Intergovernmental Panel on Climate Change
IUCN International Union for Conservation of Nature
KBA World Database of Key Biodiversity Areas
LC Least Concern
NT Near Threatened
PCA Principal Component Analysis
PAs Protected Areas
RCP Representative Concentration Pathway
RE Regionally Extinct
SDGs Sustainable Development Goals
SPCA Spatial Principal Components Analysis
TL Trophic Level
TRI Terrain Ruggedness Index
UCT Upper Critical Temperature
UNEP-WCMC The UN Environment World Conservation Monitoring Centre
UTM Universal Transversal Mercator
UPGMA Unweighted Pair-Group Method using Arithmetic Averages
VU Vulnerable
WA Weaning Age
CHAPTER 1
GENERAL INTRODUCTION
–"….The desire for knowledge for its own sake is the one which really counts... Exploration is the physical expression of the intellectual passion. And I tell you, if you have the desire for knowledge and the power to give it physical expression, go out and explore. If you are a brave man you will do nothing: if you are fearful you may do much, for none but cowards need to prove their bravery. Some will tell you that you are mad, and nearly all will say, 'What's the use?' For we are a nation of shopkeepers, and no shopkeeper will look at research which does not promise him financial return within a year. And so you will sledge nearly alone, but those with whom you sledge will not be shopkeepers: that is worth a good deal. If you march your winter journeys you will have your reward, so long as all you want is
a penguin's egg"
1.1 Biodiversity
Biological diversity, typically shortened to the more user-friendly term biodiversity, is defined as “The variety of organisms considered at all levels, from genetic variants belonging to the same species through arrays of species to arrays of genera, families, and still higher taxonomic levels; includes the variety of ecosystems, which comprise both the communities of organisms within particular habitats and the physical conditions under which they live” (Wilson 1992). Shortly, biodiversity is the variation of life on earth at all levels of biological organization -genes, species or ecosystems-. Though, species are building blocks and units of biodiversity (Wilson 1992).
Biodiversity is the base of ecosystems and its productivity it helps sustain the natural balance that enables life to thrive on Earth (Duffey et al., 2017). It is considered the most valuable resource that humans have (Wilson 1992). Throughout history, biodiversity played a central role for humans, from providing the original source of all crops and domesticated animals in the past, to maintaining healthy, sustainable agricultural systems today (Eldredge 2002). Human survival is largely dependent on the maintenance of biodiversity (Eldredge 1998).
1.1.1 Biodiversity loss
Biodiversity is declining fast and is largely under assault at global scale (Diamond 1989; Pimm et al., 1995; Whittaker et al., 2005; Barnosky et al., 2011). Biodiversity loss or biodiversity crisis is known as the Sixth Extinction. Contrarily to the massive past extinction periods, the current extinction is the result of the huge loss of habitat for all organisms at global scale caused by one amongst the millions of organisms living in the planet, Homo sapiens (Eldredge 2002; Kolbert 2014). The current rate of extinction is 1,000 times more than was normal in the past (Pimm et al., 2014). This negative trend is likely to increase (Pimm et al., 2014) given the demands of a growing human population for food, wood and fuel (Haberl et al., 2007). The pressure of various human activities and their consequences cause major threats to biodiversity and have resulted in a global biodiversity decline (Johnson et al., 2017). Millennia of human activities have dramatically changed the original land and sea ecosystems globally, hence this period is called Anthropocene, in recognition of massive impacts that humans have had on nature (Corlett 2015; Lewis and Maslin 2015). The greatest threats to biodiversity have occurred since the 1950s, particularly in the past decades (Millennium Ecosystem Assessment 2005). Biodiversity is loss as ecosystems are changed to find space for humans, in the form of homes, cities, farms, grazing areas, industrial places, or road networks. These factors are known to cause ‘habitat loss’, which is recognized as the greatest threat to biodiversity globally. Associated to this loss, ‘habitat fragmentation’ appears as another threat to biodiversity when ecosystems became disintegrated, and specie's ranges become reduced
and populations become geographically isolated. Many species experienced population declines or even became extinct as results of ‘over-exploitation’, including hunting, fishing or other kinds of exploitation, which is considered a major threat to the species used as food by humans or that cause conflicts with humans. Some species such as rats, cats, fish, bushes, and trees, amongst many others, benefit from human activities and invaded areas that are outside their natural habitats and cause major problems for native species (referred to as invasive species). Finally, climate change severely affects ecosystems and millions of species have been already been subjected or will be exposed to climate changes in the near future (Figure 1.1). These threats are globally widespread and are considered among the main causes of current and recent severe biodiversity loss by the Convention on Biological Diversity (CBD 2014; Cox et al., 2016). The dramatic decline in global biodiversity, and the need to combat this trend was recognized as a priority issue of the current century (Pimm et al., 2014).
Figure 1.1 Changes in average surface temperature (a) and in average precipitation (b) based on multi-model mean projections
for 2081–2100 relative to 1986–2005 under the RCP2.6 (left) and RCP8.5 (right) scenarios. Stippling (i.e., dots) shows regions where the projected change is large compared to natural internal variability and where at least 90% of models agree on the sign of change. Hatching (i.e., diagonal lines) shows regions where the projected change is less than one standard deviation of the natural internal variability. Source: IPCC (2014).
1.1.2 Global initiatives to halt biodiversity loss
In order to halt biodiversity loss, a wide variety of strategies and tools have been made available for quantifying losses, identifying threats, reducing risks, and mitigating their influence. In addition, several measures were taken to reduce the impact of humans and to reduce the current speed of biodiversity loss (Pimm and Jenkins 2009; CBD 2014). Establishing protected areas, ecological restoration projects, restoration measures, biocontrol and eradication programs of invasive species, anti-poaching measures, improved forecasting of climate change effects, and translocations and reintroduction programmes are amongst the main initiatives proposed (Table 1.1) (Cox et al., 2016).
Table 1.1 Main technical responses to threats to biodiversity. Adapted from Cox et al., (2016).
Main threats Responses
Habitat loss Protected areas
Ecological restoration projects System of quotas and fines Habitat fragmentation Protected areas
Protected areas network Habitat degradation Protected areas
Remediation and restoration measures Stricter emission controls on contaminants System of quotas and fines
Invasive species Eradication Biocontrol Containment
Invasion prevention measures Over-exploitation Anti-poaching measures
System of quotas and fines Climate change Protected areas network
Improved forecasting
Translocations and reintroductions
Several agencies are increasingly interested in assessing the threat status of ecological communities as a key part of conservation planning. These include: (1) the Red List of Threatened Species developed by IUCN-International Union for Conservation of Nature, which documents species extinction risk; (2) Protected Planet developed by IUCN and UNEP-WCMC, which incorporates the World Database on Protected Areas and documents designation of areas for conservation; (3) the World Database of Key Biodiversity Areas (KBA) developed by BirdLife International, Critical Ecosystem Partnership Fund, IUCN, and several other organisations that are currently joining together to establish a KBA Partnership documenting sites contributing significantly to the global persistence of biodiversity,; (4)
Conservation International’s hotspots, which delimit as priority regions the areas that possess > 1.5% of global plant diversity uniquely within their bounds and which have lost > 70% of their original habitat; and (5) the Red List of Ecosystems developed by IUCN and a team of partners, which documents risk of ecosystem collapse (Cox et al., 2016).
In addition, emerging collaborative initiatives are already revolutionizing the accessibility of data sets containing species locations from across the planet. These include the Global Biodiversity Information Facility (GBIF), Encyclopedia of Life, Planetary Biodiversity Inventories, Partnership for Enhancing Expertise in Taxonomy, European Distributed, Institute of Taxonomy, Biodiversity Information Standards, and Catalogue of Life. These are amongst the main global-scale initiatives that are seeking the digital mobilization of biodiversity records and data standards.
The Aichi Biodiversity Targets of the Strategic Plan for Biodiversity 2011– 2020 is another attempt to reduce the rate of biodiversity loss. One of the main targets of the Aichi is to improve the knowledge about biodiversity and its status and trends, and to improve the conservation status of species in decline (CBD, 2014). More recently, amongst the 17 Sustainable Development Goals (SDGs) adopted by the United Nations members in 2015, the SDG 14 - Life Below Water and SDG 15 - Life on Land call for urgent actions by all countries to reduce degradation of natural habitats, to protect and prevent the extinction of threatened species, and to halt biodiversity loss by 2020 (https://sustainabledevelopment.un.org/sdgs).
1.2 Conservation biogeography
Conservation biogeography is defined as “the application of biogeographical principles, theories, and analyses, being those concerned with the distributional dynamics of taxa individually and collectively, to problems concerning the conservation of biodiversity” (Whittaker et al., 2005). Conservation biogeography focuses on the use of biogeographical principles to address conservation problems (Richardson and Whittaker 2010; Whittaker and Ladle 2011). This new scientific field encompasses two research areas, conservation and biogeography, each with a different history. Biogeography is an old field in biology, tracing back to the age of exploration (in 18th and 19th centuries) when early naturalists, such as Buffon (1761), von Humboldt (1807), de Candolle (1855), Sclater (1858), and Wallace (1876), started gathering information on species distributions and making subdivisions of the world into different units based on species distribution (Lomolino et al., 2004). Conservation is a recent field in science, starting in 1980s (e.g. Soulé 1986; Primack 2002). It was just at the beginning of 21 century when leading scientists gathered in the first conference of the International Biogeography Society (held in 2003) combined these two different fields in biology, -biogeography and conservation- and created a new discipline. Conservation
biogeography can be used to provide improved frameworks and information that are important for conservation planning and to halt biodiversity loss (Richardson and Whittaker 2010). Conservation planning of biodiversity requires accurate data on taxonomy and species geographical ranges. Still, there are many gaps (known as shortfalls) in our knowledge of different aspects of biodiversity. These gaps have been divided into three groups: the Linnean shortfall, the Wallacean shortfall and the extinction estimate shortfall (Riddle et al., 2011; but see Hortal et al., 2015; Cox et al., 2016). These shortfalls are known as the most important data deficits for conservation planning and to halt biodiversity loss (Riddle et al., 2011).
1.2.1 The Linnean shortfall
The Linnean shortfall, named after Karl von Linne, refers to the knowledge gaps concerning the question of “how many species occur” (Whittaker et al., 2005). This question, though simple, is essential for assuring quality in biological science and resource management (Riddle et al., 2011). For example, species diversity is the most common measure to assess and monitor biodiversity (Chiarucci et al., 2011). Biodiversity hotspots, which are critically important for biodiversity conservation globally, are selected on the basis of the species they have (Myers et al., 2000). A list of endangered species is necessary for any conservation program and conservation legislation and politics are focused on species preservation. Finally, the success of conservation schemes usually depends on how many species are preserved (IUCN 2018). Nevertheless, generalised lack of systematic surveys and multiple taxonomic uncertainties make current estimates of species diversity far from complete (Isaac et al., 2004; Mace 2004; La Salle et al., 2009; Thuiller et al., 2011). The importance of taxonomy for conservation is critical, given that if species do not have scientific names, it is harder to provide them with legal protection status under national or international laws (O’Brien and Mayr 1991). Thus, an accurate taxonomy of species is essential for conservation planning and for the implementation of national and international protective legislation (Amori et al., 2009; Thomson et al., 2018).
1.2.2 The Wallacean shortfall
The Wallacean shortfall, named after Alfred R. Wallace, refers to the knowledge gaps concerning the geographical distribution of species at global, regional or local scales (Riddle et al., 2011; Cox et al., 2016). Currently, there is a huge gap in the knowledge about the geographical distribution of most species, particularly in the poorly surveyed areas of the world (Lomolino et al., 2010). Global and regional conservation assessments require information on the distribution of biodiversity (Ferrier et al., 2004). For instance, distribution data on species diversity is critical for the implementation of conservation programmes, for designing effective
and well-informed conservation strategies, and to our general understanding of other aspects, such has species ecology or behaviour. Additionally, the Wallacean shortfall may bias the estimates of biodiversity threats (Cox et al., 2016), as the range size is one of the most important criteria in the IUCN Red List, to identify and classify species in danger of extinction (IUCN 2017). Similarly, distribution data are vital for climate change ecology studies, where they used to monitor species range shifts, to estimate species richness and address the effects of climate change on biodiversity hotspots (Powney and Issac 2015; Pacifici et al., 2018).
1.2.3 Extinction estimate shortfall
The extinction estimate shortfall refers to the knowledge gaps concerning the number of species that became extinct (Riddle et al., 2011). Although extinction estimates is aimed at determining how many species have been driven to extinction in the recent past by human activities (Riddle et al., 2011), it can also be used to understand which species are likely to become extinct in the future, or what makes a species more prone to extinction. Given that risks of extinction (or the patterns of species loss) are non-randomly distributed among taxa (Pimm et al., 1988), some taxa are more susceptible to extinction than others (Purvis et al., 2000). Extinction risk analysis are based on the hypothesis that certain species traits more than others may predispose species to extinction, thus extinction vulnerability may be distinct among species (Purvis et al., 2000). Estimating species extinction risk provides relevant information for conservation planning and to help reducing human impacts on biodiversity (Collen et al., 2011; Ducatez and Shine 2017). Indeed, of the central goals of conservation science is to identify species that are at risk of extinction, to understand what makes them vulnerable and to quantify where they are distributed (Davidson et al., 2017).
1.3 Biodiversity conservation
New tools and applications (innovative technologies) for studying and protecting biodiversity and natural resources are rapidly growing. Various tools and schemes have been developed to explore the diversity and distribution of species, and these tools providing significant role in conservation of the valuable biodiversity resources (Sarkar et al., 2006; Hayek and Buzas 2010). These are briefly present in the following sections.
1.3.1 Mapping biodiversity distribution
There is increasing availability of distribution data collected with high spatial resolution. This increase is associated with the dissemination of Global Positioning System (GPS), which allow recording with high spatial precision (georeferencing) the geographical coordinates of the
places where species were observed). Detailed species distribution data are necessary for the identification of biodiversity hotspots, which are critically important for biodiversity conservation globally (Myers et al., 2000).
The distribution data collected can be stored in geodatabases denoting the observations of species, which allow later representing the observations in a defined geometric space. Geographical Information System (GIS) allow visualising and analysing the spatial data (observations) and they have become standard tools in various fields of science. In biodiversity conservations, GIS have been employed for a variety of tasks, including mapping species distributions, locating hotspots of species richness, visualising the results of ecological niche-based models predicting species distributions in multiple spatial and temporal scales, mapping biogeographical patterns (e.g. bioregions, biogroups) (Haines-Young et al., 1993; MacLeod 2015).
1.3.2 Bioregionalisation tools
The identification and mapping of biogeographical regions, known as bioregionalisation process, reveals how different sets of species are spatially grouped (Escalante 2017; Morrone 2018). Bioregionalisation reveals the relationships among regions by grouping them into clusters of meaningful geographical units, i.e. biogeographical regions or bioregions (Escalante et al., 2013; Escalante 2017). Bioregions i.e. areas contain geographically distinct assemblages of species, are important units for research in conservation, historical biogeography, ecology, and evolution (Kreft and Jetz 2010; Holt et al., 2013), and provide valuable information for conservation planning (Whittaker et al., 2005; Richardson and Whittaker 2010). Bioregionalisation has been applied to delineate global zoogeographical regions (Figure 1.2; e.g. Kreft and Jetz 2010; Holt et al., 2013).
Bioregions (and ecoregions) have been shown as effective and ideal surrogates for management purposes, as they can serve as representative array of major distinct ecosystems where conservation efforts need to be focused (Figure 1.3) (Riddle et al., 2011; Dinerstein et al., 2017). Climate regions, i.e. areas exhibiting geographically distinct climatic patterns, also provide valuable information for conservation planning, as they can help to identify priority areas for protection of climatic refugia or evolutionary processes (Brito et al., 2016; Michalak, et al., 2018).
Figure 1.3 The 846 global ecoregions of the world. Source: Dinerstein et al. (2017).
Several methods have been developed to identify bioregions based on species distribution data. The hierarchical clustering based on species turnover has been the one most commonly used (Gonzalez-Orozco et al., 2014). Recently, a method based on networks originally described by Rosvall and Bergstrom (2008) has been proposed for identifying bioregions (Edler et al., 2017). Network methods have been shown to outperform classic distance-based clustering analysis, at least at large-scales (Vilhena and Antonelli, 2015; Bloomfield et al., 2018; Droissart et al., 2018).
1.3.3 Assessing conservation status and regional Red listing
The threatened status of organisms is one of the most widely used indicators of the global risk of extinction for species (Mace et al., 2008) and identification of species at risk of extinction is a central goal of conservation (Collen et al., 2016). At the global scale, the best source of information on the conservation status of species is the IUCN Red List of Threatened Species (available online www.iucnredlist.org; IUCN 2018). The IUCN Red List has two main goals: (i) cataloguing and highlighting those species that are facing a high risk of global extinction, i.e.
those listed as Critically Endangered, Endangered and Vulnerable, often known as those species most in need of conservation attention; and (ii) providing a global index of the state of change of biodiversity (Brooks 2010). There are five quantitative criteria (population reduction, geographic range, small population size and decline, very small or restricted population and quantitative analysis of extinction risk) which are used to determine whether a taxon is threatened or not, and if threatened, which category of threat it belongs to.
Despite decades of efforts, only less than 5% of the world’s estimated 1.8 million described species have been assessed so far (IUCN 2018). Thus, additional efforts are required to fill out gaps in Red listing biodiversity, especially at regional scales. The Red List Criteria have been mostly applied at the global scale, i.e. considering the full range of a species, but they can also be applied at regional scales (IUCN 2012). Regional Red Lists provide a better representation of the status of species within a region in comparison to global assessments (Collen et al., 2006). Practical conservation actions often unfold on local scales, usually within political borders, i.e. at the country level (Cardillo and Meijaard 2012). As such, Regional Red Lists can be used as an effective tool for successful implementation of resources at national level. Regional or National Red List are very useful to guide conservation work at country levels (IUCN 2017), especially species-specific conservation Action Plans or management of Protected Areas (IUCN 2012).
1.3.4 Estimating extinction risk
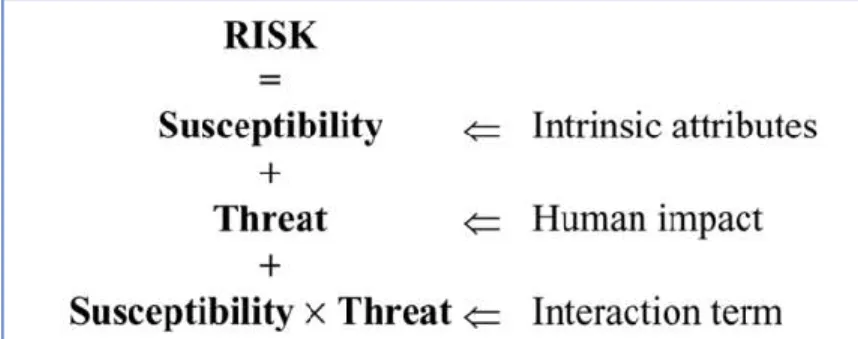
In the last two decades, systematic comparative studies of species extinction risk have become very common (Cardillo and Meijaard 2012), where different statistical methods test for associations between a species’ level of endangerment and information on its biology, ecology, distribution, and threats (Purvis 2008). The rational is that the risk of extinction of a certain species is a function of its intrinsic attributes that render it susceptible to extinction, the intensity and nature of anthropogenic processes that threaten it, and the interaction between these two factors (Figure 1.4; Purvis et al., 2005).
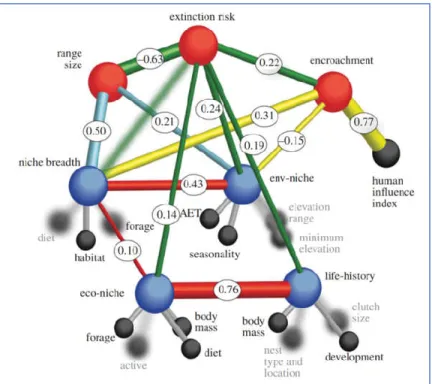
Extinction risk analyses are based in comparative observations made on different species (Purvis 2008). However, we can expect that closely related species are more likely to be similar than other species if the characters evolved randomly and without having associations (Paradis 2012). Thus, most comparative studies use a framework based in phylogenetic analyses because extinction risk may not be randomly distributed across taxonomy and phylogeny (Purvis et al., 2005; Paradis 2012). Closely related species tend to exhibit similar degree of extinction risk because they share many similarities throughout common descent, any of which could influence extinction-proneness and because they tend to live in the same environmental conditions and experienced similar exposures to threat factors (Purvis 2008; Jono and Pavoine 2012). This link between phylogeny and continuous traits values is commonly referred in the literature as ‘phylogenetic signal’ (Purvis et al., 2005; Purvis 2008). Various biological, environmental, ecological and human-related factors have been shown to be important predictors of species extinction risk (Collen et al., 2011; Di Marco et al., 2015). In general, these factors are classified into two main groups: i) intrinsic factors or biological traits; and ii) extrinsic factors, which include environmental and ecological variables and also factors related to human activities (Murray et al., 2011; Ducatez and Shine 2017). Many studies have established relationships between extinction risk and intrinsic traits, such as body mass/size, gestation length, inter-birth interval, weaning age or litter size (e.g. Purvis et al., 2000; Cardillo et al., 2005, 2008; Davidson et al., 2009). Likewise, extrinsic factors related to human activities, such as land cover/use changes, human population density, or road networks, were shown to being linked to increased extinction risk (e.g. Cardillo et al., 2004, 2008; Lee and Jetz 2011). Environmental or ecological factors, such as precipitation, temperature, actual evapotranspiration, trophic level, habitat breadth or diet breadth, also play an important role in the extinction risk of many species (e.g. Davidson et al., 2009; Collen et al., 2011). The intrinsic and extrinsic factors and associated variables are recognized as key predictors of species extinction risk and population decline (Figure 1.5; Lee and Jetz 2011; Murray et al., 2011; Ducatez and Shine 2017).
Figure 1.5 Proposed and tested structural relationship between predictors of species extinction risk in birds. Rods represent
postulated causal relationships and bubbles variables. Geographical range size, the environmental-niche latent variable, encroachment, and the life-history and ecological-niche latent variables (in decreasing order of importance) are the most significant correlates of extinction risk across 8,664 bird species. Source: Lee and Jetz (2011).
Research on extinction risk so far has focused on global scales (in mammals for example; e.g. Davidson et al., 2009; Yackulic et al., 2011), and the distribution of studies is geographically biased to areas such as Oceania and more specifically Australia, while other areas like Asia are almost unstudied (Verde Arregoitia 2016). Further research at local scales is needed because scale is an important factor in extinction risk analyses (Fritz et al., 2009) and also because the set of factors determining extinction risk is not universal across scales (Purvis et al., 2005). In comparison to global analyses, local scale assessments of extinction risk are usually more robust and informative (Collen et al., 2006).
1.3.5 Assessing vulnerability to climate change
Climate is of the major factors known to determine species distributions (Gaston 2000; Li et al., 2015) and projected increase in temperature and decrease in precipitation are expected to greatly impact the distribution patterns of species and functional diversity worldwide (Thomas et al., 2006; Araújo et al., 2013). Climate limits species distribution patterns, as the boundaries of species temperature niche are formed with the upper and lower thermal tolerance of a species (Vaughan et al., 2015). This ‘thermal neutral zone is a range of environmental temperatures over which little or no energy needs to be spent to balance heat loss or gain from the environment. Upper and lower critical temperatures represent the limits
of species thermal neutral zones. Species may be able to cope with increased heat in the future through different ways, for instance by reducing metabolic rates or by evaporative cooling. However, temperatures exceeding tolerance limits, the Upper Critical Temperature UCT (Vaughan et al., 2015), may be detrimental for survival (Bozinovic et al., 2011) and may even result in extinction (Hoffmann et al., 2013). Precipitation is another important driver of species distribution (Engelbrecht et al., 2007) and future changes in precipitation regimes (particularly decreases) may largely affect the geographical distribution patterns of species richness (e.g. Stein and Kreft 2015; Faith et al., 2017). These trends are likely to be amplified in deserts and arid regions, where increased aridity (drought) will result in additional decreased primary productivity and limited resource availability. Below 200 mm of total precipitation per year, the strong correlations between average rainfall and average productivity result in the formation of drylands (Greve et al., 2011; Maestre et al., 2012), with significant changes also in species richness (Maiorano et al., 2011; Ward 2016).
Assessing the vulnerability of biodiversity to global climate change is of strategic importance in management of natural resources (Gillson et al., 2011). At the global and continental scales, several models have been used to describe the patterns of species distributions under climate change (Lenoir and Svenning 2015). These studies (using mainly ecological niche-based models) typically focus on the responses of individual species with projecting their distributions into future climate change simulations to address hypothetical shift in ranges and identifying those that will be in risk. However, in recent years a new approach is emerged that is based on the species’ traits, such as body size, locomotion type, diet, and climate and habitat specialization (Violle et al., 2014; Pacifici et al., 2017 and references therein), as it has been shown that these traits are important in determining species vulnerability to climate change (Foden et al., 2013; Pearson et al., 2014). The species response to climate change, besides being related to the level of exposure (Foden et al., 2013), is largely associated to the life-history traits, which can result from physiological, ecological and evolutionary adaptations (Dawson et al., 2011; Araújo et al., 2013). Functional groups, i.e. groups of species sharing similar functional traits are known as proper surrogate measure for functional diversity; Cadotte et al., 2011). As such, including functional group diversity in climate change impact assessments can improve our understanding about which species and geographic areas are the more vulnerable ones (Foden et al., 2013). Mapping the spatial location of climate risk areas is also a very important factor. For instance, it is predictable that species living in arid areas will be much more exposed to increase in temperature or reduced precipitation, as deserts are recognized as areas where both temperatures rise, and reduced precipitation will be at the maximum level (Loarie et al., 2009). Mapping the location of ‘hotspots’, i.e. areas with the highest numbers of species, that are likely to be at risk in the near future can be used for identifying global hotspots of species at risk from climate change, which is critical data for
long-term biodiversity conservation (Figure 1.6; Pacifici et al., 2018). Climate change impacts on biodiversity distribution have been largely made at global or large scales (Lenoir and Svenning 2015), while few studies have assessed their impacts at regional or local scales. Additionally, the distribution of studies is geographically biased to Europe, North America and Australia, while other areas remain almost unstudied (Pasgaard et al., 2015).
Figure 1.6 Maps of hotspots of species richness of terrestrial non-volant mammals (a) and proportion of species likely to be
negatively impacted by climate change in the future under RCP8.5 scenario (b). Source: Pacifici et al. (2018).
1.4 Study area: Iran
Iran cover 1,648,195 square kilometres, an area almost as large as United Kingdom, France, Germany and Spain together, and it is a heterogeneous country situated in the southwest Asia, which commonly referred to as Middle East (Figure 1.7). It is surrounded by Central Asia and Caucasus Mountains in the north and Anatolian plateau and Mesopotamian region in the west, Persian Gulf and Oman Sea in the south and Afghanistan and Pakistan in the east.
Iran displays high physiographic (or topographic) complexity, with elevations ranging from -60 to 5,671 meters at the summit of Mount Damavand, which is higher than any peak in Eurasia west of the Hidukush. Over half of the country is mountainous and is above 1,000 meters with two large mountain ranges that extended from north-west to north-east (Alborz) and south-central (Zagros) (Firouz 2005). The Alborz Mountains start from the Azerbaijan frontier ranges (Caucasus) in the northwest and extend northeast, not far from the border with Turkmenistan. The Zagros Mountains extended from southern section of Caucasian region, all around of the western section of country, to the Jebal Barez and Makran Mountains in southeast in Baluchestan district. These high mountains, with elevations over 4-5,000 meters, form barriers that separated the humid areas of the Caspian Coast and Anatolian-Mesopotamian region from the large arid areas of the Central Basin (Firouz 2005). Geologically, the Iranian plateau is a very complex region dates from Tertiary period, although older formations (e.g. from the Pre-Cambrian) also exist in many areas (Fisher 1968).
Figure 1.7 The map of the study area, main toponomies mentioned in text, and geographic location of Iran within global context