Cláudia Alexandra Canhoto Batista
Licenciada em FarmáciaLong-term hypercaloric diet
consumption exacerbates age-induced
metabolic dysfunction:
Beneficial effects of CSN denervation
Dissertação para obtenção do Grau de Mestre em Bioquímica para a Saúde
Orientadora: Prof.ª Doutora Sílvia Vilares Conde, Professora Auxiliar, NOVA Medical School,
Faculdade de Ciências Médicas, UNL
Co-orientadora: Doutora Joana Sacramento, CEDOC – NOVA Medical School, Faculdade de
Ciências Médicas, UNL
Cláudia Alexandra Canhoto Batista
Licenciada em Farmácia
Long-term hypercaloric diet
consumption exacerbates age-induced
metabolic dysfunction:
Beneficial effects of CSN denervation
Dissertação para obtenção do Grau de Mestre em Bioquímica para a Saúde
Orientadora: Prof.ª Doutora Sílvia Vilares Conde, Professora Auxiliar, CEDOC – NOVA Medical School,
Faculdade de Ciências Médicas, UNL
Co-orientadora: Doutora Joana Sacramento, CEDOC – NOVA Medical School, Faculdade de
Ciências Médicas, UNL
Faculdade de Ciências Médicas, Universidade Nova de Lisboa
-t er m h yp er ca lo ric di et co nsu m pt io n exa ce rb at es ag e-in du ce d m et ab ol ic dysf un ct io n: B en ef ici al e ff ect s of C S N d en er va tio n C lá ud ia B at ist a
All animal studies described in this thesis were carried out in accordance with the European Union Directive for Protection of Vertebrates Used for Experimental and Other Scientific Ends (2010/63/EU). Experimental protocols were part of the projects that were approved by the NOVA Medical School|Faculdade de Ciências Médicas Ethics Committee (CEFCM) and by the Direção-Geral de Alimentação e Veterinária (DGAV).
Projects approved by the Ethics Committee of NMS|FCM-UNL:
- Corpo carotídeo: um potencial alvo terapêutico para as doenças metabólicas. - Carotid chemoreceptor neuromodulation for the treatment of type ii diabetes
The present work originated the following communications:
Oral communications in international meetings:
Cláudia C. Batista, Joana F. Sacramento, Bernardete F. Melo, Sílvia V. Conde. (2019)
Carotid sinus nerve denervation ameliorates lipid profile and decreases lipid accumulation in the liver in aged animals and in animals with metabolic dysfunction exacerbated by long-term hypercaloric diet consumption. 7th EASD NAFLD Study
Group Meeting, Lisbon, Portugal
Cláudia C. Batista, Joana F. Sacramento, Bernardete F. Melo, Sílvia V. Conde. (2019)
Carotid sinus nerve denervation improves hepatic function in young and old animals with metabolic dysfunctions exacerbated by long-term hypercaloric diet consumption. Physiology 2019, Aberdeen, United Kingdom.
Oral communications in national meetings:
Cláudia C. Batista, Joana F. Sacramento, Bernardete F. Melo, Cláudia S. Prego, Sílvia
V. Conde. (2019) Effect of carotid sinus nerve denervation on long-term hypercaloric diet exacerbation of age-induced metabolic dysfunction: focusing on the liver. SPF 2019, Porto, Portugal.
Cláudia C. Batista, Joana F. Sacramento, Bernardete F. Melo, Sílvia V. Conde. (2019)
Long-term hypercaloric diet consumption exacerbates age-induced metabolic dysfunction: Beneficial effects of CSN denervation. Jornadas Intercalares das Dissertações Anuais dos Mestrados do DQ e do DCV, Almada, Portugal
Poster communications in international meetings:
Cláudia C. Batista, Joana F. Sacramento, Bernardete F. Melo, Sílvia V. Conde. (2019)
Carotid sinus nerve denervation improves hepatic function in young and old animals with metabolic dysfunctions exacerbated by long-term hypercaloric diet consumption. Physiology of Obesity and Diabetes satellite symposium, Aberdeen, United Kingdom.
Joana F. Sacramento, Cláudia C. Batista, Bernardete F. Melo, Cláudia S. Prego, Sílvia V. Conde. (2019) Impact of carotid sinus nerve resection on metabolic dysfunction induced by ageing and by long-term hypercaloric diet consumption in rats. Physiology 2019, Aberdeen, United Kingdom.
Poster communications in national meetings:
Joana F. Sacramento, Cláudia C. Batista, Bernardete F. Melo, Cláudia S. Prego, Sílvia V. Conde. (2019) O consumo de dieta hipercalórica a longo prazo agrava a disfunção metabólica induzida pela idade: efeitos benéficos da ressecção do nervo do seio carotídeo. 15th Portuguese Congress of Diabetes, Vilamoura, Portugal.
Cláudia C. Batista, Joana F. Sacramento, Bernardete F. Melo, Sílvia V. Conde. (2019)
Carotid sinus nerve bilateral resection ameliorates hepatic function in young and old animals with dysmetabolism exacerbated by long-term hypercaloric diet consumption. iMed Conference 11.0, Lisbon, Portugal.
Acknowledgements
There are several people that I would like to thank for their role in this past year. I would like to start thank to my coordinator Professor Sílvia Conde for allowing me to be a part of her team and for everything that she taught me. I really appreciate all that she has done for me until now and for the support that she gave me in the past year. To allow myself to grow and be challenged with several oral communications, that started as a dreadful event and now they are a “little” bit less stressful.
To my co-coordinator Joana Sacramento a big thanks, for always being there even if it was at distance. To João Guimaraes and Cláudia Prego thanks for helping me in the beginning and for all the laughs. To Bernardete Melo and Fátima Martins for all the “fun” days spent in the glucose uptake, with the only joy of listening to the radio and singing along to Ed Sheeran.
To Solange Farreca and Adriana Capucho, thanks for the times spent doing western blots and the dramatic moments in front of the Chemidoc hoping to get bands.
I also would like to thank to Filipa Coutinho and Rita Pedro for not only the support that they gave me in the last year but also for always being there for me in the last six. For all the nonsense conversations that at the end we didn’t even know what was going on but we just kept going for some reason. “Camelas” i want you to know how much I appreciate your friendship.
To master girls, Iara Silva, Elisa Cabral and Filipa Ribeiro, a huge thanks to put up with me and to have been a part of my live in what may have been the two most stressful year of my life. Thanks for all the times that i needed a little “pick me up” and you were there to do so and more.
Last, but not least, to my family for being so supportive of me. A special thanks to my parents, Francisco and Graciete, words can’t express how grateful i am for all the opportunities that you gave me and for always encourage me to follow my dreams. To my sister, Sara AKA “Becas” for being the person that you are and being always there for me.
Abstract
The increasing incidence of metabolic disorders, like insulin resistance, type 2 diabetes (T2D), dyslipidemia, non-alcoholic fatty liver disease (NAFLD), obesity and metabolic syndrome (MS), has reached epidemic proportions. Knowing that life expectancy is increasing worldwide and that ageing is associated with a high prevalence of these disorders, it is crucial to stop this epidemic.
The carotid bodies (CB) are peripheral chemoreceptors, classically defined as O2
sensors, also implicated in energy homeostasis. Our previous work showed in young animals submitted to 25 weeks of hypercaloric diets that the abolition of the CB activity restored the insulin sensitivity and glucose tolerance. Knowing that age is associated with the development of insulin resistance, the general aim of this work was to investigate the impact of long-term hypercaloric diet consumption and the abolishment of CB activity, through the CB sensitive nerve resection, the carotid sinus nerve (CSN) on glucose homeostasis in older rats. Also, knowing that NAFLD is one of the core comorbidities associated with dysmetabolism, we have focus on liver metabolism. Aged rats were fed with high-fat high-sucrose (HFHSu) diet for 44 weeks and after this period half was submitted to CSN resection and the other to a sham surgery. Animals were followed-up during 9 weeks for insulin sensitivity, glucose tolerance, fasting plasma glucose, weight and fat variation. After a terminal experiment lipid profile, liver lipid content and hepatocellular analysis were assessed. Abolishment of the CB/CSN activity in old rats reduced weight gain, restored insulin sensitivity and glucose tolerance, decreased plasma triglycerides and had beneficial impact on liver function.
Concluding, this study demonstrated for the first time that the modulation of the CB activity might be a potential therapeutic intervention in age-induced and diet exacerbated metabolic dysfunctions, as well in liver-associated metabolic dysfunction in young and old animals.
Key words: Aging, carotid body, carotid sinus nerve resection, dyslipidemia, insulin
resistance, liver, metabolic diseases, non-alcoholic fatty liver disease, sympathetic nervous system, type 2 diabetes.
Resumo
A crescente incidência de distúrbios metabólicos, como resistência à insulina, diabetes tipo 2 (T2D), dislipidemia, doença hepática gordurosa não alcoólica (NAFLD), obesidade e síndrome metabólica (SM), atingiu proporções epidêmicas. A expectativa de vida está a aumentar mundialmente e o envelhecimento está associado a uma alta prevalência desses distúrbios, sendo crucial parar esta epidemia.
Os corpos carotídeos (CB) são quimiorreceptores periféricos, classicamente definidos como sensores de O2 implicados na homeostase energética. Trabalhos anteriores
mostraram em animais jovens com 25 semanas de dietas hipercalóricas, que a abolição da atividade do CB restaurava a sensibilidade à insulina e a tolerância à glucose. Sabendo que a idade contribui para a resistência à insulina, o objetivo geral deste trabalho foi investigar em ratos velhos o impacto de dietas hipercalóricas perlongadas e abolição da atividade do CB, através da ressecção do nervo do seio carotídeo (CSN) na homeostase da glucose. Sabendo que a NAFLD é uma das principais comorbidades associadas ao dismetabolismo, focamos no metabolismo hepático. Ratos idosos foram alimentados com dieta hipercalórica (HFHSu) por 44 semanas, após esse período, metade foi submetido à ressecção do CSN e a outra à cirurgia sham. Os animais foram acompanhados durante 9 semanas, avaliando-se a sensibilidade à insulina, tolerância à glucose, glicemia em jejum, variação de peso e gordura. Após o procedimento terminal o perfil lipídico, conteúdo lipídico hepático e análise hepatocelular foram avaliados. A abolição da atividade CB/CSN em ratos idosos reduziu o ganho de peso, restaurou a sensibilidade à insulina e a tolerância à glucose, diminuiu os triglicerídeos plasmáticos e teve um impacto benéfico na função hepática.
Concluindo, este estudo demonstrou pela primeira vez que a modulação da atividade do CB pode ser uma potencial intervenção terapêutica em disfunções metabólicas induzidas pela idade, exacerbadas pela dieta, assim como dismetabolismo associado ao fígado em animais jovens e velhos.
Palavras-chave: Envelhecimento, corpo carotídeo, ressecção do nervo carotídeo,
resistência à insulina, fígado, doenças metabólicas, doença hepática gordurosa não alcoólica, sistema nervoso simpático, diabetes tipo 2.
List of Contents
Acknowledgements ... xi
Abstract ... xiii
Resumo ... xv
List of Contents ... xvii
Abbreviations ... xix
List of Figures ... xxi
List of Tables ... xxiii
1. Introduction ... 1
1.1. Metabolic Diseases ... 1
1.2. Metabolic Syndrome ... 1
1.1.1. Type 2 Diabetes Mellitus ... 4
1.1.1.1. Insulin ... 6
1.1.1.1.1. Insulin Signaling Defects in Type 2 Diabetes and Insulin Resistance . 8 1.1.1.2. Glucose Homeostasis ... 9
1.1.1.2.1. Glucose Homeostasis Defects in Type 2 Diabetes ... 11
1.1.2. Non-Alcoholic Fatty Liver Disease ... 12
1.1.3. Dyslipidemia ... 15
1.3. Sympathetic Nervous System and Metabolic Dysfunction ... 17
1.4. Carotid Body ... 18
1.5. Aging ... 23
1.5.1. Aging and Carotid Body ... 25
2. Aims ... 29
3. Methods ... 31
3.2.1. Measurement of the Insulin Sensibility ... 33
3.2.2. Measurement of Glucose Tolerance ... 34
3.3. Lipid profile Evaluation ... 34
3.4. Liver´s Lipid Quantification ... 34
3.4.1. Liver´s Total Lipid Content ... 34
3.4.2. Liver´s Triglyceride Content ... 35
3.5. Histologic Analysis ... 36
3.6. Data Analysis ... 37
4. Results ... 39
4.1. Effect of long-term hypercaloric diet intake and carotid sinus nerve resection on fasting glucose in old animals ... 41
4.2. Effect of long-term hypercaloric diet intake and carotid sinus nerve resection on insulin sensitivity in old animals ... 41
4.3. Effect of long-term hypercaloric diet intake and carotid sinus nerve resection on glucose tolerance in old animals ... 44
4.4. Effect of long-term hypercaloric diet intake and carotid sinus nerve resection on weight gain in old animals ... Erro! Marcador não definido. 4.5. Effect of long-term hypercaloric diet intake and carotid sinus nerve resection on fat deposition in old animals ... 46
4.6. Effect of long-term hypercaloric diet intake and carotid sinus nerve resection on total cholesterol and triglycerides in young and old animals ... 47 4.8. Effect of long-term hypercaloric diet intake and carotid sinus nerve resection on total lipid and triglycerides content in the liver in young old animals ... Erro!
Marcador não definido.
4.8. Effect of long-term hypercaloric diet intake and carotid sinus nerve resection on the liver of young old animals ... Erro! Marcador não definido.
Abbreviations
AACE American Association of Clinical Endocrinology
AHA/NHLBI American Heart Association/National Heart, Lung, and Blood Institute APDP Associação Protectora dos Diabéticos de Portugal
apoB Apolipoprotein B ATP Adenosine triphosphate AUC Area under the curve BAT Brown adipose tissue BMI Body mass index BP Blood Pressure CA Catecholamines CB Carotid bodies CE Cholesterol-esters CM Chylomicrons CSN Carotid sinus nerve CTL Control
CVD Cardiovascular disease
DHEAS Dehydroepandrosterone sulphate EDTA Ethylenediaminetetraacetic acid
EGIR European Group for the study of Insulin Resistance FA Fatty acids
FFA Free fatty acids
FPG Fasting Plasma Glucose GLP1 Glucagon-like peptide 1 GLUT2 Glucose transporter type 2 GLUT4 Glucose transporter type 4 HDL High-density lipoprotein HF High-fat
HFHSu High-fat high-sucrose HSu High-sucrose
H&E Hematoxylin & eosin
IDF International Diabetes Federation IGF-1 Insulin-like growth factor-1 IMM Instituto de Medicina Molecular IRS Insulin receptor substrate
ITT Insulin tolerance test
KITT Constant rate for glucose disappearance
LDL Low-density lipoproteins
MAPK Mitogen-activated protein kinase MS Metabolic syndrome
NAFL Non-alcoholic fatty liver
NAFLD Non-alcoholic fatty liver disease NASH Non-alcoholic steatohepatitis
NCEP:ATPIII National Cholesterol Education Program: Adult Treatment Panel III OCT Optimal cutting temperature
OGTT Oral glucose tolerance test PI3K Phosphatidylinositol 3-kinase PKB/AKT Protein kinase B
ROS Reactive oxygen species SD LDL Small-dense LDL
SNS Sympathetic nervous system TG Triglycerides
T2D Type 2 diabetes
VLDL Very low-density lipoprotein WAT White adipose tissue
List of Figures
Figure 1. 1. Number of people with diabetes worldwide and per region in 2017 and
2045 (20-79 years) ... 4
Figure 1. 2. Insulin signaling pathway. The increase in glucose levels stimulates the
release of insulin from the pancreatic β-cells ... 7
Figure 1. 3. Insulin and glucagon effects on glucose homeostasis. ... 10 Figure 1. 4. Natural history of type 2 diabetes. ... 12 Figure 1.5. Schematic progression of non-alcoholic fatty liver disease (NAFLD) and
estimated prevalence of the disease stages. ... 13
Figure 1. 6. Pathogenesis of Non-Alcoholic Fatty Liver Disease (NAFLD). ... 15 Figure 1. 7. Role of insulin resistance in T2D dyslipidemia ... 16 Figure 1. 8. Carotid body (CB) location and innervation (A), with the celular
arragenment (B) ... 19
Figure 1. 9. Effect of the carotid sinus nerve (CSN) resection on the insulin sensitivity
in young controls (CTL) (A) and HFHSu (B) animals ... 21
Figure 3. 1. Representative scheme of the experimental protocol performed on Wistar
rats of 25 and 53 weeks and their respective diets……….. 31
Figure 3. 2. Scheme from the Folch’ adapted protocol……….. 35 Figure 4. 1. Effect of long-term hypercaloric diet consumption and of carotid sinus
nerve (CSN) resection on the body weight (A) and body weight change in old controls (C TL) and HFHSu animals.. ... 40
Figure 4. 2. Effect of the carotid sinus nerve (CSN) resection on the insulin sensitivity
in old controls (CTL) and HFHSu animals. Control (A) and high-fat high-sucrose (HFHSu) (B) old animals submitted to a sham procedure. ... 43
Figure 4. 3. Effect of the long-term hypercaloric diet consumption and of carotid sinus
nerve (CSN) resection on glucose tolerance in controls (CTL) and fat high-sucrose (HFHSu) aged-animals. ... 45
Figure 4. 4. Effect of long-term hypercaloric diet consumption and of carotid sinus
nerve (CSN) resection on the plasmatic lipid profile of young and old animals: total cholesterol (A) and triglycerides (B) plasma levels. ... 48
Figure 4. 5. Effect of long-term hypercaloric diet consumption and of carotid sinus
nerve (CSN) resection on the level of total lipids content within the liver of young and old animals. ... 49
Figure 4. 6. Effect of long-term hypercaloric diet consumption and of carotid sinus
nerve (CSN) resection on triglycerides levels within the liver of young and old animals. ... 50
Figure 4. 7. Macroscopic images of the effect of long-term hypercaloric diet
consumption of the carotid sinus nerve (CSN) resection in the liver of young and old animals. ... 51
Figure 4. 8. Hematoxylin and Eosin (H&E) staining displaying the effect of long-term
hypercaloric diet intake and the effect of chronic carotid sinus nerve (CSN) resection on the liver of young and old rats. ... 52
Figure 4. 9. Effect of long-term hypercaloric diet and of carotid sinus nerve (CSN)
resection on the hepatocellular scores of young and old animals: fatty change (A), hepatocellular damage (B), inflammation (C) and fibrosis (D). ... 53
List of Tables
Table 1.1. International Diabetes Federation (IDF) definition for Metabolic Syndrome
(MS)………...3
Table 1.2. Glycemic reference values from the Associação Protectora dos Diabéticos
de Portugal (APDP)...5
Table 1.3. Area under the curve (AUC) obtained from the analysis of the glucose
excursion curves in young control (CTL) and high-fat high-sucrose (HFHSu) animals with or without carotid sinus nerve (CSN) resection……….22
Table 1.4. Effect of carotid sinus nerve resection (CSN) on plasma fasting glucose
(mg/dl) in control (CTL) and HFHSu young animals……….23
Table 1.5. Effect of carotid sinus nerve (CSN) resection on total, perinephric,
perienteric and epididymal fat in control and HFHSu young animals…………23
Table 3.1. Hematoxylin and Eosin (H&E) Liver Scores………37 Table 4.1. Effect of carotid sinus nerve resection (CSN) on fasting glucose (mg/dl)
control (CTL) and HFHSu animals……….41
Table 4.2. Effect of the long-term hypercaloric diet consumption and of carotid sinus
nerve (CSN) resection on the area under the curve (AUC) obtained from the analysis of the glucose excursion in controls (CTL) and high-fat high-sucrose (HFHSu) aged-animals. ...46
Table 4.3. Effect of carotid sinus nerve (CSN) resection on total, perinephric,
1. Introduction
1.1. Metabolic Diseases
Metabolic diseases are any type of disorder that disrupts the normal body metabolism, and comprises a broad spectrum going from congenital to acquired conditions (Enns, 2019). Acquired metabolic diseases like obesity, type 2 diabetes (T2D), hypertension, insulin resistance, hyperglycemia, non-alcoholic fatty liver disease (NAFLD), hyperlipidemia and metabolic syndrome (MS) are the most common types and have reach an alarming incidence rate both in developed and developing countries (Heindel et al., 2017; Hossain, Kawar and Nahas, El, 2007; Hotamisligil, 2010). These metabolic diseases are considered multifactorial disorders intertwine with each other, with increasing prevalence and incidence (Kassi et al., 2011). Moreover, a systemic deterioration that resembles a longevity-related one is common in these metabolic diseases (Hotamisligil, 2010).
1.2. Metabolic Syndrome
The MS is a cluster of complex disorders and is considered a major public-health epidemic, with increasing socioeconomic impact.(Alberti, Zimmet and Shaw, 2005) MS comprises a group of metabolic abnormalities that increase the risk of coronary heart disease, other forms of cardiovascular diseases, obesity and T2D (Grundy, 2004; Kassi et al., 2011). The MS’ main risk factors include: obesity, insulin resistance, raised fasting plasma glucose, hypertension and atherogenic dyslipidemia (elevated serum triglycerides (TG) and apolipoprotein B (apoB), increased small low-density lipoproteins (LDL), and reduced levels of high-density lipoprotein (HDL)) (Grundy, 2016; Grundy et al., 2005; Kassi et al., 2011). Moreover, MS is also associated with other metabolic abnormalities, such as a chronic proinflammatory and prothrombotic state, NAFLD and obstructive sleep apnea (Kassi et al., 2011).
Named originally “Syndrome X” by Reaven (1988), was later renamed MS. Multiple definitions have been suggested throughout the years and because of that different definitions of the disease where used to identify patients (Mancia et al., 2010). Due to the multiplicity of definitions is very challenging to compare data from different studies
and to determine the prevalence of this epidemic disorder. Although, it is estimated that around 20-25% of the adults worldwide have MS, a number that continue to increase (Nolan et al., 2017). Data from the National Center for Health Statistics, estimates that in the US 1 in each 3 has MS (National Center for Health Statistics, 2012).
Initially, insulin resistance was suggested as the common and key pathological feature of MS, as it contributes to the development of T2D and cardiovascular diseases (Reaven, 1988). But now the MS’ definition was reviewed by several international organizations and expert groups and currently takes into account different parameters, such as, differences in population age, sex, genetic background, diet and physical activity (Alberti, Zimmet and Shaw, 2005; Devers, Campbell and Simmons, 2016; Krishnadath et al., 2016; Novak et al., 2013; Pan and Pratt, 2008).
The MS’ most widely used definitions are from the National Cholesterol Education Program: Adult Treatment Panel III (NCEP:ATPIII) and the International Diabetes Federation (IDF) (Table 1.1), that focus mainly on waist circumference, which is an alternative measure of central obesity. While, the definitions from World Health Organization (WHO), European Group for the study of Insulin Resistance (EGIR) and American Association of Clinical Endocrinology (AACE) focused on insulin resistance (Cornier et al., 2008; Kassi et al., 2011). Additionally, the American Heart Association/National Heart, Lung, and Blood Institute (AHA/NHLBI) states that the criteria to identify MS is based in the presence of three or more of the five risk factors (Grundy et al., 2005) (Table 1.1).
The MS, as stated before, is a term for a cluster of endogenous risk factors that increase the risk of developing other metabolic diseases, like T2D and obesity. MS can be seen as a vicious cycle that fuels itself, as its incidence increases with other metabolic diseases and its manifestation triggers other metabolic diseases as well as the prevalence of the previously established disorders (Girod and Brotman, 2003). The syndrome is not caused by a single factor but instead by an array of risk factors (Kassi et al., 2011). MS proves to be very heterogeneous in the population, as it can be clinically manifested in a variety of ways, especially among different racial and ethnic groups. Thus, making it very challenging to create guidelines for its definition (Mancia et al., 2010).
Clinically, the first approach to manage MS is based on lifestyle interventions aiming to lower hypertension, fasting plasma glucose, atherogenic dyslipidemia, abdominal obesity and insulin resistance. Usually, lifestyle changes are difficult to implement or are not enough to manage MS and there is the need to introduce a pharmacological approach (Grundy et al., 2005; Thorp and Schlaich, 2015). Due to its multifactorial components and to its numbers and its increase additional research is needed to better understand the key pathological feature of MS.
Table 1.1 - International Diabetes Federation (IDF) definition for Metabolic Syndrome (MS).
For a person to be defined as having metabolic syndrome they must have: • Central obesity*
• Plus any two of the following four factors: Raised Triglycerides ≥ 150 mg/dl (1.7 mmol/l)
or specific treatment for this lipid abnormality
Reduced HDL Cholesterol
< 40 mg/dl (1.03 mmol/l) in males < 50 mg/dl (1.29 mmol/l) in females
or specific treatment for this lipid abnormality Raised blood
Pressure (BP)
Systolic BP ≥ 130 or diastolic BP ≥ 85 mm Hg or treatment of previously diagnosed hypertension
Raised Fasting Plasma Glucose
(FPG)
FPG ≥ 100 mg/dl (5.6 mmol/l) or previously diagnosed T2D
If above 100 mg/dl or 5.6 mmol/l, OGTT is strongly recommended but is not necessary to define presence of the syndrome.
* Central obesity is defined as waist circumference with ethnicity specific values. If body mass index (BMI) is > 30 kg/m2, central obesity can be assumed and waist circumference does not need to be measured. In Europe, values for waist circumference are ≥ 94 cm in males and ≥ 80 cm in females. OGTT – Oral Glucose Tolerance Test.
Figure 1. 1. Number of people with diabetes worldwide and per region in 2017 and 2045 (20-79 years) (IDF, 2017).
1.1.1. Type 2 Diabetes Mellitus
According to the American Diabetes Association and WHO, the classification of diabetes mellitus comprises four clinical classes: type 1 diabetes, T2D, gestational diabetes and other particular types of diabetes duo to other specific causes (Reviriego, 2010; World Health Organization, 2006). The focus fall on the T2D as it is the most common type of diabetes, accounting for approximately 90% of all cases of the disease and considered the most common chronic diseases in the world (Bruno et al., 2005; Holman, Young and Gadsby, 2015). The high prevalence of this disease is associated with changes in lifestyle, leaning towards reduced physical activity, sedentarism and increasing rates of obesity (Shaw, Sicree and Zimmet, 2010).
According with IDF statistics it is believed that in 2017, 425 million people worldwide had diabetes, a number that is expected to continue to increase and by 2045, it is estimated that 629 million people will have diabetes (Figure 1.1) (International Diabetes Federation - Diabetes atlas (8th edition), 2017). Furthermore, in the Portuguese population, it is estimated that 34.5% of the population, between the ages of 20-79 years, have diabetes or pre-diabetes and 44% of people with diabetes are unaware of their condition (Gardete-Correia et al., 2010).
The early onset of this disease is called prediabetes and is characterized by a pancreatic β-cell dysfunction and a decrease in the insulin sensitivity, that starts before glucose changes are detectable (Tabák et al., 2012). The risk factors for prediabetes are the same as the ones for T2D and include: overweight, aging, poor diet and excess of calories, reduced physical activity, smoking and family history (Forouzanfar, Alexander and Anderson, 2015; Vazquez et al., 2007). However, people with prediabetes have a higher risk of developing T2D, yet not everyone with prediabetes will develop T2D. Prediabetes is typically defined as blood glucose levels higher than normal, but bellow the diabetes diagnostic threshold for impaired glucose tolerance or impaired fasting glucose (Tabák et al., 2012) (Table 1.2 ). In contrast, T2D is defined by higher blood glucose levels ( ≥ 126 mg/dl), being characterized by an intolerance to glucose and impaired fasting glucose, and also by a defect in the insulin secretion (β-cell dysfunction) and insulin action (insulin resistance) (Table 1. 2). Also, T2D is accompanied by dysregulation of carbohydrates, lipid and protein metabolism (DeFronzo et al., 2015). Thus, the development of T2D from normal glucose tolerance to glucose intolerance and insulin resistance proves to be a continuous process, where several factors contribute to β-cell dysfunction, such as: aging, genetic abnormalities in incretin hormones (glucagon-like peptide 1 (GLP1) and gastric inhibitory polypeptide), lipotoxicity, glucotoxicity, reactive oxygen stress, hypersecretion of islet amyloid polypeptide and activation of inflammatory pathways (DeFronzo et al., 2015).
Taking into account all the T2D aspects, including the presence of defects in both insulin secretion (β-cell dysfunction) and insulin action, it is understandable the interest in the identification and implementation of interventions to prevent or delay the diseases’ onset (Kashyap and Defronzo, 2007).
Table 1.2 –Glycemic reference values from the Associação Protectora dos Diabéticos de Portugal (APDP).
Parameters Hypoglycemia Normal Prediabetes T2D
Fasting Plasma
Glucose < 70 mg/dl 70-100 mg/dl 100-126 mg/dl ≥ 126 mg/dl
2 Hours
1.1.1.1. Insulin
Insulin is a peptide hormone, organized in two polypeptide chains, A and B, connected by disulphide bridges, essential in regulation of carbohydrate and fat metabolism in the body.
In order to exert its action on glucose metabolism, insulin is synthesized and release by pancreatic β-cells, into the bloodstream. In the insulin sensitive tissues, like skeletal muscle, liver and fat tissue, insulin binds to its specific receptor, the insulin receptor. When insulin binds to its receptor it initiates the uptake of glucose from the blood into the insulin-sensitive tissue, as skeletal muscle and fat tissue (Kahn and White, 1988; Saltiel and Kahn, 2001). In the liver, insulin stimulates glycogen production and blocks glucose production, increasing the fatty acids (FA) content in the tissue. When the maximum capacity the FA in the liver is reached FA are released into the bloodstream and stored in the adipose tissue. Moreover, in the adipose tissue insulin inhibits the breakdown of TG into glycerol and FA (lipolysis) (Röder et al., 2016).
The insulin receptor, a tetrameric glycoprotein, from the subfamily of the tyrosine kinases receptors, consists of four subunits: two α-subunit entirely extracellular, containing the insulin-binding domain, and two transmembrane β-subunit, expressing insulin-stimulated kinase activity (Guo, 2014; Pessin and Saltiel, 2000; Saltiel and Kahn, 2001). The binding of insulin to the α-subunit of the insulin receptor leads to the dimerization and formation of the complex, α2β2 in the cell membrane and consequently the autophosphorylation of the β-subunit, thus activating the insulin receptor tyrosine kinase (Bajaj and DeFronzo, 2003) (Figure 1.2). This activation results in the phosphorylation of members of insulin receptor substrate (IRS) family, namely IRS1 and IRS2, Gap-1 and Shc (Bajaj and DeFronzo, 2003).
Figure 1. 2. Insulin signaling pathway. The increase in glucose levels stimulates the release of
insulin from the pancreatic β-cells. Insulin binds to its insulin receptor, in insulin-sensitive tissues (adipose tissue and muscle), initiating a cascade of events that starts with phosphorylation of members of the insulin receptor substrate (IRS) family leading to the activation of phosphatidylinositol 3-kinase (PI3K), leading to the translocation of glucose transporter vesicles to the plasmatic membrane, thus enabling the uptake glucose. In the skeletal muscle and adipose tissue the glucose transporters are type 4 (GLUT4) (Saltiel and Kahn, 2001).
The phosphorylated IRS1 and IRS2 proteins bind to a heterodimeric enzyme, phosphatidylinositol 3-kinase (PI3K), which is composed by a p85 regulatory subunit and a p110 catalytic subunit (Bajaj and DeFronzo, 2003). Once PI3K is activated, it initiates a signaling pathway that activates protein kinase B (PKB/AKT), leading to the translocation of glucose transporter type 4 (GLUT4) vesicles to the plasmatic membrane of muscle cells and adipocytes and to the activation of glycogen synthase (Hajduch, Litherland and Hundal, 2001; Saltiel and Kahn, 2001). In the liver, the major glucose transporter is the glucose transporter type 2 (GLUT2), located in the membrane of the hepatocytes and believed to be linked to the insulin receptor (Eisenberg et al., 2005). GLUT2 can transport bi-directionally glucose but also other sugars, like, galactose, mannose, fructose and glucosamine (Colville et al., 1993; Karim, Adams and Lalor, 2012; Leturque, Brot-Laroche and Gall, Le, 2009; Zhao and Keating, 2007). In
gluconeogenesis preceding to its release via GLUT2 (Karim, Adams and Lalor, 2012; Leturque, Brot-Laroche and Gall, Le, 2009). In the fed state, the rise of glucose and insulin levels inhibit hepatic glucose production, which leads to a decrease in GLUT2 mediated release and the internalization of the hepatocyte GLUT2 and the insulin receptor together into endosomes (Karim, Adams and Lalor, 2012; Leturque, Brot-Laroche and Gall, Le, 2009).
On the other hand, insulin also stimulates the mitogen-activated protein kinase (MAPK) signaling pathway through Grb2/Sos and ras, which is involved in gene expression, cell growth and differentiation (Cusi et al., 2000) (Figure 1.2). Also, MAPK is involved in the regulation of hepatic metabolism (Kyriakis and Avruch, 2001; Tang et al., 2014). In humans, the expression of p38δ MAPK has been shown to be increased in the liver of obese patients with NAFLD. So, MAPKs might drive hepatic metabolic dysfunction (Tang et al., 2014). Although this mechanism is not yet fully understood, p38-MAPK signaling, activated by oxidative stress, is thought to be associated with diminished insulin-dependent stimulation of insulin signaling and glucose transport activity (Lawan and Bennett, 2017).
1.1.1.1.1. Insulin Signaling Defects in Type 2 Diabetes and Insulin Resistance
T2D is characterized by a defect on insulin action, where the insulin-sensitive tissues progressively loss the response to insulin, causing insulin resistance (Ye, 2013). Even though, the actual insulin resistance mechanisms remain unknown, several factors are linked with its manifestation, such as: obesity, inflammation, hyperinsulinemia, lipotoxicity /hyperlipidemia, stress, aging, fatty liver and hypoxia (Ye, 2013). The majority of these factors are deeply connected with obesity and aging, these making them the major risk factors for insulin resistance (Ye, 2013).
Although the insulin resistance mechanisms remain unclear the most expectable cause of its origin would be a downregulation of insulin receptors due to a generalized hyperinsulinemia, resulting from the increased insulin secretion from the beta cells (Grundy, 2016). This insulin overproduction leads to an increase in plasma insulin levels in fasting conditions. Independently of which appears first, hyperinsulinemia
appears to perpetuate the insulin resistance (Shanik et al., 2008). Some studies demonstrated a connection between insulin resistance and the downregulation of insulin receptors (Molina et al., 1989), others had shown that insulin binding to its receptors was normal in obese and lean diabetic individuals (Caro et al., 1987; Kashiwagi et al., 1983). In light of these studies, another hypothesis for insulin resistance based on a possible defect on insulin signaling in T2D, through a reduction of the insulin-stimulated tyrosine kinase activity, thus impairing the phosphorylation of IRS and activation of PI3K has emerged (Cusi et al., 2000; Krook et al., 2000; Saltiel and Kahn, 2001).
1.1.1.2. Glucose Homeostasis
Glucose is the main source of fuel for energy metabolism. Glucose homeostasis is ensured by a balance between glucose absorption from the intestine, glucose production by the liver and glucose uptake and metabolism by the peripheral tissues (Saltiel and Kahn, 2001).
The plasma glucose levels, in healthy people, are within the range of 4 and 7 mM, despite periods of fasting or feeding. After an overnight fast (10-12h), the majority of total glucose disposal takes place in the brain, which consumes around 50% of all glucose available. Approximately, 25% of glucose uptake takes place in the liver and gastrointestinal tissues. The remaining 25% is used mainly by the muscle, and in a lesser extent by the adipose tissue (DeFronzo, 2004). Additionally, the majority of glucose endogenous production is hepatic, approximately 85%, by glycogenolysis and gluconeogenesis. The kidneys contribute with 15% overall production (Gerich et al., 2001; Magnusson et al., 1992).
After glucose ingestion (Figure 1.3), a peak in plasma glucose concentration stimulates insulin release by the pancreatic β-cells. The resultant hyperinsulinemia and hyperglycemia stimulate the uptake of glucose by the liver, skeletal muscle and adipose tissue (Arner, 2005; Röder et al., 2016). The influx of lipids into the adipose tissue leads to a decrease in lipolysis, with the inhibition of the TG hydrolysis into FA and glycerol (Arner, 2005). This inhibition leads to a decline in the plasma level of free fatty acids (FFA). Meanwhile, the uptake of glucose in the liver causes an inhibition of
Figure 1. 3. Insulin and glucagon effects on glucose homeostasis. After food ingestion, the
glucose levels increase, promoting the release of insulin from the pancreatic β-cells, which leads to the decrease in hepatic glucose production and the increase in muscle and adipose tissue glucose uptake. After an overnight fast, the blood glucose levels decrease, promoting the release of glucagon from the pancreatic α-cells, which leads to the hepatic glucose production, by increasing glycogenolysis and gluconeogenesis (adapted from Röder et al., 2016).
↓ Blood Glucose
!-cells ↑ Glycogenolysis
↑ Gluconeogenesis
Normal Blood Glucose Levels (4 - 6 mM) β-cells ↑ Blood Glucose ↑ Glycogenesis ↓ Gluconeogenesis ↑ Glucose Uptake Glucagon Insulin
hepatic glucose production (gluconeogenesis) together with the increase in glycogen production (Bergman, 2000; Boden and Shulman, 2002; DeFronzo, 2004; Defronzo et al., 1985; Saltiel and Kahn, 2001). The glycogen production increases the FA content in the liver, which has a limited volume to store these lipids and when it can no longer hold the FA these are released into the bloodstream as FFA, that are later stored in the adipose tissue for posterior usage (Röder et al., 2016).
Glucagon also plays an important role in the glucose homeostasis regulation (Figure 1.3). During fasting, approximately half of the total hepatic glucose output is dependent on the maintenance of normal basal glucagon levels (Cherrington, 1999). Whereas, after glucose ingestion, a-cell production of glucagon is inhibited contributing to the suppression of hepatic glucose production (DeFronzo, 2004).
Plasma glucose levels are maintained within the normal range (4-6 mM) by the action of two hormones released by the pancreas: insulin, released by the β-cells and glucagon, released by a-cell. The balance of these hormones plays a vital role in the regulation of the glucose homeostasis (Röder et al., 2016).
1.1.1.2.1. Glucose Homeostasis Defects in Type 2 Diabetes
In T2D, the insulin sensitive tissues, such as the muscle, liver and adipose tissue, are characterized by defects in insulin sensitivity. Consequently, in T2D patients, after glucose ingestion, an increase in hepatic glucose production occurs, even in the presence of high levels of plasma insulin, demonstrating an hepatic resistance to the insulin action (Firth et al., 1986). Studies have showed evidence that progression to glucose intolerance is associated with a prior development of insulin resistance (Figure 1.4.) (DeFronzo, Bonadonna and Ferrannini, 1992). The progression to glucose intolerance results from a defect in the β-cell, as the cells cannot maintain its previously rate of insulin secretion in response to high values of glucose (DeFronzo, 2004).
In the adipose tissue, insulin can no longer fully inhibit lipolysis, leading to an increase in FFA levels, resulting in skeletal muscle and liver’s insulin resistance and impaired insulin secretion (Bajaj and DeFronzo, 2003; Boden and Chen, 1995; Kashyap et al., 2003). Hence, the increase in FFA ultimately leads to an increase in hepatic glucose production and impaired skeletal muscle’s glucose uptake (Boden et al., 2001; Roden et al., 1996).
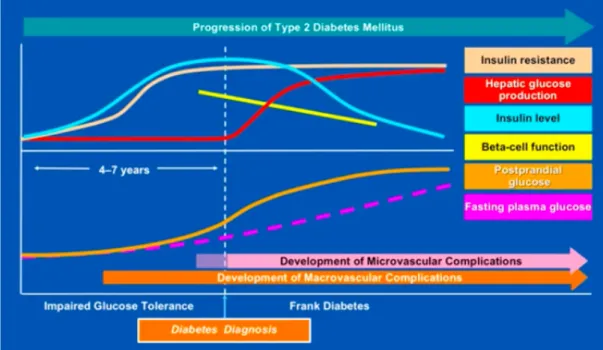
Figure 1. 4. Natural history of type 2 diabetes. The prediabetic state of impaired glucose
tolerance is characterized by increasing insulin resistance, compensatory hyperinsulinemia, and mild postprandial hyperglycemia. Here, the fasting blood glucose levels are maintained in near normal ranges. Also, macro and microvascular complications start to arise. The β-cell then begins to fail, resulting in higher postprandial glucose levels and, with further loss of insulin secretory capacity and impaired glucorecognition, fasting blood glucose levels and hepatic glucose production increase (Ramlo-Halsted and Edelman, 1999).
1.1.2. Non-Alcoholic Fatty Liver Disease
NAFLD is seen as the hepatic manifestation of the metabolic diseases, recognizing insulin resistance as a key factor in the genesis of the disease (Vanni et al., 2010). In contrast to the MS, the definition of NAFLD includes only one component: liver fat content > 5–10% per liver weight in the absence of excess alcohol consumption or any other liver disease (Vanni et al., 2010). Despite of having only one component, the pathogenesis of NAFLD can be influenced by several factors, such as, increases in dietary fat supply or even genetic factors (Vanni et al., 2010).
NAFLD compromises a broad disease spectrum from simple steatosis (non-alcoholic fatty liver, NAFL) to non-alcoholic steatohepatitis (NASH) and cirrhosis (Kotronen et
Figure 1.5. Schematic progression of non-alcoholic fatty liver disease (NAFLD) and estimated prevalence of the disease stages (adapted from Alwahsh et al., 2016).
Hepatocellular Cancer Cirrhosis NASH NAFLD Healthy Liver
al., 2007; Neuschwander-Tetri and Caldwell, 2003) (Figure 1.5). The early stage of the disease is characterized by a benign and reversible state of simple steatosis (fat accumulation). Whereas, NASH is defined by an irreversible hepatocyte injury, presence of inflammation and/or fibrosis which can progress into cirrhosis, liver failure and hepatocellular carcinoma (Vanni et al., 2010).
Approximately 10–25% of all patients with NAFLD develop NASH, although the evolution of steatosis to steatohepatitis remain unclarified (Day, 2005; Harrison, Torgerson and Hayashi, 2003). The “two-hits” model proposed by Day and James provide a pathophysiological foundation to the progression of liver damage, suggesting that the reversible deposition of TG (“first hit”) leads to metabolic and molecular alterations that sensitize the liver to the “second hit”, usually referred to as oxidative stress and cytokine-induced liver injury (Day and James, 1998). The liver is overwhelmed by the “second hit”, leading to the irreversible hepatocyte injury seen in NASH, like lipid peroxidation, induction of inflammatory cells and fibrogenesis with extracellular matrix deposition (Vanni et al., 2010).
NAFLD is a pathology that involves other organs besides the liver (Figure 1.6). For example, the muscle contributes to the pathology as when it becomes insulin resistant, glucose uptake in the muscle decreases and therefore the levels of circulating glucose are unable to decrease (Vanni et al., 2010; Yki-Järvinen, 1993). Whereas, the adipose tissue contributes with an increase in the FFA. The lipolysis is not adequately suppressed by insulin, which leads to an increased FFA content, the main source of
hepatic TG in NAFLD (Vanni et al., 2010; Yki-Järvinen, 1993). These factors together with liver´s overproduction of glucose, despite fasting hyperinsulinemia, contributes to the increase of fat deposition in the liver (Vanni et al., 2010; Yki-Järvinen, 1993). The progressive increase in hepatic fat (hepatosteatosis) that leads to NAFLD, contributes for the impaired ability of insulin to inhibit gluconeogenesis (Bugianesi et al., 2005; Seppälä-Lindroos et al., 2002). In fact, the hepatic insulin resistance increases the plasma glucose concentrations, stimulating insulin secretion and driving the vicious cycle of hyperinsulinemia and hyperglycemia (Juurinen et al., 2007; Vanni et al., 2010).
The liver is the major organ for lipid distribution. The hepatic ability to store fat is limited and the lipid excess can be oxidized, but it is mainly released as very low-density lipoprotein (VLDL) (Kotronen et al., 2008; Taskinen, 2005; Vanni et al., 2010). So, after a meal, lipids are transported from the gut into the bloodstream in the form of chylomicrons (CM) and stored in the liver (Figure 1.6), where they are processed and assembled with apoB to form VLDL (Adiels et al., 2006, 2007; Fabbrini et al., 2008). One of insulin actions is to restrain VLDL production. However, in cases of hepatic insulin resistance, insulin is not able to inhibit VLDL production, leading to the overproduction of triglyceride-rich VLDL by the liver in the fasting state and during hyperinsulinemia (Adiels et al., 2006, 2007; Fabbrini et al., 2008; Lewis et al., 1993). Consequently, hepatic insulin resistance could lead to hypertriglyceridemia (Kotronen et al., 2008; Taskinen, 2005; Vanni et al., 2010).
Studies suggest that hepatic fat accumulation is involved in the pathogenesis of T2D and that hyperinsulinemia might be a consequence of NAFLD (Juurinen et al., 2007; Kotronen et al., 2008). Although, many studies search to better understand the key pathological feature of NAFLD, still no current therapies exist for NAFLD or NASH (Vanni et al., 2010).
1.1.3. Dyslipidemia
Dyslipidemia is strongly associated with metabolic diseases, like MS, T2D, obesity and NAFLD (Katsiki, Mikhailidis and Mantzoros, 2016; Klop, Elte and Cabezas, 2013; Mooradian, 2009). A core characteristic of dyslipidemia is insulin resistance, which influences the increase in FFA and the deregulation of the liver and adipose tissue lipid metabolism (Katsiki, Mikhailidis and Mantzoros, 2016). The erratic lipolysis in the adipose tissue leads to the release of FFA that are converted to TG in the liver, resulting in hypertriglyceridemia. This shows how metabolic diseases are connected to each other, through the disturbance of lipids metabolism in the body (Blaton, Korita and Bulo, 2008).
Figure 1. 6. Pathogenesis of Non-Alcoholic Fatty Liver Disease (NAFLD). Different sources of
fatty acids contribute to the development of fatty liver. Under conditions of insulin resistance, insulin does not adequately inhibit hormone-sensitive lipase (HSL), and lipolysis in white adipose tissue is not suppressed. Therefore, peripheral fats stored in adipose tissue flow to the liver by way of plasma free fatty acids (FFAs). Dietary fatty acids are also taken up by the liver through the uptake of intestinally derived chylomicron (CM). In addition, the combination of elevated plasma glucose (hyperglycemia) and insulin concentrations (hyperinsulinemia) promotes de novo fatty acid synthesis (lipogenesis) and impairs β-oxidation, thereby contributing to the development of hepatic steatosis. After the esterification step (conversion of fatty acids into triglycerides (TG)) TG can then be stored as lipid droplets within hepatocytes or secreted into the blood as very low-density lipoproteins (VLDL) (Postic et al., 2008).
Figure 1. 7. Role of insulin resistance in T2D dyslipidemia. Insulin resistant cells release
FFA leading to an increased flux into the liver which promotes TG production and secretion of apolipoprotein B (ApoB) and VLDL. Cholesteryl ester transfer protein (CETP) promotes the exchange from VLDL-transported triglyceride to high-density lipoprotein (HDL)-transported
In insulin resistant patients, the increased supply of glucose (Figure 1.7.) results in an increase in FFA released from insulin-resistant adipocytes into bloodstream that are stored in the liver (Frayn, 2001; Mooradian, 2009; Taskinen, 2003). This efflux of FA into the liver elevates TG production leading to the increase of apoB and VLDL (Frayn, 2001; Mooradian, 2009; Taskinen, 2003). The overproduction of VLDL drives the reciprocal exchange of FA: cholesterol-esters (CE) are transferred to VLDL and chylomicron remnants particles and TG are transferred to LDL particles, to form small-dense LDL (SD LDL), and to HDL particles. These small-dense particles are well known for their high atherogenic potential (Blaton, Korita and Bulo, 2008; Frayn, 2001; Mooradian, 2009; Taskinen, 2003). The increased number of VLDL particles and TG drive the increase of SD LDL particles, that can promote a slight increase of LDL particles and a decrease HDL levels (Chatrath, Vuppalanchi and Chalasani, 2012; Klop, Elte and Cabezas, 2013; Mooradian et al., 2008; Mooradian, Haas and Wong, 2004; Wang and Peng, 2011).
In MS, similarly to obesity, cardiovascular disease (CVD), NAFLD and T2D, dyslipidemia is very commonly diagnosed, thus making it of vital importance in the vicious cycle of metabolic diseases (Chatrath, Vuppalanchi and Chalasani, 2012; Katsiki, Mikhailidis and Mantzoros, 2016; Manjunath et al., 2013).
1.3. Sympathetic Nervous System and Metabolic Dysfunction
The sympathetic nervous system (SNS) is an important component of the autonomic nervous system. Sympathetic outflow is driven by a network of neurons located in the rostral ventrolateral medulla. These neurons provide excitatory output to preganglionic neurons that innervate several target organs through postganglionic sympathetic fibers (Thorp and Schlaich, 2015).
The SNS plays a major role in the maintenance of the organism’s homeostasis, being influenced by several environmental and genetic factors (Conde et al., 2014; Tentolouris, Liatis and Katsilambros, 2006). SNS is responsible for controlling metabolic processes through regulation of the resting metabolic rate and thermogenesis, which leads to variations of energy states, carbohydrate consumption, and hyperinsulinemia levels (Thorp and Schlaich, 2015). The activation of sympathetic nerves innervation in the liver, pancreas, skeletal muscle and adipose tissue can also produce acute catabolic responses, like glycogenolysis and lipolysis (Thorp and Schlaich, 2015).
Due to the role of SNS activity in energy balance as well as several metabolic processes, a sympathetic overactivity might be associated to a variety of metabolic disorders, such as insulin resistance, T2D, hypertension, dyslipidemia, NAFLD and obesity (Conde et al., 2014; Esler et al., 2006; Grassi et al., 2005, 2007; Huggett et al., 2003; Kahn and Flier, 2000; Kobayashi et al., 2010; Mancia et al., 2007; Tentolouris, Liatis and Katsilambros, 2006). Moreover, there is substantial evidence supporting that the SNS is exceedingly active in individuals with the MS and its key metabolic alterations, central obesity and insulin resistance (Thorp and Schlaich, 2015).
In fact, the SNS has been described as one of the links between the presence of metabolic diseases and the development and progression of insulin resistance, as several components of the MS are associated with an increase in sympathetic activity and deeply connected to a decrease in insulin sensitivity (Bin-Jaliah, Maskell and Kumar, 2004; DeFronzo and Tripathy, 2009; Gallego-Martin et al., 2012; Mancia et al., 2007; Manjunath et al., 2013; Sacramento et al., 2018; Tsioufis et al., 2007). It has been shown that the SNS can reduce insulin sensitivity by changing hemodynamic parameters, like vasoconstriction, making it more difficult for insulin to reach its target.
Moreover, the SNS can directly and indirectly favor the appearance and progression of organ damage, which is part of the clinical onset of the MS (Mancia et al., 2007). In metabolic diseases the increase in sympathetic activation can come from one of two ways, directly by the sympathetic nerve endings or indirectly by the circulating catecholamines (CA) (epinephrine and norepinephrine) (Conde et al., 2014; Tentolouris et al. 2006). CA modulate metabolism to increase blood glucose levels by stimulating glycogenolysis in the liver, increased glucagon secretion and decreased insulin secretion from the pancreas, and increased lipolysis in adipose tissue. (Conde et al., 2014; Tentolouris, Liatis and Katsilambros, 2006) Therefore, by a direct or indirect action, the SNS is associated with hyperinsulinemia, hyperleptinemia, increased FFA, inflammation, fatty liver and obesity, yet the mechanisms behind it remains to be clearly understood (Conde et al., 2014; Lambert et al., 2010). Blunted sympathetic responsiveness to glucose and elevated arterial noradrenaline levels are evidence for sympathetic overactivity, suggesting profound disturbances in central sympathetic nerve activity in metabolic diseases (Thorp and Schlaich, 2015).
Several pathophysiological mechanisms link SNS overactivity with the MS and its core components like central obesity and insulin resistance. The ongoing discussion as to whether sympathetic overactivity is a consequence or a cause of metabolic dysfunctions (Lambert et al., 2010; Thorp and Schlaich, 2015). As, evidence suggest that SNS overactivity is important both in the initiation and the maintenance of metabolic abnormalities seen in the MS (Thorp and Schlaich, 2015).
1.4. Carotid Body
The carotid bodies (CBs) are small paired organs, located bilaterally at the bifurcation of the common carotid artery (Atanasova, Iliev and Lazarov, 2011; Gonzalez et al., 1994) (Figure 1.7.). They measure approximately 2 mm in humans and less than 1 mm in rats (Atanasova, Iliev and Lazarov, 2011). The CBs are capable of sensing and responding to changes in arterial blood gases such as hypoxia (low O2
levels), hypercapnia (high CO2 levels), and acidosis (low blood pH) (Gonzalez et al.,
1994). To be able to sense these changes, the CBs are the most perfused organ per gram weight in the body (2000 mL/min per 100 mg of tissue) and receive blood via an arterial
Figure 1. 8. Carotid body (CB) location and innervation (A), with the celular arragenment (B). (adapted from Gríofa et al., 2014).
branch arising from internal or external carotid artery (Gonzalez et al., 1994; Paton et al., 2013). Also, in order to respond to these changes , the CBs are innervated by the nerve fibers from the glossopharyngeal (carotid sinus nerve, CSN), vagal, and the sympathetic nerve of the nearby superior cervical ganglion (González et al., 1995; Kumar and Prabhakar, 2007; Paton et al., 2013).
The CB is organized into clusters of cells, glomeruli, which are in close proximity with a vast network of capillaries and connective tissue. The glomerulus are constituted mainly by two types of cells: the chemoreceptor cells, also known as glomus or type I cells, which are derived of the neural crest and are synaptically connected with the CB’ sensitive nerve, the CSN (Gonzalez et al., 1994) and, the type II cells or sustentacular cells. Type II cells formerly believed that they only had a supportive role, but recently has been proposed that they are adult neural stem cells that in response to a stimuli, like hypoxia, can proliferate and differentiate into new type I cells (Conde et al., 2014; Iturriaga and Alcayaga, 2004; Pardal et al., 2007; Piskuric and Nurse, 2013).
The stimulation of the CBs leads to the release of neurotransmitters (as CA, adenosine, adenosine triphosphate (ATP), serotonin, acetylcholine, neuropeptides) that lead to an increase in the action potential frequency of the CSN (Conde et al., 2014). The CSN activity is integrated in the brainstem to induce a panoply of respiratory reflexes in order to normalize blood gases via hyperventilation and to regulate blood pressure (BP) and cardiac performance via activation of the sympathetic nervous system (Gonzalez et al., 1994; Marshall, 1994).
1.4.1. Carotid Body, Metabolic Diseases and the Sympathetic Nervous System
It is consensual that metabolic diseases are associated with sympathetic overactivation (Esler et al., 2006; Lambert et al., 2010; Paton et al., 2013; Ribeiro et al., 2013; Tentolouris, Liatis and Katsilambros, 2006) . Also, an overactivation of the SNS is related with insulin resistance, but the link between these defects it is not yet fully understood (Egan, 2003; Iturriaga et al., 2016; Tentolouris, Liatis and Katsilambros, 2006; Tsioufis et al., 2007, 2011). Prof. Conde group has established that the CB is the link between sympathetic nerve activity and insulin resistance (Ribeiro et al., 2013, Sacramento et al. 2017), as they showed that resection of CSN prevented and normalized the overactivation of the SNS induced by hypercaloric diets, measured as plasma and adrenal medulla catecholamines and by the measurement of heart rate variability (Sacramento et al., 2017).
In the last years, a rift of opinions has emerged regarding the effect of hypoglycemia (low blood glucose) on the CB. While some authors suggested that hypoglycemia is capable of activating the CB (Pardal and López-Barneo, 2002; Zhang, Buttigieg and Nurse, 2007), others suggested that hypoglycemia per se is not able to activate the CB, as it is incapable of altering CSN frequency of discharges in vivo and ex vivo (Bin-Jaliah, Maskell and Kumar, 2004; Conde et al., 2014; Gallego-Martin et al., 2012). Additionally, it was also observed that hyperglycemia (25mM of glucose) did not changed either the basal CSN activity or the CSN chemosensory activity in response to hypoxia (0% O2), suggesting that hyperglycemia does not activate the CB nor
potentiates the response to hypoxia (Conde, Sacramento and Guarino, 2018).
Recently, it was demonstrated that insulin stimulates the peripheral chemoreceptors located in the CB, suggesting that probably hyperinsulinemia might be a key factor initiating CB overactivation, leading to the increased SNS activity (Ribeiro et al., 2013). Insulin is capable of stimulating the CB and inducing a neurosecretory response by binding to the insulin receptor present in the chemoreceptor cells of the CB (Ribeiro et al., 2013). Insulin induces an increase in intracellular Ca2+ in the chemoreceptor cells,
stimulating the release of ATP and dopamine from the CB (Ribeiro et al., 2013). Also, insulin produces a dose-dependent increase in ventilation, an effect that is abolished by
CSN cut (Conde et al., 2014; Guarino et al., 2013). Therefore, these results are in agreement with the hypothesis that insulin is a stimulus for CB activation, independently of glucose levels. Shifting the paradigm of CB activation from “low glucose” to “high insulin”.
Moreover, an overactivation of the CB can be perceived as a dysfunction of the organ, since, evidence suggests that CB are overactive in metabolic diseases like T2D, hypertension and obesity (Conde, Sacramento and Guarino, 2018; Sacramento et al., 2017). The CB activity lead to an increase in the action potential frequency of the CSN, so an overactivation of these organ leads to overstimulation of the CSN (Conde et al., 2014; Conde, Sacramento and Guarino, 2018). The CB sympatho-stimulation though the CSN, leads to an activation of the SNS (Sacramento et al., 2017). The CB overactivation has been demonstrated to be connected with the development of insulin resistance and glucose intolerance (Conde, Sacramento and Guarino, 2018; Ribeiro et al., 2013; Sacramento et al., 2018). Conde’s lab demonstrated, that by abolishing CB activity, with the denervation or the bioelectronic modulation of the CSN was possible to prevent and reverse insulin resistance (Figure 1.9.), as well as glucose intolerance (Table 1.3) in young animals with prediabetes and in an early stage of T2D (Ribeiro et al., 2013; Sacramento et al., 2017, 2018).
B A
Figure 1. 9. Effect of the carotid sinus nerve (CSN) resection on the insulin sensitivity. Effect
of CSN resection on insulin sensitivity assessed by an insulin tolerance test (ITT) and expressed
as the constant rate for glucose disappearance (KITT) in young controls (CTL) (A) and HFHSu (B)
animals. CSN resection was performed at 14 weeks of diet and animals were maintained under their respective diets until the 25 weeks. Black line, control sham; Black dotted line, control with CSN resection; Grey line, HFHSu sham; Grey dotted line, HFHSu with CSN resection. Data are means ± SEM of 8-10 animals. One and Two-Way ANOVA with Dunnet’s and Bonferroni
Table 1.3. Area under the curve (AUC) obtained from the analysis of the glucose excursion curves in young control (CTL) and high-fat high-sucrose (HFHSu) animals with or without carotid sinus nerve (CSN) resection (Sacramento et al., 2018).
Conde’s lab not only showed that the modulation of the CSN prevents and reverses insulin resistance and glucose intolerance, but also that improves plasma fasting glucose (Table 1.4.) and decreases perinephric fat accumulation (Table 1.5.) (Sacramento et al., 2018).
Table 1.4. Effect of carotid sinus nerve resection (CSN) on plasma fasting glucose (mg/dl) in control (CTL) and HFHSu young animals (Sacramento et al., 2018).
Data are means ± SEM of 8-10 animals. One and Two-Way ANOVA with Dunnet’s and Bonferroni multicomparison test: **p<0.01, vs control; †p<0.05, with vs without CSN resection.
Data are means ± SEM of 8-10 animals. One and Two-Way ANOVA with Dunnet’s and Bonferroni multicomparison test, ***p<0.001 vs control; †p<0.05 vs without CSN resection; ǂp<0.05 vs without CSN resection at 25 weeks of diet.
Table 1.5. Effect of carotid sinus nerve (CSN) resection on total, perinephric, perienteric and epididymal fat in control and HFHSu young animals (Sacramento et al., 2018).
These results demonstrated that the overactivation of the CB is in the genesis of insulin resistance and of the decreased of peripheral insulin action seen in metabolic disorders, like T2D, prediabetes and MS (Ribeiro et al., 2013; Sacramento et al., 2017). Also, these results highlight that the link between the CB and the SNS must be further investigated to better understand its role on the control of glucose metabolism, insulin resistance and metabolic disturbances. They also highlight that the modulation of the CB activity might arise as a new therapeutic approach for the treatment of sympathetically mediated diseases.
1.5. Aging
Aging is described as a series of morphological and functional changes over time (Bonomini, Rodella and Rezzani, 2015; Guarner and Rubio-Ruiz, 2011). It is seen as a biological process characterized by a progressive deterioration in physiological functions, with a decline in maintenance of homeostasis, accompanied by an array of metabolic changes, including insulin resistance, changes in body composition and modulation of mitochondrial function (Barzilai et al., 2012; Bonomini, Rodella and Rezzani, 2015; Finkel, 2015). These changes contribute to an increased predisposition to age-related conditions, like T2D, hypertension, and CVD (Bonomini, Rodella and Rezzani, 2015; Finkel, 2015; Riera and Dillin, 2015). Also, several disorders whose prevalence increase with aging, such as obesity, insulin resistance, inflammation,
Data are means ± SEM of 8/10 animals. One and Two-Way ANOVA with Dunnet’s and Bonferroni multicomparison test, **p<0.01, ***p<0.001 vs control; †p<0.05 vs without CSN resection.