Universidade de Lisboa
Faculdade de Farmácia
Instituto de Biologia Experimental e Tecnológica
(IBET)
Preparation and evaluation of an insulin delivery system
sensitive to hyperglycaemia
Rita Leones Alves Reis da Silva
Dissertação de Mestrado
MESTRADO EM CIÊNCIAS BIOFARMACÊUTICAS
Universidade de Lisboa
Faculdade de Farmácia
Instituto de Biologia Experimental e Tecnológica
(IBET)
Preparation and evaluation of an insulin delivery system
sensitive to hyperglycaemia
Rita Leones Alves Reis da Silva
Dissertação de Mestrado orientada pelo Doutor Hélder João Ferreira Vila Real e pelo
Prof. Doutor João Pedro Fidalgo Rocha
MESTRADO EM CIÊNCIAS BIOFARMACÊUTICAS
Agradecimentos
À Professora Doutora Ana Simplicio, investigadora principal do grupo Pharmacokinetics and Biopharmaceutical Analysis e directora da Unidade de Serviços Analiticos do iBET, um enorme obrigada pela oportunidade de desenvolver esta tese, disponibilidade e enorme simpatia. Ao Doutor Hélder Vila Real um sincero obrigada! Obrigada pela dedicação, ajuda e entusiasmo. Por todo o conhecimento que me passaste e pela incansável ajuda, que me fez crescer e me tornou uma pessoa mais crítica e mais autonoma. Nunca pensei aprender tanto em tão pouco tempo. Espero, sinceremente, que o futuro te traga tudo o que desejas.
Ao Professor Doutor João Rocha, obrigada pela co-orientação desta tese e por todo o tempo despendido.
Ao Doutor Auturo Álvarez-Bautista, obrigada pela ajuda com a formulação das nanoparticulas e introdução em técnicas completamente, humor espanhol e apoio!
À Unidade de Serviços Analíticos do iBET, um especial agradecimento pelo incansável apoio e simpatia que me fez sentir “em casa”.
À minha família, Mãe, Pai, Irmã, Tios, Avós, Primos, muito obrigada! Pela oportunidade, pelo apoio quando decisões dificeis tiveram de ser tomadas e incansável dedicação. Sem vocês nada disto faria sentido.
Às minha amigas cientistas, Carla, Dora, Maria, Shikha, não sei como vos agradecer! Obrigada pela força que me deram no ínicio e depois, sem vocês não estaria aqui, assim. Que o futuro se revele brilhante para todas, sempre com muita festa!
Às minha meninas! Obrigada pelos anos que já passaram e que virão. À Ana que, mesmo longe, não deixa de fazer parte do meu dia-à-dia e à Carolina, pelas horas de conversa e descontração. Aos meus amigos de Coimbra, são a família que lá deixei e a distância não muda isso. Cristina, obrigada por tudo continuar na mesma, mesmo estando tudo tão diferente.
Preparation and evaluation of an insulin delivery system sensitive to hyperglycaemia i
Table of Contents
Abstract ... vii Resumo ... ix Abbreviations ... xi 1. Introduction ... 1 1. Diabetes ... 1 1.1. Diabetes physiopathology ... 11.2. Insulin´s physiological action ... 2
1.3. Insulinotherapy ... 5
2. Nanoparticles delivery systems ... 9
2.1. Nanoparticles delivery systems – general aspects ... 9
2.2. Poly(lactic-co-glycolic acid) (PLGA)-based nanoparticles ... 12
2.2.1. General aspects ... 12 2.2.2. Formulation Methods ... 14 2.2.3. Protein encapsulation... 15 3. Enzyme kinetics ... 17 3.1. General aspects ... 17 3.2. Activity assays ... 19 3.3. Catalase ... 19 3.4. Glucose Oxidase ... 21 3.5. Glucose-sensitive systems ... 23 4. Objectives ... 24 2. Materials ... 25 3. Methods ... 27
1. PLGA nanoparticles formulation ... 27
1.1. Loaded PLGA nanoparticles ... 27
1.1.1. Catalase-loaded PLGA nanoparticles ... 27
1.1.2. Insulin and Catalase loaded PLGA nanoparticles ... 28
1.2. PLGA nanoparticles functionalization ... 28
1.3. PLGA-nanoparticles drying ... 29
1.3.1. Vacuum concentrator centrifuge (Speedvac) ... 29
1.3.2. Lyophilisation ... 29
2. PLGA nanoparticles physical characterization... 29
ii
3.1. Encapsulation Efficiency and Loading ... 30
3.2. Catalase activity ... 31
3.2.1. Continuous Method ... 31
3.2.2. Non-continuous Method... 31
3.3. Study of catalase in vitro release ... 32
4. Glucose Oxidase Study ... 33
4.1. Functionalization yield ... 33
4.2. GOx activity ... 33
5. Insulin study ... 35
5.1. Encapsulation Efficiency and Loading ... 35
5.2. Insulin in vitro release ... 35
6. HPLC ... 36
4. Results and Discussion... 37
1. Formulation of PLGA-nanoparticles ... 37
2. Catalase encapsulation and activity study ... 38
2.1. Optimization of catalase activity assay ... 38
2.2. Catalase solubilisation test ... 40
2.3. Catalase immobilization ... 42
2.3.1. Process optimization ... 42
2.3.2. Physical characterization of the nanoparticles produced ... 43
2.3.3. Encapsulation efficiency ... 46
2.3.4. Activity and stability ... 46
3. PLGA functionalization with GOx ... 51
4. Insulin encapsulation ... 54
5. Concluding Remarks and Future Perspectives ... 62
Preparation and evaluation of an insulin delivery system sensitive to hyperglycaemia
iii
Figure index
1. Introduction
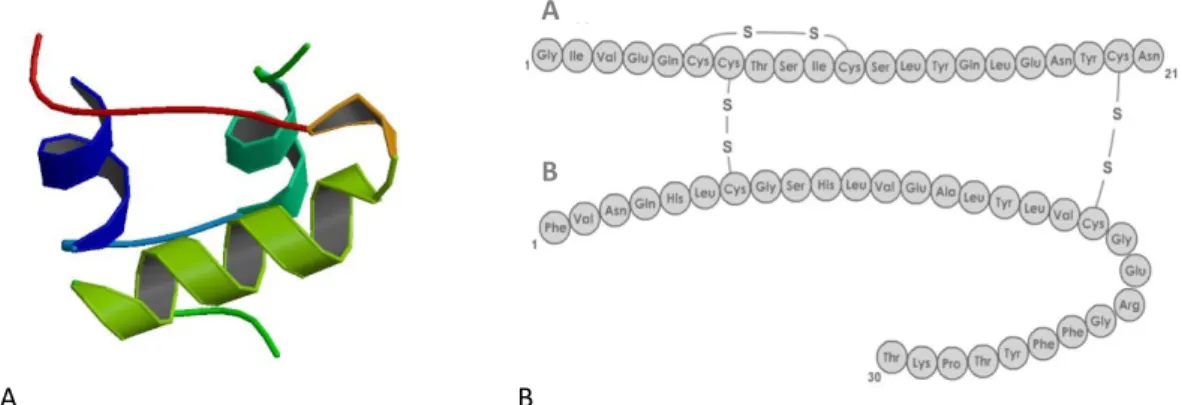
Figure 1.1(A) Crystal structure (PBD ID: 3I40; (Timofeev et al., 2010)) and (B) amino acid sequence of
Human insulin (adapted from (PharmaWiki, 2015)) ... 3
Figure 1.2 Schematic representation of insulin action ... 3
Figure 1.3 Schematic representation of the principal milestones of insulin therapy ... 6
Figure 1.4 Michaelis-Menten kinetics. (Stryer et al., 2008) ... 18
Figure 1.5 Crystal structure of human catalase PDB ID: 1DGF, (Putnam et al., 2000) ... 20
Figure 1.6 Crystal structure of glucose oxidase from Aspergillus Niger, PBD ID:1GAL (Hecht et al., 1993) .. 22
Figure 1.7 Schematic representation of the PLGA-based nanoparticle proposed ... 24
3. Methods Figure 3.1 Catalase standard curve measured at 595 nm ... 30
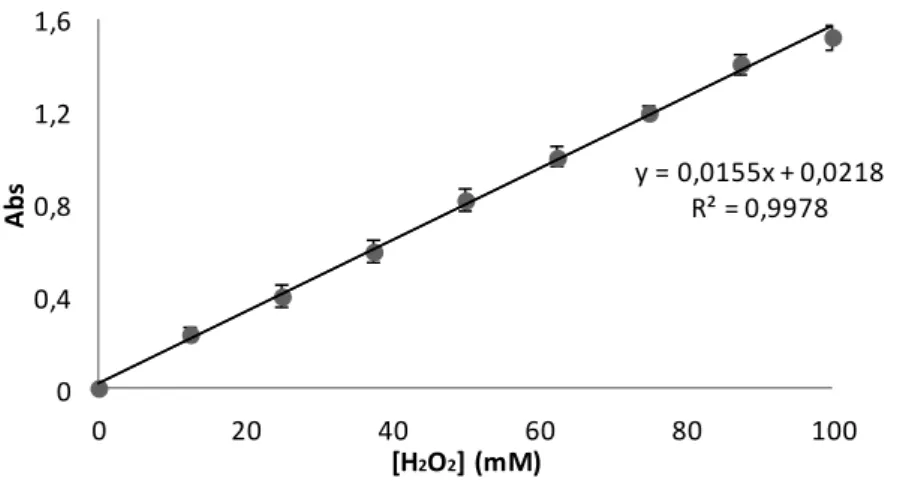
Figure 3.2 H2O2 standard curve used to quantify H2O2 consumption by catalase using the continuous method, measured at 240 nm. ... 31
Figure 3.3 H2O2 standard curve used to quantify H2O2 consumption by catalase using the indirect method measured at 240 nm ... 32
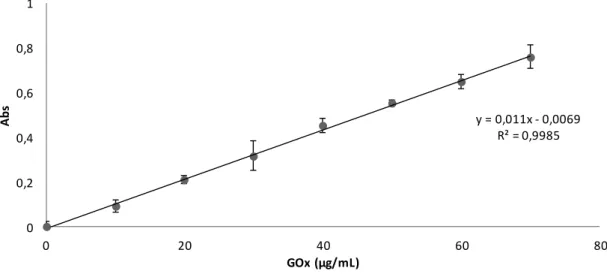
Figure 3.4 GOx standard curve ... 33
Figure 3.5 H2O2 standard curve used to quantify H2O2 production measured at 520 nm ... 34
Figure 3.6 Insulin standard curve ... 35
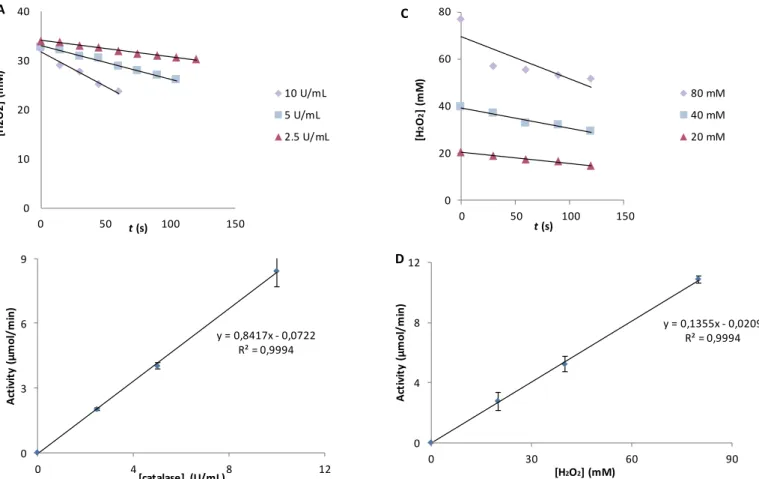
4. Results and Discussion Figure 4.1 Extension of H2O2 decomposition by catalase (1 and 10 U/mL) with 40 mM H2O2, at 25°C and pH=7.0. ... 39
Figure 4.2(A) Catalase progression curves with different enzyme concentrations (2.5; 5.0 and 10 U/mL) at 40 mM H2O2, 25°C and pH = 7.0. (B) Catalase activity dependence with enzyme concentration (2.5; 5.0 and 10 U/mL). (C) Catalase progression curves with different substrate concentrations (20, 40 and 80 mM H2O2) at 5.0 U/mL of catalase , 25°C and pH = 7.0. (D) Catalase activity dependence with substrate concentration (20, 40 and 80 mM). ... 40
Figure 4.3 Catalase progression curves with different catalase solutions (HCl, water and phosphate buffer) homogenized in the ultrasounds (A) and different homogenization methods with catalase dissolved in 500 mM phosphate buffer (pH 7.0) (B). ... 41
iv
Figure 4.4 SEM microphotographs of PLGA-catalase formulations: formulation A (A) and formulation D (B) (scale bar = 100 nm). ... 46 Figure 4.5 Activity of encapsulated catalase (formulation A, B, C and D) at day 0 and after 15 days using a non-continuous catalase activity assay (measured at 240 nm) ... 47 Figure 4.6 Stability study of free and encapsulated catalase within PLGA-catalase nanoparticles for formulations: A, B, C and D. ... 48 Figure 4.7 Catalase release from PLGA-catalase nanoparticles (A, B, C and D) in 10 mM phosphate buffer, pH=7.4, at 37° C. Catalase quantification through Bradford assay (595 nm). ... 49 Figure 4.8 Catalase release from PLGA-catalase nanoparticles (A, B, C and D) in H2O2 solution (800 mM), at
37° C. Catalase quantification through Bradford assay (595 nm)... 50 Figure 4.9 GOx progression kinetics of GOx at 1, 2 and 4 mU/mL with 30 mM of glucose, at 25°C and pH=7.0. ... 51 Figure 4.10 (A) GOx progression curves with different enzyme concentrations (1.0; 2.0 and 4.0 mU/mL) at 30 mM glucose, 25°C and pH = 7.0. (B) GOx activity dependence with enzyme concentration (1.0; 2.0 and 4.0 mU/mL) at 30 mM of glucose. (C) GOx progression curves with different substrate concentration (3.0, 7.5, 15, 22.5 and 30 mM glucose) at 4.0 mU/mL of GOx, 25°C and pH = 7.0. (D) GOx activity dependence with substrate concentration (3.0, 7.5, 15, 22.5 and 30 mM glucose) at 4.0 mU/mL. ... 52 Figure 4.11 Stability study of GOx on PLGA nanoparticles. ... 53 Figure 4.12 Chromatograms observed for the release of insulin (rt = 9.7 min) from PLGA nanoparticles with 10 mM phosphate buffer at 37°C and pH=7.4. ... 55 Figure 4.13 Insulin release from PLGA-catalase-insulin nanoparticles from formulation AI (A) and
formulation DI (B) at 37°C and pH=7.4 ... 56
Figure 4.14 Insulin release from PLGA-catalase-insulin nanoparticles at 37°C and pH 7.4 from formulation G (A); formulation H (B) ... 58 Figure 4.15 Insulin release from PLGA-catalase-insulin nanoparticles at 37°C and pH 7.4 from formulation I ... 59 Figure 4.16 SEM microphotographs of PLGA-catalase formulations at 100 nm (A) Formulation H (B) Formulation I ... 60 Figure 4.17 Comparison between the size of catalase (A) and insulin (B). Adapted from (Goodsell et al., 2015), 10.2210/rcsb_pdb/mom_2014_9 (A) and 10.2210/rcsb_pdb/mom_2001_2. ... 61
Preparation and evaluation of an insulin delivery system sensitive to hyperglycaemia
v
Index of tables
1. Introduction
Table 1-1 Available insulin formulation ... 8 Table 1-2 Examples of insulin delivery systems ... 11
3. Methods
Table 3-1. Specific conditions for the production of formulations: A – D ... 28
4. Results and Discussion
Table 4-1 Physical-chemical characterization of different PLGA-catalase nanoparticles ... 44 Table 4-2 Physical-chemical characterization of PLGA-GOx nanoparticles ... 52 Table 4-3 Physical and chemical characterization of different PLGA-catalase-insulin nanoparticles
0 20 40 60 80 100 0 4 8 24 % c at al as e r e le as e d t (h) A B C D
Catalase release from PLGA-catalase nanoparticles (A, B, C and D) in 10 mM phosphate buffer, pH=7.4, at 37° C.
Preparation and evaluation of an insulin delivery system sensitive to hyperglycaemia
vii
Abstract
Diabetes mellitus (DM) represents a world health problem with a current estimated prevalence of 415 million people, characterized by an increased glucose blood concentration. DM type 1 therapy is based on the subcutaneous administration of insulin in accordance to glucose levels, which is associated with patient´s poor compliance. Following this, the aim of this project is to produce an insulin delivery system sensitive to hyperglycaemia, avoiding the need of glycaemia monitoring while promoting a better glucose homeostasis control.
In this work, a glucose sensitive insulin delivery system started to be developed based on poly(lactic-co-glycolic acid) (PLGA) nanoparticles containing insulin and catalase and decorated with glucose oxidase (GOx). The principle for insulin release is based on the conversion of glucose into H2O2 whenever glycaemia levels are high;
afterwards the breakdown of H2O2 into H2O and O2 by catalase leads to an increased
pressure inside the nanoparticles, causing them to break and to release insulin.
An initial catalase encapsulation study was conducted. Immobilized catalase was not only active but it also showed increased stability in comparison with free catalase. A release profile could be observed in response to the presence of H2O2. Furthermore,
GOx immobilization on PLGA surface was also accomplished and a significant enzymatic activity and stability were achieved. Afterwards, insulin and catalase were co-encapsulated within PLGA nanoparticles and the insulin release pattern was evaluated. However, and in contrast with initial results observed for encapsulated catalase, insulin release was not triggered by the presence of H2O2. The optimized immobilization
conditions for catalase are not suitable for insulin delivery probably due to the PLGA surface porosity and insulin smaller size in comparison with catalase.
Future work may include the encapsulation of insulin linked to polyethylene glycol (PEG), in order to obtain a larger molecule and by this way avoiding its release through PLGA pores and improving the release of insulin.
Preparation and evaluation of an insulin delivery system sensitive to hyperglycaemia
ix
Resumo
A Diabetes mellitus (DM) é uma doença que atinge cerca de 415 milhões de pessoas, caracterizada por um aumento da concentração de glucose sanguínea. A terapia da DM tipo 1 é baseada na administração subcutânea de insulina de acordo com os níveis de glicémia, o que contribui para a diminuição da qualidade de vida do doente. Assim, o objectivo deste projecto é produzir um sistema de veiculação de insulina sensível a condições de hiperglicémia, reduzindo a necessidade de monitorização dos níveis de glicémia e melhorando o controlo da homeostase da glucose.
Neste trabalho, iniciou-se o desenvolvimento de um sistema de veiculação de insulina sensível à hiperglicémia, usando nanoparticulas de ácido poli láctico/glicólico (PLGA) com vista a co-encapsular catalase e insulina e com derivatização à superfície com glucose oxidase (GOx). O principio da libertação da insulina baseia-se na conversão da glucose em H2O2 quando a glicémia está elevada e por sua vez o H2O2 é cindido em
H2O e O2 pela catalase, provocando o aumento da pressão dentro das nanopartículas e
consequentemente, a sua ruptura e a libertação da insulina.
Inicialmente, a encapsulação da catalase foi estudada e demonstrou-se não só que tinha actividade, mas que também que apresentava maior estabilidade do que a catalase livre. O seu perfil de libertação foi avaliado em resposta à presença de H2O2. A
imobilização de GOx à superfície das nanopartículas de PLGA foi conseguida com actividade enzimática e estabilidade significativa. Posteriormente, foi realizada a co-encapsulação de insulina e catalase nas nanoparticulas de PLGA e o perfil de libertação da insulina foi avaliado. No entanto, a libertação da insulina não foi influenciada pela presença de H2O2. Estes resultados demonstram que as condições óptimas de
encapsulação da catalase não são as mesmas para a insulina, uma vez que a superfície do PLGA é porosa e a insulina tem um tamanho mais pequeno que a catalase.
No trabalho futuro poder-se-á estudar a encapsulação de insulina ligada a polietilenoglicol (PEG), de modo a obter uma molecula maior e a evitar a sua libertação através dos poros na superfície do PLGA, melhorando o perfil de libertação da insulina.
Preparation and evaluation of an insulin delivery system sensitive to hyperglycaemia
xi
Abbreviations
BSA Bovine serum albumin
DCM Dichloromethane
DM Diabetes Mellitus
DMSO Dimethyl sulfoxide
EDC N-(3-Dimethylaminopropyl)-N′-ethylcarbodiimide
hydrochloride
EE Encapsulation Efficiency
EMA European Medicines Agency
FDA Food and Drug Administration
GOx Glucose oxidase
HCl Hydrochloric acid
H2O2 Hydrogen peroxide
HPLC High pressure liquid chromatography
KM Michaelis-Menten constant
Mw Molecular weight
NHS N-Hydroxysuccinimide
PLGA Poly(lactic-co-glycolic acid)
PVA Poly(vinyl alcohol)
PEG Polyethylene glycol
SEM Scanning electron microscope
t1/2 Half-life
xii
Vmax Maximum velocity
Preparation and evaluation of an insulin delivery system sensitive to hyperglycaemia
1
1.Introduction
1. Diabetes
1.1.Diabetes physiopathology
Diabetes mellitus (DM) is among the major global health problems, affecting approximately 415 million patients worldwide (Federation, 2015). According to recent studies, 60 million people suffer from DM in Europe and the disease has a prevalence of 13% in Portugal, corresponding to approximately 1 million people (Diabetologia, 2014;WHO, 2015). The distribution of DM around the world is heterogeneous and its increased incidence has a high impact in society. Following this, much attention has been given to new approaches in DM diagnosis and therapy (King et al., 1998;Mo et al., 2014;Veiseh et al., 2015).
DM is a metabolic disease diagnosed by glucose blood levels higher than 6 mmol/L (108 mg/dL) during the fasting period and/or glucose blood levels higher than 7.8 mmol/L (140 mg/dL) 2 hours after food ingestion (WHO, 2006;Veiseh et al., 2015). DM is characterized by several symptoms, including: frequent infections, increased urine volume, thirst and unexplained weight loss. Drowsiness and coma can occur in severe cases. Comorbidities with high impact to patient’s mortality, such as coronary artery disease, diabetic retinopathy, member amputation and renal insufficiency, may arise due to vascular complications caused by the difficulty to maintain normoglycaemia (Gu et al., 2013).
DM can be divided into type 1, type 2 and gestational diabetes. In DM type 1, an inefficient insulin production leads to a deregulated glycaemia homeostasis, whereas in DM type 2, cells of the Human body lack to respond to endogenous insulin (Mo et al.,
1.Introduction
2
2014;Veiseh et al., 2015). DM type 1 is an autoimmune disease affecting pancreas, characterized by β‑cells destruction mediated by immune system T‑cells (McCall et al., 2013). Also known as juvenile diabetes, DM type 1 accounts for 10% of diabetic patients and its therapy is based on insulin replacement coupled with a tight glucose monitoring (Dabelea, 2009). In contrast, in DM type 2 a gain of insulin resistance occurs, mainly associated with obesity and a poor life style and the initial non-insulin therapy has the main objective of delaying the disease progression (Veiseh et al., 2015). The most common cause of new cases of blindness is due to diabetic retinopathy, a microvascular disease that affects almost all patients with DM type 1 and more than 60% of patients with DM type 2 (Fong et al., 2004;Bjornstad et al., 2015). The third type of DM, called gestational diabetes is characterized by hyperglycaemia occurring during pregnancy. This condition may persist in a very low frequency after pregnancy and in some cases insulin is used for treatment (Guemes et al., 2015).
1.2.Insulin´s physiological action
In physiological conditions, pancreatic β‑cells in Langerhans islets produce insulin, a protein hormone responsible for the regulation of carbohydrate and lipid metabolism, having the main function of contributing to the homeostasis of glucose. This regulation is a vital function since glucose is a primary energy source for the brain cells (Stryer et al., 2008). Structurally, human insulin comprises 51 amino acids and has a molecular weight of 5808 Da. Insulin is synthesized as preproinsulin by β‑cells, undergoing several processes before becoming mature insulin which comprises two polypeptide chains (A and B) with three disulfide bonds, two of them connecting the polypeptide chains (figure 1.1).
Preparation and evaluation of an insulin delivery system sensitive to hyperglycaemia
3
In response to high levels of blood glucose, insulin is released by pancreatic cells, circulates through the blood stream and binds to insulin receptors located in insulin sensitive cells, promoting an increased presence of glucose transporters at the cell surface (Stryer et al., 2008). Insulin receptors, mainly located in skeletal muscle, adipose tissue and brain cells (figure 1.2), when activated, promote glucose transport from blood into cells through major glucose transporter (type 4, GLUT4) recruitment and translocation from intracellular vesicles to the cell surface
Figure 1.2 Schematic representation of insulin action
A
A
B
B
Figure 1.1(A) Crystal structure (PBD ID: 3I40; (Timofeev et al., 2010)) and (B) amino acid sequence of Human insulin (adapted from (PharmaWiki, 2015))
1.Introduction
4
Insulin receptor is a dimer and each sub-unit is formed by one α and one β chain, linked by a single disulfide bond. The β subunit of this receptor is inside the cell and has one transmembrane segment, whereas the α subunit has an extracellular location. The β subunit consists in a protein tyrosine kinase that catalyses phosphoryl group transference from adenosine triphosphate (ATP) to a tyrosine. A cross-phosphorylation performed by the two β subunits on each other leads to the activation of the receptor and initializes a signalling cascade inside the cell with several players, including protein kinase B (Akt), mainly associated with metabolic processes (Saltiel et al., 2001;Stryer et al., 2008). In response to low insulin levels, insulin is dissociated from its receptor interrupting the signalling cascade, promoting GLUT4 recycling back into the cytosol and stopping glucose entrance into the cell (Stryer et al., 2008;Mo et al., 2014).
Insulin pathway is involved in glucose metabolism and lipid metabolism in the liver, adipose tissue and skeletal muscle, represented in figure 1.2. While promoting glucose transport into cells, insulin is also contributing to glucose storage in the target tissues, but its action is much more vast, including: appetite decrease; stimulation of glycogen synthesis in muscle and liver; reduction of glucose release, hepatic glycogenolysis (glycogen breakdown) and gluconeogenesis (glucose synthesis pathways); enhancement of lipogenesis in the liver (fatty acid synthesis) and lipolysis (lipid breakdown) inhibition in adipose tissue (Stryer et al., 2008;Matteucci et al., 2015). All these mechanisms demonstrate the importance of insulin in the regulation of carbohydrate and lipid metabolism. In addition, insulin also decreases autophagy, renal sodium excretion and proteolysis (Puigserver et al., 2003;Quan et al., 2013;Bunner et al., 2014;Mo et al., 2014).
Insulin action contributes to keep glucose blood levels between 4 and 6 mmol/L (72 to 108 mg/dL) (WHO, 2006;Veiseh et al., 2015) and its production follows a pattern under physiological conditions. A continuous basal secretion occurs during fasting periods and an increased insulin production is induced after food ingestion. At meal time, insulin concentration increases leading to a peak after 45-60 minutes and returns to basal levels within 2/3 hours after meal. An important aspect of insulin production during the night and other prolonged fasting periods is its dependence with other factors such as circadian rhythms that contribute to regulate glucose production (Pettus et al., 2015).
Preparation and evaluation of an insulin delivery system sensitive to hyperglycaemia
5
1.3.Insulinotherapy
According to the type and the stage of DM, glycaemia levels may need to be regulated through insulin therapy. Clinical application of insulin was an important milestone in the therapy of DM (figure 1.3), since until then DM therapy was only based in food restriction and associated with a poor prognosis (Sanger et al., 1953;Johnson, 1983;Mayer et al., 2007). Even after insulin isolation, immunogenicity associated with insulin of animal origin and low purity were negative aspects that caused poor reproducibility of the therapeutic response and patient compliance. Currently, recombinant technology is able to synthesize Human insulin and analogues with improved stability and prolonged action. The administration of external insulin aims to mimic insulin levels, pattern of secretion and distribution, promoting the achievement of physiologic glucose blood concentrations. Nevertheless, despite several important accomplishments in DM therapy including the isolation of bovine insulin and the production of Human insulin, the amount of administrated insulin still needs to be regulated according to patient glucose levels monitoring, through multiple daily injections. Furthermore, insulin administration is mostly subcutaneous and is associated with pain, hypoglycemia episodes and weight gain (Kennedy, 1991;Hanås et al., 1997;Fonte et al., 2015). Type 1 DM patients make use of a combination of two types of insulin in a multiple daily injection scheme including long-acting and rapid-acting insulin according to the food ingestion periods, requiring approximately 4 injections per day (Tibaldi, 2014;Pettus et al., 2015). Several long-acting insulin formulations, shown on table 1-1, are commercial available and provide a slow insulin action, mimicking basal insulin levels in fasting periods. In contrast, rapid-acting insulin formulations are able to increase insulin levels in a short period of time, which is ideal to control blood glucose after meal time. Besides the need of multiple insulin administrations, a major concern in the therapy of DM is nocturnal hypoglycemia, a dangerous situation that can occur due to small basal insulin increase. Moreover, evening physical exercise appears to be a risk factor for nocturnal hypoglycemia (Briscoe et al., 2006;Campbell et al., 2015;Wilson et al., 2015).
Preparation and evaluation of an insulin delivery system sensitive to hyperglycaemia
6 Figure 1.3 Schematic representation of the principal milestones of insulin therapy
Preparation and evaluation of an insulin delivery system sensitive to hyperglycaemia
7
The advances in recombinant DNA technology allowed new insulin structure modifications, such as: substitution, addition or depletion of specific amino acids. These modifications helped to optimize insulin pharmacodynamic and pharmacokinetic profiles, including insulin absorption delay, which lead to the commercialization of newer long-acting insulin formulations, such as Glargine and Determin (table 1-1). A consequence of these formulations with a larger period of action was to provide a more flexible administration, increasing patient compliance. However, overnight blood glucose control is still a problem in many situations; as well as weight gain (Heinemann et al., 2000;Kurtzhals, 2007;Pettus et al., 2015). More recently, ultra-long-acting insulin (i.e. degludec, table 1-1) with increased action duration and less pharmacodynamics variations and hypoglycemic events represent an interesting alternative enabling only one injection per day. Furthermore, conjugation of insulin with polyethylene glycol (PEG) (i.e. peglispro) also provides a longer duration of rapid-action insulin, lispro (table 1-1). Despite these recent developments concerning insulin formulation, drawbacks of conventional injectable insulin stimulate research regarding new administration routes and insulin delivery systems. In order to improve patient compliance and mimic physiologic insulin response, oral and pulmonary administration routes are seen as promising approaches.
Taking into account patient compliance, oral administration is the most attractive. In addition, the possibility of having an intestinal absorbance through oral route would allow insulin to reach the liver through portal circulation, which is the first target of pancreatic insulin secretion and where a tight glycaemia control occurs. This route is closer to what happens in physiological conditions in contrast with subcutaneous administration, where only approximately 20% of insulin reaches liver (Brown et al., 1979;Gordon Still, 2002;Sonaje et al., 2010). Unfortunately, insulin bioavailability is drastically reduced by oral administration due to stomach acidic pH as well as due to enzymatic and physical barriers. The acidic pH of stomach and enzymatic activity contributes to insulin degradation whereas the gastrointestinal epithelium is impermeable to insulin (Chen et al., 2011;Chaturvedi et al., 2013). Following this, several strategies have been designed in order to protect insulin native structure, such as: the co-delivery with enzyme inhibitors, the use of absorption enhancers and also insulin delivery systems (Morishita et al., 1993;Sindhu et al., 2011).
Preparation and evaluation of an insulin delivery system sensitive to hyperglycaemia
8 Table 1-1 Available insulin formulation
Administration
Active molecule
name
Type Structural Modification Consequence Advantage Time of
action Year (FDA/EMA) Ref Su b cu tan e o u s Lispro Rapid
Lysine (B29) and proline (B28) on the C-terminal end of β chain are
reversed
Formation of insulin dimers and hexamers is blocked
Insulin monomers are
immediately available 4 hours 1996/1996
(Atkin et al., 2015)
Aspart Rapid Proline (B28) replaced by aspartic
acid Inhibited aggregation into hexamers
Rapid entrance in
bloodstream 5 hours 2000/2000
(Hermansen et
al., 2015)
Glargine Long
Substitution of asparagine for glycine (A21); Addition of two
argine (B21 and B32)
Insulin isoelectric point changes from pH 5.4 to pH 6.7 – microcrystals formation after
injection
Slow insulin release 4 hours 2000/2000 (Pettus et al., 2015)
Glulisine Rapid
Asparagine (B3) replaced by lysine; lysine (B29) replaced by
glutamic acid
Insulin hexamers formation inhibited Rapid entrance in
bloodstream 5 hours 2004/2004
(Heise et al., 2007)
Determin Long
C14 fatty acid covalent bond to lysine (B29); terminal threonine
(B30) removal
Insulin increased self-association into hexamers and di-hexamers; reversible binding to albumin
Slow absorption into bloodstream 24 hours 2005/2004 (Atkin et al., 2015) Degludec Ultra-long Deletion of threonine (B30); C16 fatty acid linked through a
glutamic acid spacer
Insulin soluble multihexameric chain
Slowly monomers dissociation into bloodstream Up to 40 hours 20 15/2013 (Atkin et al., 2015)
Pulmonary Afrezza Rapid
Insulin encapsulation within microspheres of fumaryl diketopiperazine (FDKP)
Microparticles dissolve in neutral pH of lungs Rapid absorption of insulin 2-3 hours 2014/ --- (Sarala et al., 2012)
Preparation and evaluation of an insulin delivery system sensitive to hyperglycaemia
9
Besides oral administration, pulmonary administration is also an interesting approach due to: the large surface area for absorption in the lungs; tiny alveolar membrane; and high vascularization, which are important properties to allow efficient insulin permeation. On the other hand, insulin raw material is not breathable and the size of insulin delivery systems for pulmonary administration must be comprehended between 1 and 3 µm not to be exhaled, swallowed or retained in the upper airways (Byron, 1990;Klingler et al., 2009).
Despite the clear advantages of these non-invasive routes, low bioavailability and poor therapeutic efficacy are also still two major drawbacks (Hamishehkar et al., 2010;Mo et al., 2014). In addition, insulin delivery through buccal, nasal and transdermal are also seen as alternative routes with potential to overcome currently diabetic therapy problems (Fonte et al., 2015).Following this, a more comfortable administration route besides the tight blood glucose control without requiring glycaemia monitoring remain as two unfulfilled needs in DM therapy in order to promote a better quality of life to DM patients.
2. Nanoparticles delivery systems
2.1.Nanoparticles delivery systems – general aspects
Developed research concerning insulin action and DM disease contributed to a comprehensive understanding of therapeutic opportunities and challenges. An ideal insulin delivery system should be able to respond autonomously to glucose levels, contributing to promote normoglycaemia and to improve patient’s lifestyle and compliance. Furthermore, insulin delivery systems based on nanoparticles are interesting approaches due to the need of insulin protection against pH and enzymatic degradation and due to the possibility of being capable to cross specific barriers such as skin and intestinal barrier, increasing insulin bioavailability and promoting a controlled release through structural modifications on nanoparticles surface (Ma, 2014;Pandita et al., 2015). Examples of insulin encapsulation using different types of delivery systems
1.Introduction
10
are presented in table 1-2 and all referred studies had the purpose to reduce glycaemia levels reduction using in vitro and in vivo conditions.
Nanoparticle delivery systems represent an important approach in the therapeutic field of many diseases such as DM, cancer, and inflammatory diseases (Pandita et al., 2015). Not only with the purpose to obtain more efficient drug delivery systems, nanoparticles have also been explored for the diagnosis of several diseases (Kapoor et al., 2015;Pandita et al., 2015;Sadat et al., 2015). Nanoparticles are solid structures, typically with 100 nm and with physical, chemical and biological properties tuneable according to their constituents and production method (Sharma et al., 2015;Yu et al., 2015). A large range of molecules can be incorporated within nanoparticles from small drugs to macromolecules, including vaccines. Drug delivery systems may not only promote drug delivery to a specific target, but may also allow an improved metabolic stability, time of action and a low systemic toxicity (Kanzarkar et al., 2015;Kovalainen et al., 2015). Particles surface engineered with antibodies, proteins and other molecules may be used to increase selectivity for specific organs and tumours, influencing biodistribution and promoting enhanced half-life time in blood (Danhier et al., 2012;Pandita et al., 2015). Moreover, although many materials are already approved by Food and Drug Agency (FDA) and European Medicine Agency (EMA) for drug delivery systems in Humans, some toxicity issues such as immunogenicity may be associated with nanoparticles showing the importance of in vitro and in vivo toxicity testing. Nanoparticles properties including size, shape and surface charge may be fine tuned in order to circumvent toxicity issues (Makadia et al., 2011;Shah et al., 2014). Furthermore, the scaling-up of these systems and the high cost of nanoparticles are two other drawbacks of nanotechnology (Danhier et al., 2012).
Preparation and evaluation of an insulin delivery system sensitive to hyperglycaemia
11 Table 1-2 Examples of insulin delivery systems
ISTPPLG: insulin-loaded tocopherol poly(ethylene glycol) 1000 succinate-emulsified poly(ethylene glycol)-capped poly(lactic-co-glycolic acid) nanoparticles; SP: soybean phosphatidylcholine
Particles Properties Therapeutic Outcome
Ref
Observations Material Method EE (%) Size Administration
route Burst Release In sul in PLGA (85:15) Double emulsion 50 350 nm Skin 15-25% Insulin-protamine complex Sustained release of insulin over one week Improved insulin stability in PLGA particles
(Wang et al., 2008) Soybean
lecithin
Homogenizatio
n 89 100 nm Skin ---
Enhanced insulin transdermal delivery through
microneedle-induced microchannels (Chen et al., 2009) PLGA
(50:50) and cyclodextrin
Double
emulsion 59 26.2 µm Nasal ± 30%
Large porous biodegradable particles
Dry powder formulation for controlled release of insulin (Ungaro et al., 2009) PLGA
(50:50)
Double
emulsion 57.8 1-6 µm Nasal 25%
Pharmacokinetic studies show a sustained insulin release profile (90% release in 48 hours)
Minimal toxicity signs (inflammation)
(Hamishehkar et al., 2010) Chitosan Polyelectrolyte
complexation 55 ± 235 nm Oral < 10%
Protection of insulin and high delivery through intestinal barrier
pH sensitive insulin delivery (Makhlof et al., 2011) ISTPPLG Double
emulsion 8.6 180 nm Oral ± 20%
Insulin release with glucose levels control; reduction of
cholesterol, urea, creatinine levels (Malathi et al., 2015) PLGA
(50:50)
Double
emulsion 9.2 279 nm Oral ± 10%
PLGA nanoparticles with Concanavalin A on its surface to increase lymphatic uptake
Sustained insulin release
(Hurkat et al., 2012) Carbon
spheres with chitosan
3.4 330 nm Oral < 10% Nanospheres coated with a biocompatible polymer; Improved intestinal absorption and insulin release
(Ganeshkumar et al., 2013) PLGA (50:50) Double emulsion 60 < 200 nm Oral 20%
Nanoparticles surface coating with peptides to improve intestinal
absorption (Zhu et al., 2015)
PLGA, PEG and SP
Double
Preparation and evaluation of an insulin delivery system sensitive to hyperglycaemia
12
An essential aspect for a successful nanoparticle formulation is to have a high drug loading (i.e. percentage of loaded amount of drug relative to the total amount of nanoparticles) and encapsulation efficiency (EE) (i.e. percentage of loaded amount of drug relative to the total amount of drug used for the formulation), with the aim of reducing the amount of solids that are administrated and the production costs (Danhier et al., 2012), but poor drug loading is a frequent occurring negative condition that need be optimized. The most popular method for drug encapsulation is the incorporation of the drug during nanoparticles production; but drug adhesion after particle production may also be applied. An important parameter during drug encapsulation is the stability of the encapsulated molecules during the process in order to avoid aggregation and activity loss in the case of the encapsulation of enzymes, for instance. Among other characteristics, particle size is a very important one, since it influences cell uptake, recognition by the immune system and drug release profile (Owens et al., 2006;Mittal et al., 2007). In general, nanoparticles vary in size between 10 and 1000 nm but ideally, particles should be smaller than 200 nm to have a prolonged bloodstream circulation (Singh et al., 2009;Sharma et al., 2015).
2.2.Poly(lactic-co-glycolic acid) (PLGA)-based nanoparticles
2.2.1.General aspects
Poly(lactic-co-glycolic acid) (PLGA) is a biodegradable and biocompatible polymer widely used in several kinds of nanoparticles systems, such as: vaccines, protein delivery, anti-inflammatory, antibiotic and in anticancer therapy formulations (Horisawa et al., 2002;Jiang et al., 2005;Choi et al., 2006;Luo et al., 2009;Toti et al., 2011). This polymer is available in several molecular weights and copolymer composition, which influences its degradation time, particle size and drug encapsulation (Danhier et al., 2012;Mohammadi-Samani et al., 2015).
Composed by lactic and glycolic acid, PLGA is associated with a minimal systemic toxicity, due to the fact that these monomers, produced by PLGA hydrolysis, can be
Preparation and evaluation of an insulin delivery system sensitive to hyperglycaemia
13
found endogenously and may be incorporated in the Krebs cycle (Muthu, 2009). FDA and EMA approval for PLGA bioapplication in humans contributed to its popularity and extensive study. Its capability to promote drug sustainable release allows a reduced frequency of administration, dose and to achieve stable drug levels in blood, leading to an increased therapeutic effect and reduced side effects. This sustainable release is mainly caused by polymer degradation through two different mechanisms: bulk erosion, consisting on a homogeneous and predominant degradation of PLGA; and surface erosion that arises in a heterogeneous manner. A low polymer molecular weight increases solubility in organic solvent causing a solidification rate decrease which leads to more porous and smaller particles (Mu et al., 2003;Mittal et al., 2007;Makadia et al., 2011). Smaller particles have higher surface area which is good for drug diffusion. Also, low polymer concentration and lactic ratio promotes particles with more porous structure and an increased hydrophilic nature, respectively (Mu et al., 2003;Yeo et al., 2004;Doan et al., 2013). A negative aspect of PLGA degradation is the pH reduction of the microenvironment which may influence drug stability and release (Sung et al., 2004;Ding et al., 2008). The degradation and interaction of PLGA products with drug molecules contributes to drug decomposition and incomplete drug release (Zolnik et al., 2007;Makadia et al., 2011). Moreover, burst release, which occurs through fissures and pores of the particles, represents one of PLGA pitfalls (Yeo et al., 2004;Hinds et al., 2005). Despite the fact that the fast release of drug in a burst stage is used in specific drug administration strategies, the negative effects brought by burst effect can be pharmacologically dangerous and economically inefficient. Molecules adsorbed to the nanoparticles surface are also responsible for burst release. Several conditions may be fine tuned in order to reduce this effect including the polymer hydrophobicity, polymer concentration and amount of drug loaded. High burst effect is associated with copolymer PLGA composition since a high glycolic acid content increases water uptake from the medium and a fast particles hydration (O'Hagan et al., 1994). High amounts of drug loaded are also related to increased values of this effect, probably because of the high active principle concentration gradient between the nanoparticles and the medium. Associated to adsorbed proteins on particles surface is the creation of water channels on nanoparticles structure that promote high burst releases associated to high protein loadings (O'Hagan et al., 1994;Yang et al., 2001). Moreover, reduced polymer
1.Introduction
14
concentration promotes internal porosity and high burst effect (Yang et al., 2001;Yeo et al., 2004).
2.2.2.Formulation Methods
Many techniques can be used to produce PLGA-based nanoparticles. According to drug properties, several nanoparticles production methods may be used in order to achieve the desired drug loading and release. In the emulsification solvent diffusion method, PLGA and drug are dissolved in a partially water-miscible solvent such as benzyl alcohol, which is then dispersed in a great amount of water. This quantity of water is sufficient to cause diffusion of the solvent into the external phase, deposition of the polymer around the droplets and nanoparticles formation (Kwon et al., 2001;Guinebretiere et al., 2002). Moreover, in the emulsification-salting out method, used to encapsulate lipophilic molecules, the PLGA dissolved in acetone is emulsified in an aqueous solution with a high salt concentration (Reis et al., 2006;Felice et al., 2014). In addition, nanoprecipitation consists in the diffusion of a solution containing the drug and PLGA into a non-solvent (where both drug and polymer are not dissolved). Polymer diffusion into the non-solvent solution produces a rapid polymer precipitation and drug encapsulation. This method is primarily used for the encapsulation of hydrophobic drugs (Bilati et al., 2005;Felice et al., 2014).
The most commonly used method for encapsulation within PLGA particles is the emulsification-solvent evaporation technique, mainly applied for hydrophobic drugs encapsulation. Relatively simple and without needing expensive instruments, in this method several parameters need to be tuned such as the kind of organic solvent used, temperature and rate of homogenization (Blanco et al., 1998;Katare et al., 2006;Wang, 2010). Single or double-emulsion-solvent evaporation techniques are based on the formation of one or two emulsions using high-speed homogenization or sonication, followed by organic solvent evaporation.
In the single-emulsion technique, the emulsion is produced after dissolving both drug and polymer in an organic solvent, the oil (O) phase, which is then emulsified in water (oil in water, O/W). The water phase contains water and a surfactant, such as poly(vinyl alcohol) (PVA) (Menon et al., 2012;Sadat et al., 2015). The presence of the
Preparation and evaluation of an insulin delivery system sensitive to hyperglycaemia
15
surfactant contributes to the emulsion stability and prevents particles aggregation, by changing the zeta potential. During sonication or homogenization, nanosized droplets are generated and the organic solvent is then allowed to evaporate.
In order to encapsulate hydrophilic drugs such as: proteins, peptides or nucleic acids, a variation of this oil in water (O/W) technique is needed. Hydrophilic drugs require a double emulsion W/O/W technique in order to have a first shield of water where the drug is dissolved. The W/O/W procedure is produced by a primary water in oil (the aqueous solution is dispersed in the organic solution) and a second oil in water emulsion (Danhier et al., 2012;Menon et al., 2012;Sadat et al., 2015). The stability of these emulsions influences drug encapsulation, with particular emphasis to the first emulsion, highly associated with the loss of drug activity (van de Weert et al., 2000). In many cases, after solvent evaporation, nanoparticles are collected by centrifugation and dried, using procedures such as lyophilisation. Lyophilisation allows long term stability of nanoparticles storage at low temperatures; although in some cases nanoparticles are preferentially stored in an aqueous solution without undergoing any drying process (Abdelwahed et al., 2006;Kasper et al., 2011).
The common step in all techniques is the production of a first emulsion, whereas the second step varies according to the procedure. More stable emulsions produce smaller particles, depending on the kind of surfactant used and its concentration (Sahoo et al., 2002;Budhian et al., 2007).
2.2.3.Protein encapsulation
Currently, the administration of proteins is mainly based on repeated injections through invasive routes, such as subcutaneous and intravenous (Shaji et al., 2008).Many efforts have been done to improve protein delivery using nanoscale vehicles, with the attempt to protect proteins from enzymatic and hydrolytic degradation, enhance bioavailability and protein concentration at the target tissue (Sharma et al., 2015;Yu et al., 2015).
PLGA nanoparticles formulation steps, above highlighted, are critical for protein stability. Focusing on W/O/W method, the presence of water/organic solvent interfaces
1.Introduction
16
is a huge drawback since it is identified as the major cause of protein unfolding, followed by denaturation and aggregation (Qi et al., 2011;Kovalainen et al., 2015). The shear stress created by homogenization and sonication also promotes protein aggregation. In particular, sonication seems to be more aggressive to protein stability due to local temperature extremes and free radical formation. Hydrophobic contacts between protein and polymer are also responsible for unfolding and aggregation (Kang et al., 2001;Wu et al., 2011). All procedure steps are critical and may induce protein denaturation and aggregation, but the first emulsion is more detrimental and in many cases additives should be added to the first emulsion in order to reduce water/organic solvent interfaces and to promote protein stabilization. Addition of bovine serum albumin (BSA), gelatin, surfactants and sugars are some examples of excipients used in this technique (Morlock et al., 1997;Pérez-Rodriguez et al., 2003;Singhal et al., 2013). These additives are able to decrease protein interaction with W/O interface and interact specifically with protein surface, promoting the protection of hydrophobic regions, which reduces protein denaturation and aggregation (Ye et al., 2010;Fonte et al., 2012;Ma, 2014). Furthermore, besides bioactivity loss, denatured or aggregated proteins may induce toxicity and immunogenicity (Perez et al., 2001;Castellanos et al., 2002;Ye et al., 2010).
In the second emulsion, interfacial stress is also responsible for protein unfolding. Moreover, during the generation of the second emulsion, water channels between internal and external aqueous phases may lead to protein escape from inner droplets, increasing interface area and protein denaturation. In the drying step, the removal of solvent may also cause denaturation and aggregation of proteins. Following this, many processes need to be optimized during polymeric nanoparticles formulation to avoid denaturation or aggregation of native proteins, which influences its release and therapeutic efficacy (van de Weert et al., 2000;Ye et al., 2010).
Preparation and evaluation of an insulin delivery system sensitive to hyperglycaemia
17
3. Enzyme kinetics
3.1.General aspects
Enzymes are biologic catalysts, capable of increasing the rate of chemical reactions by reducing its activation energy. Cellular environment is often unfavourable to non-catalysed reactions and many reactions would occur in an unsuitable rate without catalysis. Therefore, enzymes provide favourable environments for these reactions, being indispensable to life (Lehninger et al., 2008;Stryer et al., 2008). Moreover, enzymes are not destroyed during the reaction process, are high specific and do not interfere in the chemical equilibrium (Lehninger et al., 2008;Stryer et al., 2008). Nearly all enzymes are proteins, generally with a globular structure and one or more substrates binding sites. Enzymes activity is determined by its tridimensional structure and influenced by several conditions including: pH, temperature, substrate concentration and ionic strength (Scopes, 2002). A small part of the tridimensional structure is the active site, where substrates bind. This area is responsible for enzymatic specificity defined by its charges and shape properties, allowing the binding of a single kind of substrate. In accordance to this complementarity, the “lock and key hypothesis” was proposed by Fisher in 1894, proposing that only a specific substrate (key) was able to bind to a particular active site (lock). Currently, another hypothesis was raised, which is based on a slight enzyme shape modification that allows substrate binding (known as the “glove-in-hand” model) (Stryer et al., 2008;Robinson, 2015). Enzymatic activity can also be dependent on the presence of cofactors, a non-protein component with organic (coenzymes) or metal nature. An enzyme without its cofactor is named apoenzyme, whereas the complete catalytic structure is the holoenzyme. Additionally, cofactors tightly bound to enzymes are known as prosthetic groups (Stryer et al., 2008).
Enzyme kinetics is the study of reaction rates catalysed by enzymes, which is an important tool to characterize enzyme function. During an enzymatic reaction, an increase of product amount though time is observed until the reaction reaches an equilibrium state. In 1913, Michaelis and Menten proposed the model described by equation 1, where E is the enzyme, S is the substrate, P is the product and ES is the enzyme-substrate complex. The limiting step of these reactions is the breakdown of the
1.Introduction
18
ES complex, which is dependent on the kcat (catalytic constant) and that leads to product
formation, whereas the first reaction is fast and reversible and in this case dependent on the rate constants: k1 and k-1(Michaelis et al., 1913;Lehninger et al., 2008).
In equation 2, vmax is the maximum initial reaction rate and KM is the
Michaelis-Menten constant. KM is associated with the affinity of the enzyme for a substrate at a
specific temperature and pH. Small KM is related to high substrate affinity, promoting a
fast achievement of vmax. The relation between the reaction rate (vO) and the substrate
concentration [S] is represented in figure 1.4, where vmax is approached asymptotically
whenever the substrate concentration is high and KM is the substrate concentration
when the reaction rate is half of vmax. Moreover, whenever the substrate concentration
is much smaller than KM, the reaction can be reduced to a first order equation where the
reaction rate is directly proportional to the substrate concentration. However, when the substrate concentration is much higher than KM, v0=vmax, a zero order equation can be
used independently of the substrate concentration(Michaelis et al., 1913;Stryer et al., 2008).
(1) (2)
Preparation and evaluation of an insulin delivery system sensitive to hyperglycaemia
19
3.2.Activity assays
The study of enzyme activity is essential to understand its physiologic functions, pathologic importance and even how they can be used in the therapeutic field. The enzyme activity is influenced by several conditions such as: temperature, pH, solvents and immobilization. A comprehensive study of these parameters allows extrapolation to in vivo activity. However, in vitro studies do not mimic the complexity of in vivo environment (Scopes, 2002;Robinson, 2015).
The activity assay can be studied based on substrate consumption or product formation and can be performed following the progression of the reaction continuously or stopping the reaction at fixed times. In the first case the activity can be followed directly by measuring specific parameters, such as: absorbance, pH or fluorescence for instance allowing product or substrate quantification. This analysis has the advantage of being direct, avoiding operating errors related with the stopping procedure. Moreover, a continuous coupled assay can also be performed, where the product of a first reaction is used by a second enzyme, leading to a detectable change, generally absorbance. The constant rate can be determined in this case if no product inhibition and reversal of reaction occurs (Henderson et al., 1992;Purich, 2002;Scopes, 2002). In the non-continuous assay, an extreme condition such as acidic or alkali pH, extreme temperatures or irreversible inhibitors are used to interrupt the reaction and proceed to substrate/product quantification (Purich, 2002;Scopes, 2002).
3.3.Catalase
Catalase was named in 1900 by Loew, after its identification as responsible for H2O2 breakdown, however, only 86 years later, Human catalase gene was isolated and
characterized(Loew, 1900). Despite the difference in the Catalase amino acid sequence between different species, some specific amino acids related to enzyme function are conserved and allow the general definition of mammalian catalase (Zamocky et al., 1999). Structurally, mammalian catalase is a homotetramer with a molecular mass (Mw) of 225–270 kDa and each subunit comprises a heme group at the active site only reachable by small substrates (figure 1.5). In comparison to many other enzymes,
1.Introduction
20
catalase is more resistant to pH and thermal changes due to its rigid and stable structure (Kirkman et al., 2007).
Physiologically, catalase is an antioxidant enzyme involved in cell protection against reactive oxygen species (ROS) produced during aerobic respiration, with a predominant function of controlling hydrogen peroxide (H2O2) concentration. In order to
prevent oxidative stress and its destructive effects, catalase and other enzymes such as superoxide dismutase and peroxiredoxin have a protective role in aerobic cells, although their activity are also found in anaerobic environments (Rocha et al., 1996). Catalase is a very efficient enzyme, capable to decompose about 107 million molecules of H2O2 per
second and its activity is predominant in liver, erythrocytes, kidney and adipose tissue (Goyal et al., 2010). Moreover, the catalase capability to break H2O2 into molecular
oxygen and water (equation 3), without free radicals production is an important aspect to avoid cellular death. Despite its relevance in physiological conditions, catalase deficiency is mainly a risk factor besides the enzyme deficiency. Catalase deficiency or acatalasemia, which refers to an inherited near-total deficiency of its activity, is associated to inflammation, inhibition of apoptosis and cancer (Kirkman et al., 2007;Goth et al., 2013). Furthermore, catalase appears to be related to DM development as a result of β cells damage by H2O2 (Kirkman et al., 2007;Afanas' ev,
2010).
2 H
2O
2→2 H
2O+O
2(3)
Figure 1.5 Crystal structure of human catalase PDB ID: 1DGF, (Putnam et al., 2000)
Preparation and evaluation of an insulin delivery system sensitive to hyperglycaemia
21
Due to its physiologic activity, catalase can be used as a therapeutic enzyme in order to reduce high ROS levels in several pathologic conditions such as radiation, ischemia and tumour progression (Singhal et al., 2013;Huang et al., 2015). The purpose of using catalase as a therapeutic agent is challenging. In contrast with some low molecular weight antioxidants, such as vitamin C and ascorbate, catalase has a large size and its distribution is restricted to certain tissues and organs. This limitation can however be an advantage in some diseases, such as cancer. Unique tumour vasculature is fenestrated and large size molecules can easily cross, providing a controlled release of this enzyme (Ma et al., 2006;Nishikawa et al., 2009). In addition, the in vivo delivery of catalase is associated with a fast degradation and limited passage through membranes (Nishikawa et al., 2005;Nishikawa et al., 2009). An interesting approach to overcome delivery problems is to encapsulate or immobilize catalase on the surface of nanoparticles delivery systems (Giovagnoli et al., 2005;Li et al., 2012;Wu et al., 2013;Vilian et al., 2014). Nevertheless, poor encapsulation efficiency and activity retention remain as relevant problems that still need to be solved.
3.4.Glucose Oxidase
In 1928, Muller discovered Glucose-1-Oxidase (GOx) in Aspergillus niger extracts, allowing its DNA sequencing and protein structure determination in the next few decades (Kriechbaum et al., 1989;Wohlfahrt et al., 1999). In nature, GOx is produced by some fungi and insects. GOx is a glycoprotein, homodimer, composed by two identical subunits, each one with 80 kDa, and two flavin adenine dinucleotides (FAD) non-covalently bound, illustrated on figure 1.6 (Pazur et al., 1965;Wong et al., 2008). The FAD coenzyme acts as an electron carrier (Wilson et al., 1992). Also, GOx reaction requires an electron acceptor, commonly dissolved oxygen, while the sugar molecule is the electron donor (Bohmhammel et al., 1993;Wong et al., 2008). GOx catalyses the oxidation of beta-D-glucose to D-gluconolactone and H2O2 (equation 4) and both of this
products spontaneously break down into gluconic acid and water and oxygen, respectively (Wilson et al., 1992;Wong et al., 2008).
1.Introduction
22
Glucose+ O
2→D-gluconolactone+ H
2O
2(4)
An interesting GOx property is its high specificity for glucose. In comparison to the reaction rate of glucose (100%), only 2-deoxy-D-glucose, 4-O-methyl-D-glucose and 6-deoxy-D-glucose suffer oxidation by GOx, but with reaction rates lower than 20% (Pazur et al., 1964;Wong et al., 2008). In addition to its specificity, GOx is an enzyme with high stability and high turnover. Therefore, many industrial and commercial applications use GOx, such as food and healthcare industry. In the alimentary field, it is commonly used as preservative and to reduce alcohol wine content, while in the healthcare sector it is widely used in biosensors (Wong et al., 2008). Biosensors evolution through the last decades was impulsed by DM diagnosis and monitoring. In fact, glucose biosensors used by DM patients are based in the use of GOx. In 1962, the concept of measuring glucose levels through a biosensor was proposed. Glycaemia was firstly measured based on GOx reaction by quantifying oxygen consumption that was proportional to glucose concentration. But in order to increase enhance glucose monitoring precision, further GOx reaction was explored and in 1974 the first glucose biosensor was commercially available and was based on H2O2 detection. Currently,
glucose monitoring is based on electron transference between GOx and specific electrodes (Kirsch et al., 2013;Taguchi et al., 2014).
Figure 1.6 Crystal structure of glucose oxidase from Aspergillus Niger, PBD ID:1GAL (Hecht et al., 1993)
Preparation and evaluation of an insulin delivery system sensitive to hyperglycaemia
23
3.5.Glucose-sensitive systems
Glucose-sensitive systems are extensively studied with the purpose of insulin delivery, taking advantage of a specific response to high glucose levels. Currently, insulin release triggered by glucose follows one or both of the two mechanisms: material alteration in response to a change of an environmental condition or through a reaction exchange of preloaded insulin with glucose (Wu et al., 2013).
Regarding the first referred mechanism, many authors have been using hydrogels, polymeric and inorganic nanoparticles to encapsulate or immobilize GOx and to promote a reduction of the pH environment (Traitel et al., 2000;Yoshimoto et al., 2006;Qi et al., 2009;Wu et al., 2012). Qi et al, 2009 produced an insulin particle coated with catalase and GOx multilayer shields that promotes insulin release due to pH change. In the presence of GOx, glucose is converted in H2O2 and gluconic acid (equation
3) that decreases pH environment levels and therefore, increases permeability of GOx shell. Reduction of pH levels also increase insulin release since in a more acid pH, insulin is more soluble. The addition of catalase to the system is an important aspect since H2O2
levels produced through GOx reaction can be toxic in vivo causing deactivation of GOx (Traitel et al., 2000;Gu et al., 2013;Wu et al., 2013). Gu et al, 2013 described a nano-network of chitosan and alginate nanoparticles encapsulated with insulin, GOx and catalase, capable to release insulin through a pH reduction and nano-networks dissociation. These nano-networks compose a macro scale system, which decreases in size through dissociation and therefore, insulin release (Gu et al., 2013).
Moreover, insulin delivery can also be promoted by glucose competitive binding to specific proteins, such as concanavalin A (Con A). Yin et al, 2012 reported an insulin loaded hydrogel based on Con A and dextran, a polysaccharide composed by D-glucose. In this system, free glucose competes with dextran for Con A binding, leading to insulin release in the presence of high glucose levels and hydrogel dissociation(Yin et al., 2012). Another example of this kind of glucose-sensitive systems is the described by Kim at al, 2001, where a polymeric-Con A complex is produced. Due to free glucose binding to Con A, the complex dissociates and insulin release is achieved (Kim et al., 2001).
1.Introduction
24
4. Objectives
The major goal of this study was to initiate the development of a smart drug delivery nanosystem for insulin. This delivery system was aimed to be sensitive to hyperglycaemic conditions and capable of maintaining glucose blood concentration within physiological values.
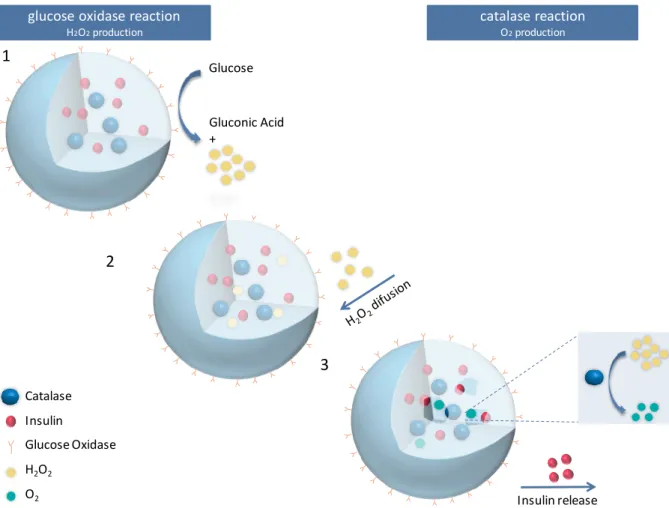
The rationale is based in the ability of GOx to produce H2O2 from glucose, and
that of catalase to convert H2O2 to O2 as illustrated in fig 1.7. The nanoparticle payload,
co-encapsulated with catalase, should be released as result of pO2 build-up, and
consequent pore formation on the nanoparticle surface.
For sequential optimization, PLGA-based nanoparticles conjugated to GOx and encapsulating catalase, were produced by the W/O/W technique and this procedure was optimized in order to achieve catalase release in the presence of high glucose levels. Later on, insulin was co-encapsulated and the system was tested for the release of insulin upon H2O2 stimulus.
catalase reaction O2production glucose oxidase reaction
H2O2production Catalase Insulin Glucose Oxidase H2O2 O2 Glucose Gluconic Acid + 1 2 3 Insulin release
Preparation and evaluation of an insulin delivery system sensitive to hyperglycaemia
25
2.Materials
PLGA, with a lactide/glycolide molar ratio of 75:25 and an inherent viscosity of 0.22 dl/g (Purac´s PURASORB) was used. PVA (Mw= 31-50 kDa; 98-99% hydrolyzed), dichloromethane (DCM), dimethyl sulfoxide (DMSO), bovine catalase (2000-5000 units/mg), Aspergillus Niger glucose oxidase (228253 units/g), N-Hydroxysuccinimide
(NHS, Mw= 115.09 g/mol), N-(3-Dimethylaminopropyl)-N′-ethylcarbodiimide
hydrochloride (EDC, Mw= 191.7 g/mol), horseradish peroxidase, 3,5-dicloro-2-hydroxibenzeno sulphuric salt (Mw=265.05 g/mol), protamine sulfate salt from salmon, trifluoroacetic acid (TFA) and acetonitrile (ACN) HPLC grade were obtained from Sigma-Aldrich. H2O2 (30%) and 4-aminopyrine (Mw=203.24 g/mol) were obtained from Fluka
Preparation and evaluation of an insulin delivery system sensitive to hyperglycaemia
3.Methods
1. PLGA nanoparticles formulation
1.1.Loaded PLGA nanoparticles
1.1.1.Catalase-loaded PLGA nanoparticles
PLGA nanoparticles (A-D) were prepared as described on table 3-1 by a W/O/W double emulsion method. A 2.5 mg/mL catalase solution (dissolved without agitation) and 5 mg/mL PLGA in DCM was emulsified using a sonicator (Branson 450D, with a 25-500 mL tip) for 10 seconds in an ice bath (20% amplitude). The primary emulsion was then added to 60 mL of 2% PVA solution. PVA solution was prepared by a slow addition into water while stirring on a magnetic stir plate. Temperature of the PVA solution was raised to 85–95°C to completely dissolve PVA, after which it was cooled down to room temperature. The second emulsion was emulsified for 1 minute in an ice bath using a sonicator (20% amplitude) to produce the W/O/W emulsion. In order to evaporate DCM the double emulsion was gently stirred overnight at room temperature. To remove large microparticles and aggregates, the emulsion was centrifuged for 15 minutes at 82.3xg (Eppendorf 5810R). The supernatant was also centrifuged at 12800xg for 40 minutes and washed twice with MilliQ water to remove PVA residues and unloaded protein. The obtained nanoparticles were suspended in 10 mM phosphate buffer (pH 7.0).


![Figure 3.5 H 2 O 2 standard curve used to quantify H2O2 production measured at 520 nm y = 0,0161x + 0,0934R² = 0,997300,61,21,8020406080 100Abs[H2O2] (µM)](https://thumb-eu.123doks.com/thumbv2/123dok_br/15453558.1028286/53.892.159.688.767.1079/figure-standard-curve-used-quantify-production-measured-abs.webp)