UNIVERSIDADE DE LISBOA FACULDADE DE CIÊNCIAS
DEPARTAMENTO DE BIOLOGIA ANIMAL
OPTOGENETIC INVESTIGATION OF STRIATAL CELL
TYPE DURING TIMING BEHAVIOR
SOFIA LIMA DA SILVA SOARES
MESTRADO EM BIOLOGIA HUMANA E AMBIENTE
UNIVERSIDADE DE LISBOA FACULDADE DE CIÊNCIAS
DEPARTAMENTO DE BIOLOGIA ANIMAL
OPTOGENETIC INVESTIGATION OF STRIATAL CELL
TYPE DURING TIMING BEHAVIOR
SOFIA LIMA DA SILVA SOARES
MESTRADO EM BIOLOGIA HUMANA E AMBIENTE
DISSERTAÇÃO ORIENTADA POR:
PROFESSOR DOUTOR JOSEPH PATON (Fundação Champalimaud) PROFESSOR DOUTOR PAULO FONSECA (FCUL)
3
Index
Index ... 3 Abreviations ... 5 Acknowledgements ... 7 Resumo ... 9 Palavras-chave ...12 Abstract...13 Keywords ...13 Introduction ...15Time and timing scales ...15
Interval timing ...15
Neurobiological systems involved in timing ...19
Basal ganglia organization ...20
Anatomy and histochemistry of striatal neurons ...22
Optogenetics ...25
Materials and Methods ...29
Subjects ...29
Apparatus...29
Behavioral Procedures ...30
Data analysis ...33
Viral construction and production ...35
Viral injection ...35
Histology ...36
Results ...38
Behavior during the SFI task ...38
Preliminary results on ChR2 expression ...44
Discussion ...48
5
Abreviations
AAV – Adeno-associated virus ATR – All-trans retinal
BeT - Behavioral theory of timing BG – Basal ganglia
BP – Band pass
ChAT – Choline acetyltransferase ChR2 – Channelrhodopsin-2 CPu – Caudate-putamen
Cre – Cyclization-recombination enzyme CRF – Continuous reinforcement schedule D1 – Dopamine type 1 (receptor)
D2– Dopamine type 2 (receptor)
DA – Dopamine
DIC – Differential interference contrast
DIO – Double-floxed inverted open reading frame DNA – Deoxyribonucleic acid
EF-1α – Human elongation factor-1α EI – Experienced interval
FI – Fixed interval FS – Fast spiking
GABA – γ- aminobutyric acid GP – Globus pallidus
GPe – Globus pallidus external GPi – Globus pallidus internal
G-proteins – Guanine nucleotide-binding-proteins HD – Huntington’s disease
HFT – Main dichroic beam splitter IRI – Inter response interval ITR – Inverted terminal repeat LeT – Learning-to-time
L-dopa – L-3,4-dihydroxyphenylalanine LoxP – Locus of X-over P1
LP – Long pass
LTS – Low-threshold spiking MSNs – Medium spiny neurons ORF – Open reading frame PBS – Phosphate buffered saline PD – Parkinson’s disease
PFA – Paraformaldehyde PI – Peak interval
6
PRP – Post-reinforcement pause PV – Parvalbumin
SBF – Striatal beat-frequency SET – Scalar expectancy theory SFI – Serial fixed interval
SN – Substantia nigra
SNc – Substantia nigra pars compacta SNr – Substantia nigra pars reticulata STN – Subthalamic nucleus
TANs – Tonically active neurons TTL – Transistor–transistor logic YFP – Yellow fluorescent protein
7
Acknowledgements
To Joe Paton, thank you for the great advice and guidance, without which this work would not exist.
To Gustavo Mello, thank you for the help, patience and company in many endless days of work. To João Gaspar, thank you for your support in the good and bad moments.
9
Resumo
Para conseguirem sobreviver num ambiente em constante mudança, é essencial que os animais consigam prever o desfecho de um determinado evento e/ou desenvolver comportamentos antecipadamente, no caso de esse mesmo evento voltar a acontecer. A cronometragem é um dos processos implicados nestes e noutros contextos de aprendizagem, já que confere ao organismo a capacidade de medir a duração do tempo entre eventos numa escala de segundos a minutos a horas.
Embora muitos modelos teóricos tenham sido desenvolvidos na tentativa de explicar a forma como o nosso cérebro codifica informação temporal, poucos são aqueles que tentam explicar a forma como os estímulos exteriores são integrados, o papel de diferentes tipos celulares nessa integração e ainda a influência do estado das redes neuronais no momento de integração. Apesar da sua extrema importância, o nosso conhecimento sobre como o cérebro representa a passagem do tempo é ainda muito limitado, parcialmente devido à falta de paradigmas comportamentais que acomodem electrofisiologia e também devido à incapacidade de identificar tipos neuronais específicos recorrendo a técnicas clássicas de electrofisiolofia extra-celular. Em relação à cronometragem, diversos estudos indicam que os gânglios da base desempenham um papel fundamental no processamento de informação temporal. Anomalias no circuito dos gânglios da base estão intimamente ligados a doenças severas como a doença de Parkinson, doença de Huntington ou esquizofrenia, cujos pacientes demonstram incapacidades não só a nível motor, mas também na performance de tarefas de cronometragem. No entanto, as áreas envolvidas nestes processos, como é o caso do corpo estriado, possuem uma grande heterogeneidade a nível neuronal, tornando ainda mais complexo o estudo do papel de cada tipo de neurónio na representação temporal.
Existem pelo menos dois tipos de neurónios de projecção (MSNs) e quatro tipos de interneurónios no corpo estriado, e cada um deste tipo de células poderá desempenhar papeis distintos durante o processamento de informação temporal. Sabe-se que cada tipo de MSNs expressam predominantemente receptores para a dopamina do tipo 1 (D1) ou do tipo 2 (D2), formando subpopulaçoes de neurónios D1MSN ou D2MSN distribuídas no estriado. Sabe-se que os receptores D1 e D2 produzem efeitos antagónicos em cascadas intra-celulares, quando ligados à dopamina. Existem ainda estudos que sugerem um papel importante do receptor D2 na capacidade de estimar intervalos de tempo. O desenvolvimento de linhas de ratinhos transgénicas torna a utilização deste modelo animal muito apelativa neste prisma, já que pode facilitar o desenvolvimento de técnicas para identificação in vivo destes diferentes tipos de
10
neurónios. No entanto, a real aplicabilidade destes animais a paradigmas comportamentais dinâmicos e complexos é questionada.
Pretende-se com este trabalho treinar ratinhos numa tarefa de cronometragem que acomode electrofisiologia, mas que seja mais dinâmica do que as tarefas clássicas utilizadas nesta área actualmente. Paralelamente, esperamos conseguir isolar diferentes tipos neuronais no corpo estriado de forma a que, a longo prazo, seja possível distinguir o tipo de célula cuja informação está a ser gravada durante experiências de electrofisiologia.
Treinámos ratinhos numa nova tarefa de cronometragem altamente dinâmica chamada Serial Fixed Interval (SFI). Esta tarefa foi desenvolvida no nosso laboratório, baseada num paradigma clássico no estudo de cronometragem, denominado Fixed Interval (FI) schedule. O equipamento da tarefa SFI é bastante simples, consistindo apenas numa alavanca de metal e um orifício por onde a recompensa (uma gota de água com açúcar) é entregue. Durante o período de treino e teste na tarefa SFI, os ratinhos são privados de água e estimam diferentes intervalos de tempo, tendo apenas a última recompensa como referência para estimarem a entrega da próxima recompensa. Após a entrega de uma recompensa, os ratinhos passam um determinado intervalo fixo (FI) de tempo sem terem a possibilidade de receber qualquer gota de água com açúcar, mesmo que pressionem a alavanca de metal. Após este intervalo fixo terminar, os animais têm 15 segundos durante os quais a primeira resposta na alavanca produz uma recompensa e o FI de espera repete-se. Após pelo menos 25 repetições do mesmo FI, que representa um bloco de tentativas, selecciona-se aleatoriamente uma nova duração, e durante uma sessão de duas horas são estimados vários blocos com intervalos de tempo diferentes.
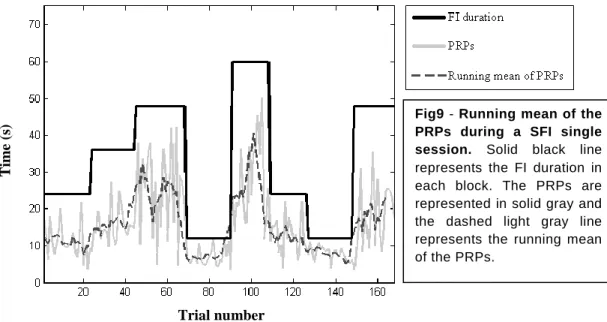
Durante o decorrer da tarefa, os ratinhos desenvolveram um padrão de resposta que indica que estes animais estão a estimar intervalos de tempo. Depois de receberem uma recompensa, os ratinhos esperam um determinado intervalo de tempo antes de voltarem a pressionar a alavanca para tentar receber uma nova recompensa, e a esta latência para responder novamente chamamos PRP. Este padrão de respostas dos ratinhos é sensível à passagem do tempo, já que observamos que os PRPs variam no mesmo sentido da variação do FI entre cada bloco. Mais especificamente, obtivemos correlações significativas entre as PRPs e o intervalo anterior experimentado pelo animal, quer em sessões individuais (R2 = 0.45809, valor P < 0.001) quer na análise de toda a população (R2 = 0.7813, valor P < 0.001). Adicionalmente, a frequência com que os animais pressionam a alavanca desenvolve-se progressivamente mais lentamente quanto maior for o FI a ser estimado. Este perfil de resposta
11
foi acompanhado por rápidas curvas de aprendizagem, quer se tratasse da aprendizagem entre a passagem de um intervalo curto para um longo ou o inverso.Paralelamente, começámos por tentar identificar dois tipos de neurónios do corpo estriado: os neurónios de projecção D2MSNs e um tipo de interneurónios que expressam parvalbumina (PV). Para isso, usamos duas linhas de ratinhos transgénicos: uma que expressa a enzima Cre recombinase (Cre) sob o controlo do promotor para o receptor D2 (linha D2-Cre); e outra que expressa Cre sob o controlo do promotor para a PV (linha PV-Cre). Estas linhas de ratinhos trangénicos foram sujeitas a micro-injecções de um virus adeno-associado (AAV) contendo um gene de fusão que codifica um canal iónico activado por luz, a channelrhodopsin-2 (ChRchannelrhodopsin-2), ligado a uma yellow fluorescent protein (YFP). Como a expressão de ChRchannelrhodopsin-2-YFP é dependente de dupla recombinação pela enzima Cre e as duas linhas de ratinhos transgénicos expressam Cre sob o controlo de dois promotores distintos, a acção do sistema cre-lox permite-nos expressar ChR2-YFP nestes dois tipos específicos de neurónios do corpo estriado. Através de técnicas de histoquímica, marcamos ainda os núcleos (no caso da linha D2-Cre) e corpos celulares (no caso da linha PV-Cre) destes neurónios para uma melhor análise anatómica. Observamos que em cada linha transgénica estudada (D2-Cre e PV-Cre), os tipos de neurónios identificados possuem as características morfológicas de neurónios D2MSNs ou de interneurónios PV, respectivamente. Observamos ainda a existência de pequenas inclusões fluorescentes presentes praticamente em todas as áreas onde existem células infectadas por virus. Algumas alternativas foram já pensadas de forma a evitar esta observação que parece ser um sinal de expressão elevada da proteína de fusão. Serão necessárias futuras experiências para avaliar até que ponto estas inclusões alteram a as propriedades electrofisiológicas das células, assim como o efeito a expressão de ChR2-YFP por si só.
Com este trabalho, demos um passo importante para conseguirmos no futuro isolar subpopulações de neurónios e identifica-los durante gravações electrofisiológicas. Neurónios que expressem ChR2 serão identificados electrofisiolgicamente recorrendo à técnica PINP (Photostimulation-assisted Identification of Neuronal Populations): uma vez estimulados com luz azul, a activação ChR2 causará uma despolarização da membrana do neurónio, e este produzirá um potencial de acção. Este efeito tornará possível identificar estes neurónios por técnicas extra-celulares de electrofisiolgia enquanto os animais são testados na tarefa de SFI. Desta forma, poderemos estudar que tipo neuronal codifica que tipo de informação durante o processo de cronometragem. Esta informação poderá aprofundar o nosso conhecimento sobre os circuitos neuronais que estão na base deste processo fundamental. A compreensão da forma como integramos e processamos informação temporal poderá ainda ter enormes
12
vantagens no estudo de doenças neuro-degenerativas como as doenças de Parkinson e Huntington.
Palavras-chave: Cronometragem; interval fixo; gânglios da base; corpo estriado; ratinhos
13
Abstract
The ability to time intervals in the range of seconds-to-minutes-to-hours, (interval timing) is a fundamental aspect of learning and behavior. Although many theoretical models have set out to address how the brain may process temporal information, little is known about the neural mechanisms that underlie this fundamental ability. Many studies indicate that the basal ganglia (BG) is the brain structure most involved in interval timing, but we still don’t know how the BG might process and encode duration information. Neurophysiological recording from single cells in a situation where a subject must access learned duration information provides a powerful tool to investigate interval timing mechanisms. However, information about neural cell type and connectivity within BG networks will ultimately be necessary to understand how timing information is computed, stored, and read out to guide behavior. We want to train transgenic mice in a dynamic paradigm and try to identify which signals are carried by which cell types during timing behavior. To achieve this, we trained mice in a new dynamic schedule, the Serial Fixed Interval (SFI) task. Animals showed a reliable response pattern that co-varied with the time duration being sampled and learned to adjust their response time rapidly in response to interval changes.
To ultimately identify recorded cell type during the SFI task, we used channelrhodopsin-2 to label two subpopulations of striatal neurons. We used adeno-associated virus to deliver channelrhodopsin-2 in to the striatum of two transgenic mouse lines in which the expression of the enzyme Cre was driven either by the parvalbumin promoter or by the dopamine type-2 receptor promoter.
Together, these results suggest that transgenic mice can be used in a highly dynamic timing paradigm, and that we may identify recorded cell types during such behavior, providing a powerful opportunity to study the neuronal circuit mechanisms of interval timing.
Keywords: Interval timing; serial fixed interval; basal ganglia; striatum; transgenic Cre mice;
15
Introduction
Time and timing scales
Time is essential for innumerous daily life activities, like walking, speaking, playing music and learning. Such activities are possible because during our evolutionary history, we, like many organisms, have developed systems to deal with an environment where somewhat consistent variation of events across time is present, and producing behavior in such a manner is adaptive. This variation can occur at different scales. For example, the circadian rhythms are an adaptation to the regularity of days, interval timing for events within those days, and millisecond timing for proper perception and motor production. The mechanisms underlying circadian rhythms are perhaps the best understood of these three classes of timing. They operate roughly over the range of the 24-h light–dark cycle controlling the sleep-awake cycle, as well as metabolic and reproductive fitness1,2. Millisecond timing is required for proper motor control, for generating and recognizing speech, or even for activities like dancing and playing music 3,4. Interval timing operates on a scale from seconds-to-minutes-to-hours and is involved in foraging, decision making and learning5,6. We are surrounded by an environment in constant change, where important events can happen in regular intervals or at a predictable delay from other events. Having the ability to learn this regularity presents a great advantage and allows us to predict certain outcomes given a specific situation and develop anticipatory behaviors to prepare ourselves for the next time that a certain event will happen7. For example, an animal in the jungle may have to wait still in a hidden place, for a certain amount of time, until predators are likely to have left an area before seeking out a food or water source. Therefore, interval timing allows a wide range of species to estimate short intervals of time which are essential for their survival.
Interval timing
Interval timing, defined as the perception, estimation and discrimination of durations in the range of seconds to minutes to hours, has been verified in organisms as diverse as insects8, birds9, fish10, rodents11, primates12, human infant13 and adults14. Traditionally, three types of behavioral protocols have been applied in the field of interval timing. These can be based on the estimation, production or reproduction of intervals of time. Both estimation and production protocols rely on verbal instructions, requiring the subject to convert the verbal representation of time durations into a performance of that representation. Because these protocols can lead to
16
confounds, using a reproduction procedure is a more reliable approach, and it can be applied to a wide variety of animal species, from humans to rodents14,15. In a reproduction type behavioral protocol, the subject is presented with a given criterion duration and is then required to reproduce this duration. Usually, animals are deprived of either food or water, they are given a lever or a button to press and they are reinforced for that response (i.e. they receive a small amount of either food or liquid).
One of the most common schedules used to study interval timing is the Fixed Interval (FI) Schedule of Reinforcement. In this schedule, the first response of the subject after some FI of time since the last reinforcement has elapsed is reinforced. During that FI, no response is reinforced. Ferster and Skinner16 described that animals performing the FI schedule behaved in a characteristic sequential manner. First, just after receiving the reinforcer, animals stop responding and start engaging in self grooming or exploratory behaviors. Second, the animal’s position and behavior are gradually oriented towards the response site. Finally, as the FI elapses, the animal’s rate of response increases gradually and reaches the maximum near the moment when the reinforcer will be available again. Additionally, the three steps described above have different durations that are proportional to the duration of the FI.
Another classical schedule used to study interval timing is the Peak procedure17, also known as the Peak Interval (PI) task. It is a modification of the FI schedule, where trials identical to those of the FI schedule are shuffled with a small percentage of so called probe trials. In these probe trials, no reward is presented to the animals, no matter when they respond. In the PI task, only probe trials are selected for data analysis. The subject’s response profile in probe trials follows a normal distribution around the estimated FI and the width of this response distribution is proportional to the FI. Also, the manner in which both the mean and standard deviation of the response distribution co-vary is usually referred to as the scalar property, because the variability of timing performance scales proportionally to the interval being timed14. It implies that, for example, one can estimate more precisely a 4 second interval than a 14 second interval. This property resembles Weber’s Law, which is obeyed by many sensory dimensions18. Weber’s Law states that the relative increase in a stimulus needed to produce a noticeable difference is constant.
This scalar property of interval timing affects the system in such a way that it becomes increasingly less precise as the interval being timed lengthens and it applies not only to behavioral responses but also to neural activation19.
Several models have been developed over the years, aiming to provide a possible explanation for the mechanisms by which the brain processes timed information. One of the
17
most popular views on interval timing in animals is the pacemaker-accumulator model, also called Scalar expectancy theory (SET)18. This information-processing model is based on an internal clock model20 and proposes the existence of a Poisson-variable pacemaker that regularly emits pulses, which are temporarily stored in an accumulator. By the time of reward, the number of pulses present in the accumulator is stored in reference memory. The behavioral response results from the comparison of the ratio between the current time estimation, which is stored in the accumulator, and a sample selected from the distribution of previously estimated durations, which are represented as the number of pulses from previous reinforced readings stored in reference memory. This model presents an explanation for the scalar property of interval timing, since it suggests that the error generated during the accumulation of pulses is proportional to the criterion duration.A second model, the Behavioral theory of timing (BeT), was developed by Killeen and Fetterman21, based on the idea that reinforcement generates collateral behaviors that can be interpreted as a sequence of behaviors. BeT is a behavioral model that retains some aspects of SET, like the existence of a Poisson-variable pacemaker, but it proposes that behavior itself may serve as a signal for the passage of time, possibly mediating time discrimination. BeT suggests that each behavior is associated with a particular underlying state and that the transitions between one state to the next occur thanks to pulses that a Poisson-variable pacemaker produces. The speed of this pacemaker depends on the rate of reinforcement in a given experimental context, so that increases in reinforcement rate lead to an increase of the speed of the pacemaker.
Using BeT as a basis, Machado22 developed another behavioral model which he called Learning-to-time (LeT). His model consists of three major components: a sequential chain of behavioral states (similar to BeT), a vector of associative links connecting the behavioral states to the operant responses, and the actual operant responses. LeT hypothesizes that when the criterion duration starts, only the first behavioral state is active, but with the passage of time, the activation shifts from the previous to the next behavioral state in the sequence. Additionally, LeT proposes that each behavioral state is paired with the operant responses, and that the level of pairing varies during training, decreasing during extinction and increasing during reinforcement. Therefore, the strength of an operant response at a given moment is a result of the combination between which state is predominantly active at that moment and how strong is the association between that state and the response.
More recently, another model was developed, proposing that activity from loops involving the thalamus, cortex and striatum could be involved in timing. This new model was developed
18
taking the Striatal beat-frequency (SBF) computational model23 as a reference, but it was slightly modified and proposes specific roles for certain brain areas, trying to build a more biologically plausible model. This SBF based model suggests that some oscillatory cortical neurons can cause simultaneous activation of striatal projection neurons in the basal ganglia24. During a timing task, these striatal projection neurons would constantly compare the current pattern of activation of cortical neurons with the pattern present when reward is collected. The SBF based model suggests that dopamine plays a role in synchronizing these oscillatory cortical neurons at the onset of a trial as well as maintaining them at a fixed frequency of oscillation throughout the criterion interval. This hypothesis relies on biological observations such as that dopaminergic projections to the striatum are active in different ways during a timing task. At trial onset, they discharge a burst response, show a sustained activity during the criterion interval and display another burst response at the time when reward was expected25. Interestingly, the scalar property of interval timing was demonstrated in simulations using the modified SBF model24.
The models previously mentioned focus on greater extent on the integration of external stimuli. But, within complex neuronal networks, the response of a population of neurons may be determined both by the characteristics of the input stimuli and by the internal state of the network26. For example, a neuron can respond to a tone as a result of its specific frequency but also because of the strength of each of its synapses at that moment (which vary on a rapid timescale) or also because that neuron may be receiving additional internally generated excitatory and inhibitory inputs at the same time. Attempting to account for a role of the characteristics of external stimuli and also of the internal states during information processing within neural circuits, a new model has been developed. The State-dependent model was developed based mainly on cortical networks and accounts for both theoretical and experimental studies27,28. It suggests that both spatial and temporal information are processed taking into account the features of the incoming stimuli and the internal dynamic state of the neural network. This internal dynamic state can be divided in two components. The first component, called “active state”, comprises the ongoing pattern of activity in the network. The second component, known as the “hidden state”, includes the collection of time-dependent properties that are affected by prior activity and that can have an effect on whether, after receiving some input, a neuron fires or not (e.g. short- and long-term synaptic plasticity29,30). Therefore, the real internal state is created by combining the active and the hidden states, since both can influence the response of a local cortical network to a stimulus.
19
Regarding timing, state-dependent models predict that, for example, when two short tones are presented with a certain interval between each presentation, this inter tone interval can be encoded in the response of the network to the second tone presentation27. A few studies in cortical areas, cerebellum as well as in the hippocampus have tested predictions that arise from State-dependent models. For example, in the cerebellum, the pattern of response of granule cell populations to a constant stimulus may depend on the stimulus features but also on the current state of the connections within that cerebellar network31,32.Data from our lab (personal communication) indicates that, during a Serial Fixed Interval (SFI) task, striatal cells are active at different times over tens of seconds, when their response profiles are aligned on reward delivery. Such a response profile could be helpful to encode time information, and is consistent with the predictions of State-dependent or SBF models, but not with the predictions of a pacemaker-accumulator model.
Neurobiological systems involved in timing
Many efforts have been made in the last decades in order to expand our understanding of the neurobiological systems that are involved in timing, and many brain areas have been implicated in these distinct timing systems. Regarding interval timing, researchers have been studying the basal ganglia (BG) and cerebellum, because there is evidence that these brain areas are involved in the integration of timed information. BG have been associated with interval timing24, and the cerebellum has been charged with millisecond timing33,34. This general attribution rises from studies that suggest that interval timing depends on the intact striatum35-37, combined with studies where cerebellar lesions failed to affect performance on interval timing tasks38. For example, a 1996 study showed that cerebellar lesions in rats led to an impaired performance during a duration discrimination task, when the stimulus range was centered at 500 ms, but did not affect performance when the range was centered at 30 sec 39. Also, because cerebellar injury fails to affect the scalar property of interval timing, it is presumed that the cerebellum is not fundamental for appropriate interval timing40. Imaging studies also point to the BG as one of the players in timing behavior, together mainly with cortical areas. Jueptner and colleagues 41 reported regional cerebral blood flow increases in the BG during a timing task, using positron emission tomography. Additionally, studies using ensemble recording techniques in animals or functional magnetic resonance imaging in humans, have also suggested a role for the BG during timing behavior42-44.
Furthermore, patients with disorders that involve meso-striatal dopaminergic pathways, such as Parkinson’s disease (PD)35,36 Huntington’s disease (HD)45 and schizophrenia46-48,
20
display impaired performances during an interval timing task. Patients performance is improved by L-dopa (L-3,4-dihydroxyphenylalanine) medication or by stimulation of the subthalamic nucleus, two standard treatments to alleviate PD symptoms. In PD, degeneration of the nigrostriatal dopaminergic projections occurs. This leads to low levels of dopamine (DA) in the striatum and the patient’s interval timing abilities are impaired in a variety of ways35,36. Patients with PD, when performing a task where they had to time two different durations without medication during the training process, tend to overestimate both intervals. On the contrary, when the testing phase occurs without medication, the two remembered time intervals are estimated in such a way that overestimation of the shorter and underestimation of the longer one occurs. Also, the patient’s distributions of timed responses display the scalar property when medicated with L-dopa, but not when tested without medication.
DA is a major neuromodulatorthe activity of the projection neurons in the striatum49,50,51. A specific type of DA receptor expressed in striatal neurons, the D2 receptor, has been the target of many studies regarding its role on striatal modulation during interval timing. Meck52 assessed the effects of several D2 receptor antagonists on rats performing an interval timing task and found that the dose of the drug needed to impair interval timing ability was negatively correlated with the drugs affinity for the D2 receptor. Additionally, studies using a transgenic mouse line that selectively overexpresses the D2 receptor in striatal neurons suggest that striatal D2 overexpression impairs interval timing mainly by decreasing the animal’s motivation 7, 8 and by its impact on working memory and/or sustained attention. Together, these results suggest an important role for striatal D2 receptor signaling in interval timing.
Although BG and the dopaminergic system seem to be major players in interval timing behavior, we still don’t know how the signals that are carried by neurons in the BG network processes temporal information to support the broad range of animals’ timing behavior. We propose to add a new layer of information on this subject, which is largely unavailable to neurophysiologists until now. Specifically, we aim to answer the question: what signals are encoded by which cell type during timing behavior?
Basal ganglia organization
The BG are a group of nuclei that are profoundly important clinically. Lesions of different cellular components of the BG lead to devastating neurological disorders including PD and HD55, and BG dysfunction is associated with a range of neuropsychiatric disorders such as schizophrenia22 or obsessive-compulsive disorder23.
21
Fig1 – Sagital diagram of input and output nuclei within basal ganglia in rodents. Striatum, that in
rodents is comprised of CPu (caudate-putament) and nucleus accumbens, is the main input nucleus of the striatum, receiving information from most cortical areas. The internal segment of the globus pallidus (GPi) and substantia nigra pars reticulata (SNr) are the main output nuclei of the basal ganglia. Figure adapted from58.
The position of the BG in the circuitry of the brain gives a clue to their numerous functions. The BG occupy the center of the forebrain and it is composed by evolutionarily conserved motor nuclei that form loops with areas such as the cerebral cortex, thalamus and brainstem. Therefore, they are in a prime position to influence motor planning and even cognitive behaviors. A general canonical organization of the BG consists of four structures: the striatum, the globus pallidus (GP), the subthalamic nucleus (STN) and the substantia nigra (SN)58.
The striatum is the main input structure of the BG (Fig1). In primates, the striatum is divided in caudate nucleus, putamen and ventral striatum. However, in rodents, the caudate nucleus and the putamen are fused in one structure often denominated CPu (caudate-putamen) and the ventral striatum is denoted as the nucleus accumbens.
The GP (divided in an external and an internal segment, GPe and GPi, respectively) is the site of therapeutic lesions (pallidotomy) and deep-brain stimulation procedures that were historically used to alleviate PD symptoms.
The SN is subdivided in two regions (pars compacta and pars reticulata, SNc and SNr, respectively) and it is a critical nucleus to BG function. DA-synthesizing neurons in the SNc degenerate in PD, and SNr, together with the GPi, represent the major output nuclei of the BG (Fig1). Finally, the STN is a key structure controlling GP function, and is now a favored site for deep-brain stimulation in the treatment of PD.
Glutamatergic layer 5 neurons from nearly all areas of the cortex project to the BG, which in turn provide output to brain systems that are involved in the generation of behaviors (e.g. output nuclei in the basal ganglia project to thalamic nuclei that in turn send inputs to frontal cortical areas involved in the planning and execution of movement; midbrain areas like the superior colliculus, which is involved in the generation of eye movements and orienting responses). It is hypothesized that BG receives inputs from these areas and acts as a filter, selecting activity and sending the result of its selection back to other brains systems. It is further thought that
22
reinforcement based plasticity occurs in the BG, and that this plasticity may somehow influence the input selection process based on previous experience58.
In a classic view, information from the striatum can travel through the nuclei of the BG by two different parallel circuits, the direct and the indirect pathways (Fig2). Neurons within the striatum can project directly to the output nuclei of the BG (direct pathway), or instead, they can project to other nuclei in the BG that thereafter indirectly connect the striatum and the output nuclei of the BG (indirect pathway)55.
These signaling pathways are regulated by DA in the striatum, and they have been the subject of intense study since it was discovered that the loss of DA in the BG leads to the psychomotor symptoms of PD59.
Anatomy and histochemistry of striatal neurons
The primary input nucleus of the BG is the striatum. Although generally implicated in control of motor actions, recent studies account for a more numerous subdivision of functions within striatal areas. The dorsal striatum has been implicated in essential aspects of decision-making, sensorimotor, cognitive, and motivational information60-62. Interestingly for interval timing, studies also suggest that neurons within dorsal striatum respond to sensory events related to the task in question, becoming active before task-related motor behaviors and, in addition, they display tonic activity until the time when reward was expected to be delivered63,64.
The striatum is the largest nucleus within BG and it completely lacks glutamatergic neuronal cell bodies. Instead, most neurons with cell bodies in the striatum release γ- aminobutyric acid (GABA). Neurons within striatum have been characterized anatomically, histochemically, and physiologically65,66. Regarding their anatomic characteristics, striatal neurons can be either medium spiny projection neurons (MSNs) or aspiny interneurons. MSNs are the principal cell type of the striatum, since they account for more than 95% of striatal
Fig2 – Direct and indirect striatal projection pathways in sagital schemes of rodents. A –
Direct and indirect pathway rise from different poulations of striatal neurons. Direct projecting neurons provide an axon with collateral to the globus pallidus external (GPe) globus pallidus internal (GPi) and substantia nigra pars reticulata (SNr). Indirect projection neurons project to the GPe and are indirectly connected to the GPi and SNr through connections involving GPe and subthalamic nucleus (STN). Figure adapted from58.
23
neurons 67. These GABAergic neurons are the major receiver of extrinsic input and they are the only output neurons of the striatum65,68. Glutamatergic inputs from cortex and thalamus to the MSNs terminate predominantly on dendritic spines69. In addition, the MSNs are a main target of dopaminergic neuron axons from the ventral tegmental area and from the SNc, that form synapses on MSNs dendrites and spine necks70The MSNs can be generally divided into two subpopulations. This division is based on their axonal projection targets, the expression of genes for certain peptides, and the expression of DA receptors. These two subpopulations of MSNs give rise to the two parallel BG circuits, the direct and indirect pathways55. About half of MSNs send projections directly to the output neurons of the BG in the GPi and SNr. For that reason, they are called striatonigral MSNs and give rise to the so called direct pathway of the BG circuitry. The other half of MSNs, also called striatopallidal MSNs, belong to the indirect pathway because they don’t send direct projections to the BG output nuclei. Instead, MSNs from the indirect pathway send their projections to the GPe neurons, which then project to the STN, and then to SNr and GPi. The direct and indirect pathway model of the BG has been the target of many studies, more specifically studies regarding its role on motor control. It has long been thought that excitation of the direct pathway would facilitate movement and activation of the indirect pathway would inhibit movement55,71. Although the validity of this hypothesis has been challenged over the years, a recent study brought strong evidence in favor of this classical model72. In this work, Kravitz and colleagues performed bilateral excitation of striatopallidal MSNs in transgenic mice using optogenetic methods and observed that this protocol induced a parkinsonian state, identified by increased freezing, decreased locomotor initiations and bradykinesia. Conversely, activation of striatonigral MSNs caused a decrease in freezing and an increase in locomotion. Additionally, in a mouse model of PD, activation of the direct pathway rescued the impairments displayed in freezing, bradykinesia and locomotor initiation.
MSNs belonging to either de direct or indirect pathway show selective expression of certain peptides and receptors for DA. Studies using in situ hybridization histochemistry combined with retrograde labeling of striatonigral neurons suggest that striatonigral MSNs express substance P, dynorphin and the DA type 1 (D1) receptor, and therefore are also referred to as D1MSNs. The striatopalidal neurons express enkephalin and the D2 receptor, and for that reason are also known as D2MSNs 73. Although initial studies using RT-PCR claimed that there was considerable co-localization of these DA receptor subtypes, improvements of this technique confirmed this partial division of MSNs74. Within striatonigral and striatopallidal MSNs, there was found a 10%–20% co-localization of D1 and D2 receptor transcripts74. Nonetheless,
24
immunohistochemical studies indicate that the co-localization between D1 and D2 receptors is only about 1%75. This suggests the existence of major posttranscriptional control of the expression of DA receptors in MSNs.
Considerable progress has been made in characterizing the DA receptors in the striatum and the brain in general. Molecular cloning studies have helped to discover at least five DA receptor genes (D1, D2, D3, D4, D5)76-80. These receptors can be further grouped on the basis of their affinities for classical dopaminergic ligands and their coupling to intracellular signaling cascades into D1 (D1, D5) and D2 (D2, D3, D4). Both D1 and D2 receptors couple to adenylate cyclase via G (guanine nucleotide-binding)-proteins. D1 receptors stimulate adenylate cyclase via stimulatory Gs-proteins, whereas D2 receptors inhibit adenylate cyclase via inhibitory Gi -proteins81. Although different cell types express distinct DA receptor subtypes, every cell type within striatum expresses DA receptors.
Anatomically, besides MSNs, there is another category of striatal neurons, the interneurons. They represent about 3-5% of striatal neurons and include cholinergic interneurons and several types of GABA-releasing interneurons82,83. Within striatal neurons, only about 1-2% are cholinergic interneurons84. These neurons are generally characterized by a large soma, often >50µm long and they stain positively for choline acetyltransferase (ChAT). Immunohistochemical analysis suggest that cholinergic interneurons express both D2 and D5 receptors85,86. The GABAergic interneurons seem to express mainly D5 receptors85 and can be divided into at least three groups based on their distinct histochemical and physiological properties82. Histochemically, striatal GABAergic interneurons can be subdivided into: (a) parvalbumin (PV)-positive; (b) somatostatin-, neuropeptide Y-, and nitric oxide synthase-positive; and (c) calretinin-positive83.
Physiologically, these three groups of striatal GABAergic interneurons can be further separated in at least two different types based on the firing patterns that they exhibit82. While PV-positive neurons display rapid and continued firing rates post current injection, somatostatin-positive interneurons display lower firing rates and plateau potentials. Thus, PV-somatostatin-positive neurons are alternatively known as fast spiking (FS) interneurons and somatostatin-positive interneurons are known as low-threshold spiking (LTS) interneurons. Calretinin-positive interneurons appear to share some characteristics of LTS interneurons, but further physiological classification is required to confirm this suggestion87. Although few in number, striatal GABAergic interneurons play a major role in regulating spike timing in the MSNs, mainly through feedforward inhibition87. Like MSNs, striatal interneurons receive glutamatergic input from cortex and thalamus. Conversely, their output is directed primarily to MSNs and other
25
interneurons, thus forming microcircuits capable of modulating striatal output. Therefore, striatal interneurons may produce disproportionately strong effects despite being numerically in minority. As for the physiology of the cholinergic interneurons, they display spontaneous activity under physiological conditions, and therefore are also referred to as tonically active neurons (TANs). They exhibit significant hyperpolarization-activated currents, but they display a pause in their tonic firing in the presence of salient cues, including reward88,89.Though the basic physiology of striatal cell types has been characterized, a more detailed description of these neurons has been difficult. To distinguish striatonigral and striatopallidal MSNs in vitro without recurring to post hoc analysis has been an unsuccessful attempt, since they share most anatomical and electrophysiological features. In contrast, striatal interneurons are more easily identifiable during electrophysiological recordings82. Despite this, to target interneurons for electrophysiology is also challenging, since they represent a very small portion of the total number of striatal neurons and they are similar to MSNs under the light microscope.
Although researchers have developed new methods to visualize distinct neuron types, within striatum, for cellular and synaptic electrophysiology90, these provide advances mainly for isolation of these different neuronal types in vitro. Because we are interested in understanding which signals are carried by each striatal neuronal type during interval timing behavior, we want to be able to distinguish these different subpopulations for electrophysiological recordings in vivo, while mice perform an interval timing task.
Optogenetics
Using classical extracellular recording techniques, it appears possible to distinguish just two general populations of striatal neurons. Berke and colleagues91 recorded from striatal neurons in freely moving rats and found that, although the majority of units recorded were probably MSNs based on their firing pattern, a second neuronal population displayed characteristic that were attributed to fast-spiking GABAergic interneurons. These include tonic activity, brief waveforms, and high-frequency bursts. Despite these advances, we cannot yet electrophysiologically distinguish between the two types of MSNs and between all the interneuron types in the striatum. These different neuronal subpopulations may play different roles during timing behavior. Isolating each neuronal type within striatum in behaving animals would lead to a deeper understanding of the BG circuitry and also of the signals that are carried by components of that circuitry. But because of the heterogeneity within striatal neurons (and within whole brain), resolving the role of particular neuron types in information processing poses fundamental challenges. Therefore, a noninvasive genetically based method, with a high
26
temporal resolution, to control neural activity may elucidate the spatial and temporal of activity encoded by particular neuronal populations that drive circuit dynamics and behavior.
Optogenetics may be the way to achieve the selectivity that classical extracellular recording techniques fail to provide. Optogenetics is a recent term that is used to describe an approach of using new optical methods, which operate at a high temporal resolution, for probing and controlling neurons that are genetically targeted within intact neural circuits92. The introduction of optogenetics allows researchers to control not only electrical properties within targeted cell types, but also biochemical events, and all of this can be done in living, freely moving animals. Several of the methods that have been developed allow control of neuronal activity over timescales of seconds to minutes93,94. Although this presents an advantage, a method with a higher temporal resolution would be required in order to enable control of individual spikes. Such a strategy was developed in 200595 and it uses a light-activated cation channel called channelrhodopsin-2 (ChR2)96 derived from the alga Chlamydomonas reinhardtii. ChR2 is a protein constituted by seven-transmembrane domains and an all-trans retinal (ATR) molecule located at the core, functioning as a photosensor96. When illuminated with ~470 nm blue light, the ATR molecule undergoes isomerization and this event triggers a conformational change that ultimately leads to the opening of the channel’s pore. Following just 50 µs of illumination, ChR2 allows a depolarizing current to be evoked, and therefore neurons can be activated at the temporal precision of a single action potential97. Moreover, engineered ChR2 fusions with several classes of fluorescent proteins have been expressed in both isolated neurons95 as well as in neural circuits97.
While optogenetics has been widely used as a way to control neuronal activity, investigators have also been trying to employ it in the identification of different neuronal populations in vivo. In a recent study, Lima and colleagues98 developed a method of labeling neurons to be further identified during in vivo electrophysiological recording, called PINP (Photostimulation-assisted Identification of Neuronal Populations). Following expression of ChR2 in restricted neuronal subpopulations, neurons labeled with ChR2 can then be detected electrophysiologically in vivo, because when illuminating a certain brain region with a short flash of blue light, neurons expressing ChR2 at their membrane will fire a short latency reliable action potential (Fig3B). Consequently, that specific group of neurons is distinguishable for electrophysiological recordings, and one can then study which signals are carried by that ChR2-tagged neuron. PINP was applied in mouse cortical FS interneurons and in excitatory neurons in the rat auditory cortex. ChR2 delivery was achieved by using, respectively, adeno-associated virus (AAV) and herpes simplex virus 1 for mouse and rat neurons.
27
Our ultimate objective is to train mice on a dynamic timing task and simultaneously record electrophysiologically from striatal neurons. Moreover, we aim to functionally tag striatal neuronal types, in order to identify from which neuron we are performing the recordings (Fig3). This will enable us to analyze which timing signals are carried by each neuronal type. To achieve this, we will selectively express a ChR2-YFP (yellow fluorescent protein) fusion in 4 different types of striatal neurons: D1MSNs, D2MSNs, PV+ interneurons and ChAT+ interneurons. Expression of the fusion gene will be Cre (cyclization-recombination enzyme) dependent and delivered by viral vectors in 4 different transgenic mouse lines, in which Cre expression is driven by a given promoter that provides cellular specificity, therefore restricting ChR2-YFP expression to one of the 4 neuronal types mentioned. We will then use PINP to identify each neuronal type in each mouse line, while they perform the interval timing task (Fig3).?
D2MSN?
D2MSN?
PV interneuron PV interneuronFig3 – Diagram of an example of the method for applying PINP to identify neurons tagged with ChR-2 in a PV-Cre mouse line during timing behavior. A - In a PV-Cre transgenic mouse
implanted with an electrode (grey thin line) and cannula (blue thin line), different units display different response patterns during the timing task. We don’t know which cell types are responsible for each pattern. B – With the introduction of an optic fiber through the cannula (blue thin line), when flashes of blue light (blue thick bars) are sent through the optic fiber, a reliable response from the ChR2-tagged neurons will be recorded. Since ChR2-YFP expression is Cre dependent, and this mouse line only expresses Cre in PV interneurons, we can now assume that a PV interneuron is responsible for that specific pattern of response. C – Now, we identified the single unit tagged with ChR-2 as a PV interneuron and recordings from that single unit can be performed on mice while they perform the SFI task.
28
We predict that in general, different types of striatal neurons will display significant differences in their response profile during a timing task. We think that, because of DA’s antagonist effect on D1MSNs and D2MSNs, the response profile of D1MSNs may tend to increase around the time of reward, and that D2MSNs response profile may tend to decrease to reward. Also, due to the fact that the TANs cholinergic interneurons display a reduction in their tonic activity in response to salient cues like a reward, we think this class of interneurons will display a similar response profile during the SFI task.
29
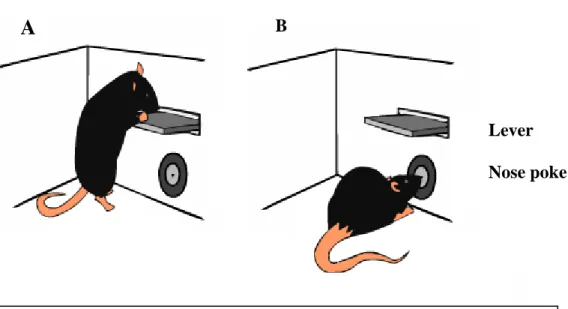
Fig4 – Diagram of the lever and nose poke behavior. A- Illustration of lever press
behavior. B – Illustration of nose poke behavior.
Lever
Nose poke
A
B
Materials and Methods
Subjects
All procedures were carried out in accordance with European Union Directive 86/609/EEC and National Institute of Health guidelines on animal care and experimentation. Eight C57BL/6 male mice (Jackson Laboratory), aged 8-10 weeks were housed 2 per cage and kept under a 12 h light/dark cycle, at 22ºC, relative humidity of 50%. Two lines of transgenic animals (kind gift from Rui Costa) expressing Cre under the promoter for D2 receptor (D2-Cre) or the promoter for PV (PV-Cre) were treated as above, but housed one per cage. Experimental procedures were performed during the light phase of their cycle. Each animal was identified by a system of ear marks and named with different numbers for selection, behavior and data analysis purposes.
Apparatus
Behavior training and testing procedures were performed in a 15 cm*30 cm*36 cm polypropene chamber with a covered ceiling to minimize distraction of the animal inside the chamber.
A lever (MedAssociates, Inc.) and a nose poke (Island Motion, Corp.) were placed in one of the widest walls of the chamber, as illustrated in Fig4. Because the lever was placed above the nose poke, the animal could not press the lever (Fig4A) and introduce its snout in the nose poke (Fig4B) at the same time. This design (and the small dimensions of the chamber) also
30
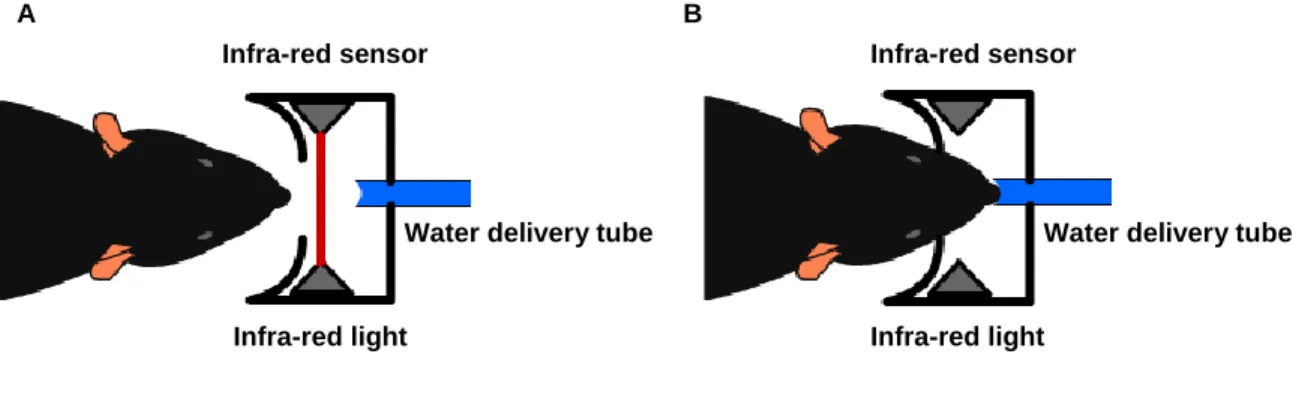
Fig5 – Top view of the nose poke components. It consists of an infra-red light and sensor, placed just before a small tube from where water is delivered. A – View of the nose poke without interruption. B – View of the nose poke with interruption, when the mouse approximates to collect the reinforcement.
Infra-red light
Water delivery tube Infra-red sensor
A B
Infra-red sensor
Water delivery tube Infra-red light
reduced the occurrence of other behaviors.
The nose poke was equipped with a small tube (from where the reinforcer was delivered), an infra-red light and a sensor placed just before the hole, to detect headentries (Fig5). Rubber tubings connected a 1mL receptacle to a valve (Island Motion, Corp.) and the valve to a metal tube that was placed in the nose poke hole.
The majority of the behavioral procedures were automated and did not require an active participation of the experimenter. The Bcontrol Behavioral Control System, developed by BrodyLab at Howard Hughes Medical Institute (Princeton Univeristy), was used to control the inputs (lever presses and headentries) and the output (sucrose 10% (m/v)). This system consists of two computers, one running Lynux Fedora OS with Real Time Linux Machine application and the other running Windows XP OS and MatLab 2007b (MathWorks, Inc.) application with a BControl library. Within the BControl system, each state had a specific relationship between inputs from and outputs to the behavioral chamber.
Behavioral Procedures
Mice were weighed for five consecutive days, while given ad libitum food and water, and their weights were averaged to calculate the baseline body weight. After those five days, water was removed from their home cages and they were given ~1mL of sucrose solution (10% (m/v)) every 24 h until they reached ~87% of their baseline weight. Mice were given 1mL of sucrose solution per day to maintain ~87% of their total body weight, the percentage at which they were maintained for behavioral training and testing in order to promote motivated behavior. The
31
sucrose solution at 10% (m/v) was the standard reinforcer for all the experiments and, since it is isotonic, there was no need to provide another source of water.The training period was divided in 3 steps. First, mice were placed in the behavioral chamber and submitted to a continuous reinforcement schedule (CRF). In the CRF, every time the animal emitted a response, this is, pressed the lever, 3.5µL of sucrose solution were delivered in the nose poke. In this first step, animals were trained for 2 sessions every day. Each session lasted 30 min or until the animal received 100 rewards. Naive mice learned to press the lever by repeatedly reinforcing approximations to the lever, until the actual lever press was achieved. Sometimes, treats were placed over the lever to lure the animal to emit a behavior closer the lever, in order to speed the learning process. Only this first step required an active participation of the experimenter and then automation began. When animals reached 200 rewards in one day, they were moved to the second training step, where the SFI training began. Only few aspects of the SFI changed in between training steps. In all training steps, animals were placed in the behavior chamber and the first lever press was rewarded and initiated the actual task. This means that the animal controlled when the task began. The lever presses that occurred before some FI of time after the last reward were not reinforced (Fig6A). After this FI elapsed, animals had limited time to respond and get a reward, or the trial restarted and a new FI during which there was no possibility to acquire the reward would be presented (Fig6A). This time to respond after the end of the FI was different for each training step. In all SFI sessions, trials were grouped in blocks of at least 25 trials (Fig6B). Each block had a different FI, which was randomly selected from a sequence of 5 intervals (12, 24, 36, 48 and 60 sec). In every training step, after at least 25 trials in a given block elapsed, the script checked if mice completed 80% of the last 15 trials. If mice achieved this precision criterion, the FI changed and a different block started. If not, mice were kept on the same block until they reached the precision criterion. The sessions ended when mice performed 5 block switches or 2 h have elapsed since the beginning of the session.
During the second step of the training period, mice had unlimited time to respond after the FI elapsed.
The third training step was the same as the second one, but now the animal had only 25 sec to respond after the FI elapsed in order to get the reward or the trial was restarted. When the animals performed at least 5 block switches in two consecutive training sessions, the training step moved forward, from second to third step and from third step to the data collection sessions.
32
B
Block n FI 12sec Block 2 FI 60sec Block 1 FI 36secTime until the first lever press
Number
of t
rial
s
Time (sec)
Cue (Previous reward) Fixed Interval (from 12-60 sec)A
Lever Press Lever Press
No Reward Reward
Time to Respond 15 sec
Time (sec)
Fig6 – Illustration of the SFl task structure. A – Diagram of the structure of a single trial. In blue
is represented the reward of the last trial that is used as cue in the actual trial. The FI, represented in white, lasts from 12 to 68 seconds. During this FI, no lever press produces a reward. After t he FI elapses, mice have 15 seconds to press the lever in order to get the reward. Time to respond is represented in green. B – Diagram of a session. First trial, represented in green, does not have a time limit. All the other colors represent the same parameters as described in A. The first lever press in the first trial will produce a reward and random selection of the first FI block of trials takes place. If there is no response during the time to respond, the trial is restarted. The FI changes when the animal reaches certain criteria.
33
During the data collection sessions, animals had 15 sec to respond after the FI elapsed in order to get a reward. Also, animals still had to perform at least 25 trials per block and get at least 80% of the last 15 trials correct to switch blocks. Sessions lasted 2 h and only those in which the animals performed at least 5 block switches were used for data analysis.Data analysis
Sessions in which animals performed at least 5 block switches were selected for data analysis. In this set of data, lever presses were represented by the moment of occurrence in time (milliseconds) since the start of the session. We wanted to perform a trial by trial analysis, and therefore we transformed the absolute times into relative times, by subtracting those lever press times by the trial start time, also in milliseconds. Because mice needed a cue to measure the FI, and this cue was the reward from the previous trial, only data from reinforced trials that were also preceded by a reward were selected for data analysis. In addition, only trials with more than two lever presses were selected for analysis.
We also used a heuristic in order to further select responses from the relative times data set. A heuristic is an experience based method of solving problems, to determine something that cannot be formally proven. In our analysis, we developed a heuristic that comprised two points. First, we ignored lever presses that occurred on the first 2 sec after the reward was available because the immediate responses in the beginning of each trial were, most likely, an effect of high frequency responses from the previous trial. Also, mice always spent more than 2 sec collecting the reward. Second, we observed that mice occasionally pressed the lever in a manner that didn’t seem to reflect the true response. These occasional presses often occurred isolated in time, maybe reflecting an exploratory behavior inside each trial. In order to avoid these isolated lever presses, we measured the inter response interval (IRI), this is, the time between each lever press. This was done by subtracting the time of every lever press from the time of the next one and then removing from the analysis all the lever presses in which the IRI was over the percentile 85.
From the data set filtered with the heuristic, we measured the post reinforcement pause (PRP). The PRP is the time since the start of the trial until the first response of the data set filtered by the heuristic.
For single session analysis, we grouped blocks that had the same FI and calculated the average frequency rate of response within the groups of trials with the same FI. The rate was generated by taking the mean of responses in every 0.5 ms bin and then convolving this set of data with an 11 kernel size Gaussian. This step smoothed the average rates curves but,
34
because artifacts at the edges of the smoothed curves were generated by the convolution, we padded the beginning and the end of our data with vectors with the same size as the kernel. All the elements of the padding vectors had the same value (the first value of the data set for the beginning or the last value of the data set for the end of the curve).
Timing learning curves were generated by calculating Z-scores. These were calculated by taking the PRPs data from the first 15 trials after block switch in each block. PRPs mean and standard deviation were calculated using the distributions of the PRPs in each block, after excluding the first five trials post block switch. We then subtracted this mean from each of the first 15 trials PRPs and divided the result by the standard deviation within each block. We made 3 independent analysis: for all block switches; for shorter FI to longer FI block switches and finally for longer FI to shorter FI block switches.
Correlations between FIs or EIs (experienced interval, meaning, real interval between rewards experienced by the animal) and the PRPs were achieved by performing linear regression analysis. In the case of the single session analysis, we performed linear regressions using either the PRPs and the FI or the PRPs and the EIs.
For the population analysis, data from 91 individual single sessions was filtered as described above and combined in sets of blocks with the same FI size, each belonging to a single session. Then we calculated the PRPs mean for each block belonging to each individual session. We also generated average frequency rate of response in each individual session as described above, but additionally, we also calculated the average frequency rate of response for each block size, in the population. This was done simply by taking the average frequency rate of response from all the single sessions and averaging the data belonging to the same block size.
We also performed linear regression analysis for the population data set in order to look for correlations only between PRPs and EIs. We only used this combination because the EIs were a more realistic measure of the time between rewards experienced by the animal than the FI, and because the difference between the two analysis performed in the single session case was not significant.
Learning curves were generated in a similar way as in the single session analysis, but using a larger data set and averaging the results from the multiples sessions, in the trial by trial calculations of the Z-scores. We also calculated the standard error of the PRPs mean by taking the standard deviation of the mean distribution of PRPs in each session and dividing it by the square root of the sample size.
35
Viral construction and production
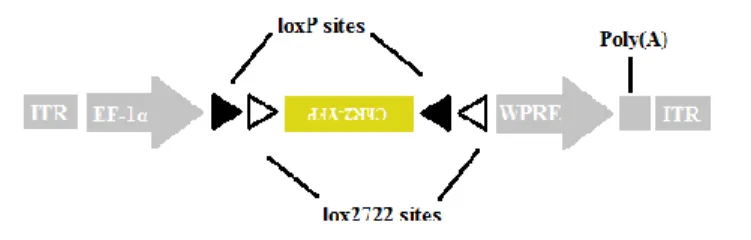
The AAV construct was a kind gift from Karl Deisseroth. It consisted of a ChR2-YFP coding region was originally subcloned from a lentiviral vector into loxP/lox2722-flanked (locus of X-over P1), inverted ORF (open reading frame) AAV plasmid (Fig7). The ChR2-YFP coding region was located downstream of the elongation factor-1α (EF1α) promoter and upstream of the woodchuck hepatitis post-transcriptional regulatory element (WPRE), to enhance expression. Plasmid was verified by sequencing. High-titer stock of AAV-EF1α-DIO (double-floxed inverted open reading frame)-ChR2-YFP-WPRE expressing virus (8x10¹² pfu/mL in PBS - phosphate buffered saline) was produced at the Penn Vector Core (University of Pennsylvania).
Viral injection
For the AAV injections, one PV-Cre mouse and one D2-Cre mouse, both two months old, underwent the same surgery protocol. They were anesthetized with isoflurane in a chamber and then positioned in a stereotaxic apparatus, where they continued under anesthesia through a gas anesthesia mask connected to the head holder section of the stereotaxic equipment (923-B, Kopf). The mouse’s upper front teeth were placed in the head holder and zygoma ear cups (921, Kopf) were positioned and tightened over the animal’s temporal lobes. This was done to make sure that the animal’s head was not moving through the surgery and therefore the injection coordinates could be measured correctly.
The scalp was rubbed with alcohol and then swabbed with iodine/betadine to sterilize. Then, a central incision was made, the skull was mapped stereotaxically for bregma, and two craniotomies approximately 2mm in diameter were drilled bilaterally (0.5 mm anterior-posterior, ± 2.25 mm medial-lateral; all coordinates relative to bregma). The virus (0.5, 0.75 and 1 µL into distinct injection sites) was delivered with a glass micropipette connected to a Nanoject automatic injector (Drummond, Sci. Co.). A pulse generator was connected to the Nanoject and sent one TTL (transistor-transistor logic) pulse every 5 sec, with 1 ms width. Viral injection to the dorsal striatum was achieved by lowering down the micropipette 2.25mm from pial surface.
Fig7 – Scheme of the double-floxed Cre-dependent AAV vector. The double-floxed inverted ChR2–YFP coding region is
flanked by 2 loxP and 2 lox2722 sites, therefore its expression is Cre dependent. The EF-1α (elongation factor-1α) promoter. ITR – inverted terminal repeat. WPRE - woodchuck hepatitis virus post-transcriptional regulatory element.