Equity Crowdfunding
An Empirical Analysis of Funding Momentum
Masters Final assignment in the modality of Internship Report presented to Católica Porto Business School to obtain the Master’s Degree in Finance
by
Ana Rita Monteiro Pinto de Azevedo
Under the orientation ofProf. Luís Pedro Krug Pacheco
Católica Porto Business School April 2018
Acknowledgments
Firstly, I would like to acknowledge my thesis advisor, Prof. Luís Krug Pacheco, to whom I am very grateful for all the help given, the guidance provided and, specially, for always keeping me on the right track, giving me the best insights while demonstrating the most absolute patience.
I would also like to express my gratitude to Prof. Ricardo Ribeiro for all the help provided and for all the availability demonstrated.
To Mikko Kangasaho and Anna Lukkarinen, from the platform Invesdor, I am eternally grateful for sharing with me the data in which I supported this thesis, and for all the comments and insights provided that, without a doubt, led me in the right direction.
I would also like to thank my advisor in Triple A – Capital & Finance, Pedro Xavier, for everything he taught me, for the wonderful work experience he provided and for preparing me, professionally, for the next stage of my life.
To my master’s colleague and friend, Adriana Carvalho, I would like to thank for always being there for me, for all the discussion of ideas that ultimately pushed each other in the right direction and for all the support she gave me throughout the elaboration of this thesis.
To my parents, José Luis and Lúcia Iolanda, words cannot express how much thankful I am for all the support, for all their knowledge and help, for putting up with my bad mood while making me laugh when no one else did, for never giving up on me, for all the effort made so I could study what I liked and wanted, and, specially, for everything they have done for me throughout our entire lives to be able to provide me with everything I needed while being the most loving parents. I hope I can make them proud.
Resumo
A presente tese investiga se as decisões dos investidores têm influência em investidores subsequentes, tomando isto como momentum (embalo) de financiamento. Esta tese apresenta uma análise do comportamento de investidores num contexto de Equity Crowdfunding, utilizando uma amostra de todos os investimentos realizados em 134 campanhas publicadas na plataforma Invesdor, entre 2012 e 2017. Os resultados obtidos indicam que, num ambiente onde o nível de assimetria de informação é substancial, os investidores incorporam as ações tomadas pelos outros nos seus próprios processos de tomada de decisão. De facto, esta tese apresenta evidências de que, ao longo de uma campanha, não só é possível que a dinâmica de investimento ganhe
momentum, como o momentum ganho até determinado dia influencia
positivamente os investimentos subsequentes. Adicionalmente, esta tese apresenta uma análise empírica das dinâmicas de investimento em Equity
Crowdfunding considerando a diluição de ações que ocorre após uma campanha
entrar em overfunding como determinante de decisões. Apesar de os investimentos feitos serem de pequena ordem, os resultados apontam no sentido de os investidores tomarem em atenção a diluição de ações associada a uma campanha nos seus processos de tomada de decisão. Evidencia-se um efeito negativo provocado no momentum de investimento, que é ainda maior quando apenas são consideradas campanhas bem-sucedidas. A autora discute como é que os resultados contribuem para a literatura e apresenta sugestões para investigação futura.
Abstract
The present thesis investigates whether investors’ decisions have an influence on subsequent investors, ascertaining this as funding momentum. It presents an analysis of the behaviour of investors in an Equity Crowdfunding setting, using a sample of all the investments made on 134 campaigns posted on the platform Invesdor, from 2012 to 2017. The results seem to indicate that, in an environment where the level of information asymmetries is substantial, investors look at the actions of others in their own decision-making. In fact, this thesis presents evidence that throughout the duration of a campaign not only it is possible for the funding dynamic to gain momentum, but also the momentum gained until a given day in a campaign positively influences subsequent investments. In addition, this thesis presents an empirical analysis of funding dynamics in Equity Crowdfunding taking into account the share dilution that occurs after a campaign enters in overfunding as a determinant of decisions. The results seem to indicate that, although the investments are of relatively small order, investors take into account the share dilution of a campaign in their decision making. The evidence suggests a negative effect provoked on the funding momentum, which is even higher when only considering successful campaigns. One discusses how the results obtained contribute to literature and presents suggestions for future research.
Table of Contents
Acknowledgments ... i
Resumo ... iii
Abstract ... v
Table of Contents ... vii
List of Tables ... ix
Glossary ... xi
Chapter 1 - Introduction ... 1
Chapter 2 - Literature Review and Theoretical Framework ... 5
2.1 Equity Crowdfunding ... 5
2.1.1 Success in Equity Crowdfunding ... 6
2.1.2 Funding Dynamics in Equity Crowdfunding ... 8
2.2 Herding Behaviour ... 11
2.3 Share Dilution ... 14
Chapter 3 - Data and Method ... 17
3.1 Platform Description ... 17 3.2 Data Sample ... 18 3.3 Hypotheses development ... 19 3.4 Variables ... 21 3.4.1 Dependent Variable... 21 3.4.2 Explanatory Variables ... 21 3.5 Model Specification ... 24
Chapter 4 - Discussion of Results ... 27
4.1 Summary Statistics ... 27
4.2. Empirical Analysis and Results ... 31
Chapter 5 - Conclusions and future work ... 37
Bibliography ... 39
List of Tables
Table 1 - Summary Statistics. ... 27
Table 2 - Summary Statistics for Successful Campaigns ... 28
Table 3 - Summary Statistics for Unsuccessful Campaigns ... 29
Table 4 - Estimation Results (Average Marginal Effects) ... 31
Glossary
AON – All-or-Nothing BA – Business Angel CF - Crowdfunding
ECF – Equity Crowdfunding FCFS – First-Come First-Served IPO – Initial Public Offering KIA – Keep-it-All
VC – Venture Capital VCs – Venture Capitalists
Chapter 1
Introduction
Crowdfunding (CF), as a recent and emerging funding option for ventures in business investment (Mollick, 2014), is developing in innovative ways. It is a “broader concept of crowdsourcing”(Belleflamme, Lambert, & Schwienbacher, 2014, p. 586) combined with microfinance (Mitra, 2012) and striped down it consists of raising funds for a given project or venture by a crowd (Schwienbacher & Larralde, 2010) without the standard financial intermediaries (Mollick, 2014)1. Griffin (2012, p. 4) stated that “Crowdfunding is like posting a
classified advertisement on a website (…), an entrepreneur advertises a business concept and requests funding from interested parties”.
Crowdfunding may have become a viable option for start-ups and early-stage businesses to get access to the financing they need (Borello, Crescenzo, & Pichler, 2015; Cordova, Dolci, & Gianfrate, 2015; Vulkan, Åstebro, & Sierra, 2016), in alternative (or in addition) to Business Angels (BA) and Venture Capitalists (VC) and other traditional sources of funding (Tomczak & Brem, 2013).
Early stage businesses and start-ups struggle to attract financing for their ventures, because when a business is beginning its entrepreneurial lifecycle it presents insufficient cash flows, have a high degree of risk and uncertainty attached (Cosh, Cumming, & Hughes, 2009), and lack assets, giving rise to a funding gap (Borello et al., 2015). In addition, the traditional financing sources
2
available for the entrepreneurs of early ventures usually constrain investors to fund only on a local level (Agrawal, Catalini, & Goldfarb, 2014). After the financial crisis that arose in 2008, VC and BA, facing an environment of uncertainty, started investing in a later stage in the funding cycle in an effort to mitigate their risk (Block & Sandner, 2009), thus further exacerbating the funding gap previously mentioned.
Adding the evolution of web 2.0 technology to the credit crunch that occurred after the financial crisis of 2008 (Agrawal et al., 2014; Belleflamme et al., 2014; Brabham, 2008; Kirby & Worner, 2014; Kleemann, Voß, & Rieder, 2008), the conditions were propense to the rise of CF. Besides being able to provide start-ups and small companies with the access to financing that they (most likely) wouldn’t get otherwise, it presented two major advantages for entrepreneurs: the reduction in marketing and transaction costs and the possibility to get a prospect of the market (Belleflamme & Lambert, 2014; Valanciene & Jegeleviciute, 2013). Simultaneously, it allowed investors to reduce their exposure to risk since investments made in CF are very small compared to VC and BA setting, thus allowing them to more easily diversify their portfolios (Agrawal et al., 2014).
Although CF might be a viable option to raise funding, it is also a very risky environment. There are five types of CF: donations, rewards, lending, equity, and hybrid (Irene, 2012). This study addresses the riskiest type: Equity Crowdfunding (ECF). This is the case because, while in other types of CF when one makes an investment decision it assesses the quality of a project, on ECF, on the other hand, one must assess the quality of a whole firm and whether it will be able to generate enough cash flow to compensate the investment made. This further increases the risk of information asymmetry since, inevitably, the entrepreneur will know more than the investors (Agrawal et al., 2014; Backes-Gellner & Werner, 2007; Sigar, 2012). Hence, the concern that CF might lead investors to fund fraudulent or unqualified businesses exists, firstly because
investors do not have to be accredited nor experienced, and since the process occurs on the internet, it does not exist a very large window of opportunity for the investors that are experienced to perform due diligence (Agrawal et al., 2014; Griffin, 2012; Valanciene & Jegeleviciute, 2013).
Having all this in consideration, ECF presents itself as a setting where herd behaviour is very likely to occur. That is, in the absence of sufficient information to make a decision that is fully rational, investors might look at the actions of others to try to infer something about ventures’ quality (Chen, Huang, Liu, & Ma, 2017; Zhang & Liu, 2012).
Therefore, when investing in an ECF campaign, investors face a decision with two opposite “forces”, and in which the difference of the both will ultimately determine whether an investor will choose to fund a venture or not. These two “forces” are the fear of choosing not to invest in a company early enough and then not being able to do it because the campaign reached its maximum investment (Hornuf & Schwienbacher, 2017); and the opportunity cost of investing in a campaign that might go unfunded, as well as having the money held up when it could be used to be invested in other campaigns or firms (Chen et al., 2017; Zhang & Liu, 2012). Although these forces work on an individual level, in a scenario where information asymmetries are substantial, when investors see the actions of others they might incorporate them into their own beliefs (Banerjee, 1992). As Kim and Viswanathan (2016, p. 1) state, when studying CF in a market for mobile applications, “(…) the majority of investors in this market – the crowd – although inexperienced, are rather sophisticated in their ability to identify and exploit nuanced differences in the underlying expertise of the early investors”.
The main goal of the present thesis is to understand whether investors’ decisions have an influence on subsequent investors, ascertaining this as funding momentum. One studies the role of funding momentum and if it arises from the
4
herding behaviour that one might find in ECF. One argues that in the funding dynamics of an ECF campaign, momentum arises when the investors perceive others’ decisions as signals of the underlying quality of a certain venture, and once a campaign gains momentum it affects the propensity of subsequent investments and, ultimately, a campaign’s success.
This thesis was written in an organizational context. The curricular internship took place in a strategical consultant, Triple A – Capital & Finance. The consultant is a financial advisor with special emphasis on small and medium enterprises and new business opportunities, resorting to the traditional funding options (bank loans, angel investors, venture capital and common funds) in their advisory scheme. The theme chosen arose from the necessity of the company in having alternative funding options for smaller clients, other than the traditional funding channels. This way, one can introduce the consultant to a new method of raising funds for their clients, as well as demonstrate how to assess the quality of a campaign and model it in the best way possible, to achieve success. In addition, a study of the dynamics of investors, whether it is on a CF setting or not, is always feasible since, although most investors in ECF are unexperienced, some are also VC and BA simply investing through a different channel.
The rest of the thesis is structured as following: Chapter 2 performs a literature review on equity crowdfunding and its funding dynamics, on herding behaviour and on dilution of shares, Chapter 3 presents the data sample, the hypotheses development and the construction of the model, Chapter 4 discusses the results obtained and, finally, Chapter 5 draws the main conclusions, identifies limitations of this study and points some suggestions for future research.
Chapter 2
Literature Review and Theoretical Framework
2.1 Equity Crowdfunding
In Equity Crowdfunding (ECF) companies issue shares or other types of securities in return for capital, falling within the category of financial return crowdfunding (Hornuf & Schwienbacher, 2017).
ECF is the type of crowdfunding whose target companies are start-ups, seed-stage companies and small and medium enterprises, being an alternative source of funding to these kind of companies (Deffains-Crapsky & Sudolska, 2014; Wilson & Testoni, 2014).
Typically, a campaign in a ECF context can follow two models regarding the acceptance of pledges: the First-Come First-Served (FCFS) model, where pledges are accepted by the order that they are made, and the auction mechanism (Hornuf & Schwienbacher, 2017). The dynamics in investment are quite different from one to the other since the incentives to wait or to invest right away differ, as well as the information revealed from each investors’ decision to the rest of the crowd2. Although one acknowledges the auction mechanism as a type of ECF
campaign, it is irrelevant to the purpose of this thesis and, therefore, will not be studied.
2 In a second-price auction, the price is different throughout the campaign since it changes with each pledge.
On FCFS setting, on the other hand, the price remains constant (Hornuf & Schwienbacher, 2017). Although this might lead one to think that on a FCFS mechanism investors have no incentive to wait, as hypothesised by Hornuf and Schwienbacher, this is actually not the case as one will show further ahead.
6
There are two types of crowdfunding models: the All-or-Nothing (AON) or Keep-it-All (KIA) (Cumming, Leboeuf, & Schwienbacher, 2015). The difference between the two resides in the amount of capital that can be kept by the entrepreneur. In crowdfunding (in general), the entrepreneur sets a minimum amount of capital to be raised, that is a minimum target. If this goal is not reached, in a AON model, the entrepreneur doesn’t receive any of the amount raised and all pledges are returned to the investors, whereas in a KIA model, the entrepreneurs receive the total amount pledged. To the best understanding of the author, ECF platforms can only take the form of AON campaign.
2.1.1 Success in Equity Crowdfunding
There are several studies conducted about the funding dynamics in crowdfunding contexts. There are studies analysing characteristics of entrepreneurs, investors and platforms, altogether and individually. However, only in the most recent years was this analysed in a ECF context.
In a rewards-based CF setting, some have studied which factors have an impact on crowdfunding success. Cordova et al. (2015), using a sample of 1127 technology projects on four crowdfunding platforms, found that the higher is the target amount set by the entrepreneur for the campaign, the less likely will the campaign be funded. On the other hand, their results showed that the duration of a campaign and the amount contributed per day both have a positive influence in a campaign’s likelihood of success.
In a study conducted by Vulkan et al. (2016), the authors find that the main differences between ECF and rewards-based CF are the target amount of capital that entrepreneurs seek and the average sum pledged by investor (which are both higher in ECF) the requisite of a pre-money valuation, and the fact that investors are specially motivated to invest because of financial return.
In a non-equity CF platform, (rewards-based to be precise), a study was conducted regarding the geography of investors and the funding dynamics, namely by Agrawal, Catalini, & Goldfarb (2011). They find that geographic distance in a CF context (in this particular case, music-related businesses) does not confine the source of funding to the same geographic area as the business being advertised. Following, the authors discuss whether CF, and in particular ECF, can or not mitigate distance-related frictions between investors and entrepreneurs. In a more recent paper, Günther, Johan, & Schweizer (2016) analyse the same issue in a ECF context and come to the conclusion that geographic distance does not lose the importance one would expect, and indeed impacts negatively the likelihood of investment. They compare investors that live overseas to investors in the geographic area of the venture being funded, concluding that although overseas investors do not seem to be affected by distance, there is strong evidence that home investors are.
Several other papers analyse the geographic dispersion of investors and entrepreneurs, in order to be able to answer the question, of whether or not ECF can mitigate the distance related frictions that exist in VC and BA funding channels (Agrawal et al., 2011; Günther et al., 2016; Mollick, 2014). However, one will not study the geographic-related frictions found in ECF.
There are some studies about ECF campaigns studying the likelihood of success of the campaigns, considering the size of the venture, the growth of the business and the geography of entrepreneurs and investors (Agrawal et al., 2011; Ahlers, Cumming, Günther, & Schweizer, 2015; Mollick, 2014; Vulkan et al., 2016).
Studying which signals sent by start-ups induce small investors to invest in a certain campaign of ECF, Ahlers et al. (2015) examine financial roadmaps, external certifications, board structure and size, and risk factors. Based on a sample of 104 ECF campaigns, the authors present empirical evidence that
8
signalling plays a major role for investors, with special emphasis on potential risk factors, equity percentage offered, and the board’s structure and size. Their results also highlighted the fact that crowdfunding and its market operate in a relatively rational way, even among unsophisticated investors.
Vismara (2016) investigates the role of signalling towards external investors, regarding equity retention and social capital. The author presents evidence that campaigns in which the equity retained by the entrepreneur was higher and in which the amount of social capital was greater, had higher likelihood of success.
In another paper, Vismara (2015) contributes to literature by studying the signalling dynamics between investors in a campaign, researching how information cascades affect the probability of success. The author studies the importance of the first days of a campaign in attracting subsequent investors thus contributing to the campaign’s success. The fact that a higher number of pledges in the early days of a campaign contributes to the probability of success was demonstrated in other contexts but one will not address this literature.
2.1.2 Funding Dynamics in Equity Crowdfunding
Literature about funding dynamics in CF is somewhat extensive, although it is more focused on non-financial CF.
Agrawal et al. (2014) found evidence that accumulated capital increases an investor’s propensity to fund a campaign, raising the possibility to lead to herding behaviour and report that this can work the other way around, that is, when new investors see a campaign accumulating capital too quickly it can lead to a “bystander effect” (p. 66), wherein investors believe the campaign will be funded either way and therefore will not invest (Kuppuswamy & Bayus, 2018).
Regarding early contributions in an ECF context, using a sample of 111 ECF campaigns, Vismara (2015) shows that investors that make pledges in the early days of a campaign have a positive influence on subsequent investors, perceiving
early contributions as a signal that a certain campaign will achieve the target funding amount.
Hornuf and Schwienbacher (2017) investigate the dynamics of equity crowdfunding using information from four different equity crowdfunding platforms in Germany, finding that in a FCFS model the dynamics of investment are L-shaped throughout a campaign. Additionally, they present evidence that updates and comments on the campaigns had a strong positive influence in subsequent investments. This result was also obtained by Block, Hornuf, & Moritz (2018), whom analysed updates and comments on 71 pitches on two German ECF platforms and reached estimation results indicating that updates had an effect on the number of investments of a campaign, as well as the amount raised, although this impact was not immediate (not as linear as the number of updates on day t affecting the number of investments on day t+1)3. Moreover, it
was speculated that the crowd perceived larger investments as a signal of the quality of the ventures. This was also discussed by Vulkan et al. (2016) and Hornuf & Schwienbacher (2017) whom, as stated before, investigated which factors were associated with driving success in an ECF campaign, finding that the existence of high pledges in campaigns contributes positively to the campaign’s probability of success.
Vulkan et al. (2016) reached the same conclusion as Vismara (2015), that the number of investors in a campaign, and their social networks, contribute to subsequent investments and to the success of the campaign.
Studying the possibility that investors in ECF might engage in herding behaviour, Chen et al. (2017) present evidence of rational herding. Their results show that accumulated capital, up until the previous period considered, has a positive influence in subsequent investments (in line with the previously
3 Cordova et al., (2015) in a rewards-based setting of CF also studied the impact of updates on the likelihood
10
mentioned studies). More specifically, the authors show that previous accumulated capital contribute to the funding propensity of the next day, where the number of investments in a day have an inverted U-shape relationship with accumulated funding. Hence, at a certain time of a campaign the number of investors starts to negatively influence subsequent investments. Other conclusion is that as a campaign is reaching its target funding goal, it becomes more interesting to investors than when it was in the beginning. This also has to do with the time value of money, that is, in the beginning of a campaign if an investor makes a pledge the money just sits in an escrow account waiting for the campaign to reach the target amount, whereas when the campaign is close to reaching the target the likelihood of being successful is higher. They also presented evidence that high pledges induce less investments as they are perceived as a signal of a major event of share dilution. They also find that the amount of equity offered doesn’t impact the amount raised per day which is somewhat disconcerting since other literature presented previously found evidence that it affects the probability of success. The major drawback of this study is the sample used, which encompasses 92 equity crowdfunding campaigns that only allow for accredited investors.
2.2 Herding Behaviour
Over the years there were presented several definitions for the concept of herding behaviour. Devenow & Welch (1996) performed a systematic review of herding behaviour in the context of financial markets, referring that herding behaviour arises when agents’ decisions to invest are correlated to one another. Others state that herding behaviour is the act of incorporating the public opinions and actions of others into their own beliefs (Cote & Sanders, 1997).
However, the expectation of agents behaving in a similar manner, for itself, is not a sufficient condition to determine if there exits herding behaviour since this might happen by coincidence or because of a specific context where agents get access to the same information (Lobão, 2012).
Banerjee (1992) draws in a straightforward model of herd behaviour where agents decide sequentially, cannot choose to delay their decision and can only see the other agents’ actions (not the information they have nor the signals they got). He suggests that when players try to infer information from others’ actions, the agents automatically become less responsive to their own private information, which makes their subsequent decisions no longer a source of potential information to others. The author refers to this as a “herd externality” (p. 799). He states (p. 809) “(…) the choices made by agents are not always sufficient statistics for the information they have. If the choices are always sufficient statistics, future agents always know what information their predecessors had acted upon, and therefore there is no herd externality and no inefficiency. It is when the choices made by some agents affect the information that subsequent decision makers have that there is a potential for herd externality”. An implication of the model designed by the author is that the order of choice is determined exogenously, that is, one cannot choose to delay his
12
decision. This is unrealistic in a financial setting (and even more on an CF context) since waiting is, in fact, an option and it has an opportunity cost associated. When the cost is high, herding happens almost the same way as in a no-waiting context; however, when this cost is relatively low, the herd behaves in a different manner.
On a different note, Choi (1997) studies herding behaviour in a technology adoption process considering a backwards perspective, that is, the author investigates how first movers make the decision to invest, knowing that the adoption of a certain technology will reveal information to others. On other words, they tried to assess how late adopters impact the decision of first movers rather than how first movers influence subsequent adopters. The author states (p. 2) “(…) every agent has to predict the informational consequences of her actions on those of the subsequent decision-makers which, in turn, affect her own payoff”. This statement is true when one is not in the presence of a setting where there is complete information available. The fact that herd behaviour might occur, bias the decision of the first mover towards safer options instead of the best technologies. Therefore, in the model described by the author, what is taken into consideration is how the revelation of information inherent to the decision of the first mover actually prevents him from adopting the technology. As so, in a setting where there is a waiting option, they describe a “penguin effect” (p. 19): “(…) each user will be reluctant to move first as long as there is a possibility that her choice may turn out to be so inferior as to make orphan her adoption”, implying that all agents will have the incentive to wait for others to move first, due to the learning mechanism that it triggers.
Bikhchandani & Sharma (2000) perform a systematic literature review on the models presented over the years to detect herd behaviour in financial markets. They point out the main causes for herd behaviour as the existence of imperfect information (asymmetries), concerns for reputation and compensation
structures. They argue that once a cascade starts, and therefore herding occurs, after the first few decision-makers the decisions of subsequent investors add nothing to the pool of knowledge and make individuals invest regardless of their own private information (which is in accordance with the model developed by Banerjee (1992)). Another important conclusion of this study is that a cascade can be ended just as easily as it started, simply by the arrival of new information, which induces agents to adjust their beliefs.
Graham (2003) empirically tests herd behaviour using data regarding investment newsletters. His findings are that the tendency to herd increases with some aspects: the reputation of analysts, their abilities, the consistency of public information related to private information, and with the correlation of signals among the analysts.
Chen et al. (2017) distinguish rational herding from irrational, stating that the former occurs when potential investors assimilate previous pledges as a sign of reliable information and adapt it to their expectations, while irrational herding happens when potential backers simply follow others’ investments without assessing themselves the venture’s quality. Also, herding intensifies in situations in which information asymmetry is higher (when the technology risk of the company is high, for example) (Zhang and Liu, 2012).
As previously mentioned, ECF is an environment characterized by a high degree of uncertainty due to information asymmetries and because most businesses are in an early stage of their development. The risk associated with the investment is high, and, quoting Chen et al. (2017, p. 6) “investment decisions of others are perceived as a positive signal of unobservable quality of the project”, thus inducing investors to behave in a herding manner (Banerjee, 1992; Bikhchandani & Sharma, 2000; Vismara, 2015).
14
2.3 Share Dilution
Literature about share dilution in corporate finance is quite extensive and diversified. For that reason, one will not approach it in all its extent, but only the literature that can be applied directly to CF.
Firstly, as previously mentioned in the Introduction chapter of this study, ECF is much more comparable to an early-stage VC and BA setting than to other types of crowdfunding. Vulkan et al. (2016) enumerate the main similarities found between BA and early-stage VC and ECF as being the amount of funding requested in the campaigns, the existence of a business plan, an explicit pre-money valuation and an equity share arrangement for each pledge made. Having this said, one may argue that when investors in ECF are in the process of decision-making, they will value the company and their investment much like early-stage VC and BA value start-ups and early-stage ventures. Therefore, in this section, one develops the theoretical framework on the venture capital method of valuing start-ups and early-stage companies.
When one is talking about early-stage businesses and start-ups the lack of history of the performance of the company and the fact that the entrepreneur will, unavoidably, know more about the business than the VC (information asymmetry, which is even higher in a CF setting) (Backes-Gellner & Werner, 2007; Connelly, Certo, Ireland, & Reutzel, 2011), makes the process of valuing the company more complicated and almost ambiguous (Anshuman, Martin, & Titman, 2012). That is exacerbated by the fact that the valuation will be performed based on projections provided by the entrepreneurs and, most of the times, will tend to be biased upwards. Hence, investors will make their decisions based on their valuations, and also on the setting that surrounds them which, in the case of early stage ventures, is characterized by high volatility (Sahlman, 1988).
As previously mentioned, the main difference between ECF and other types of crowdfunding is that in ECF an investor is not valuing solely a project, but an entire firm.
VCs will access the total value of the company to decide whether to invest or not, especially when valuing early-stage ventures (Johnson, 1998). Inevitably, each investor will have its own valuation of a company (or at least perceive it from others’ actions, in the specific case of CF).
To understand the venture capital method of valuing a firm, consider the following example in which there is a firm with the following pre-money valuation and is seeking the following investment:
• Pre-money valuation: 10,000€
• Investment required: 3,000€
• Post-money valuation: 13,000€
• Equity equivalent to the investment: 3,000/13,000 = 23.08%
Now, consider the specific case of crowdfunding, where there is a minimum and maximum target amount of investment to be raised. Firstly, note that a minimum and maximum target amount also imply a minimum and maximum post-money valuation. Taking the previous example as what would happen in the case of the minimum investment, now consider the case of the maximum investment:
• Pre-money valuation: 10,000€
• Maximum investment: 5,000€
• Post-money valuation: 15,000€
• Equity: 5,000€/15,000€= 33.33%
Considering that there are only two investors, in which the first one gives the minimum investment, 3,000€, and the other investor gives the remaining 2,000€, what would, previously, represent 23.08% acquisition of a company, now represents 3,000/15,000 = 20%. With this example it becomes quite clear to
16
understand how dilution of shares will work on an ECF setting, for the investors. Until the minimum target amount is reached every investment represents the same ownership of the company (proportionally to the investment). After the minimum target amount is achieved, every investment made implies issuance of new shares, which involves the calculation presented before and hence, the share dilution of the investors that made pledges before the campaign achieved its minimum.
As Johnson (1998, p.3) states “The investment decision for the venture capitalist and the negotiation with the entrepreneur centre on: (i) the perceived value of the company before the financing (the pre-financing valuation) and (ii) the amount of money that the company is raising”.
When an entrepreneur defines the investment goal for his company he faces a two-determinant decision: setting the target amount of capital to be raised at its minimum, in order to retain the maximum equity possible, or setting it a higher level, in the case the company will need more than firstly perceived (Sahlman, 1988). As Sahlman (1988, p. 31) states, the entrepreneur will set the company’s target amount of investment balancing “(…) the fear of running out of capital and the desire to retain maximum possible ownership (…)”.
In the case of ECF, an entrepreneur can do both, setting a minimum target amount, which will ultimately correspond to the company’s most absolute needs, and a maximum target amount, which will correspond to the maximum level of investment that the company will need in case something goes wrong.
If the entrepreneur sets the minimum target too low and the maximum target too high, one argues that the early investors will consider the share dilution they might eventually face, before making their decision.
Therefore, when one develops the empirical model to test for funding momentum, in Chapter 4, one considers the share dilution as determinant of the propensity of funding.
Chapter 3
Data and Method
3.1 Platform Description
The data used to estimate our model, was kindly shared by the platform Invesdor, for most part, and hand-collected for the variables for which information was not provided.
Invesdor is a Finnish ECF platform with headquarters in Helsinki and was the first equity-based crowdfunding platform to be founded in Northern Europe. The platform was founded in 2012.
Most campaigns in the platform are equity based, but Invesdor also accepts rounds for issuance of bonds and Initial Public Offerings (IPO).
Until the present moment, Invesdor was able to raise more than 48 million Euros, having had 201 pitches (including equity, bonds, and IPO) going public until the 30th of October of 2017, of which 101 were successful, corresponding to
a success rate of approximately 50.25%.
On the webpage of the platform one has access to the pitches of the campaigns, both for successful and unsuccessful campaigns4, although after a campaign has
ended the companies may choose to delete their pitch webpage5. On each pitch
webpage one has access to: the story of the company, a description of the business
4 http://www.invesdor.com/en/pitches .
5 This happens mostly with unsuccessful campaigns although some of the successful pitches also had their
18
and current market situation, the team, the purpose of the funds, the valuation of the company, an assessment of risks, information on issue terms, financial forecasts and the documents uploaded by the company. This is not true for all campaigns since when the platform was launched the information requested was not so demanding and, also, the information shared on the website varies from campaign to campaign. Companies may also choose to attach a video to the pitch. Regarding the campaign, one can see the company name, the investment range (minimum and maximum amount sought), the equity offered (minimum and maximum equity), the price per share and minimum securities required per pledge, the number of existing shares, pre-money valuation, estimated revenue in the cruising year, the start date of the campaign, the location of the venture, the field of the business and its development stage and, finally, how much was raised until the considered moment, how many investments were made, and on what days. However, investors do not have access to how much each other investor has pledged nor whether or not it is a legal entity or a natural investor; one can only see a nickname which does not necessarily have to be a real name and, on top of that, investors may even choose to not display the nickname at all, investing anonymously.
An important note about this platform is that the pitches are first uploaded in a hidden mode, that is, only a few selected investors are able to see the pitch and only when the pitch obtains 30% of funding, does the webpage go public.
3.2 Data Sample
The main goal of the present study is to understand whether investors decisions have an influence on subsequent investors ascertaining this as funding momentum. In other words, one wants to verify the impact of day to day interactions throughout an ECF campaign’s duration.
In order to do this, one analyses a sample encompassing all the investments made in the Finnish platform Invesdor on 134 campaigns, from the 16th of May
of 2012 to the 31st of August of 2017. This sample was kindly provided by the
platform. The raw data included 201 campaigns. There were eliminated 6 campaigns, which were not equity crowdfunding (bonds and IPO), other 35 campaigns were eliminated in which there was funding from external sources to which we did not have access to the date or nature of the investment, another 6 campaigns were dropped on which we did not have information on all the investments made in that campaign, 3 campaigns were dropped because they had less than 2 weeks of duration and another 17 campaigns were dropped because we did not have access to the webpage of the pitch and therefore the information not provided by the platform could not be collected. The final data is comprised of 134 campaigns, where the shortest campaign has 13 days and the longest campaign has 233 days, encompassing a sample of 11245 observations of a panel dataset, with campaign and day as dimensions.
3.3 Hypotheses development
The literature review performed in the previous Chapter lead one to develop and test the hypotheses elaborated in the present section.
Firstly, one intends to investigate if campaigns gain momentum in their funding dynamics and if this relationship is constant throughout a campaign or follows an inverted U-shape relationship, as evidenced by Chen et al. (2017).
Hypothesis 1a: The number of investments made on a given day of a campaign have
an impact on the propensity to invest in the following day.
Hypothesis 1b: The relation hypothesised between the number of investments on a
20
Secondly, to evaluate if the crowd behaves in a herding manner when the funding of a campaign gains momentum, one develops the following hypotheses, in line with previous studies (Agrawal et al., 2014; Chen et al., 2017).
Hypothesis 2a: The cumulative investments made on a campaign up until a given
day have an impact on the propensity to invest in the following day.
Hypothesis 2b: The total amount raised in a campaign up until a given day have an
impact on the propensity to invest in the following day.
Hypothesis 2c: The average pledge made by investor inferred on a given day of a
campaign have an impact on the propensity to invest in the following day.
Hypothesis 2d: The percentage left unfunded on a given day of a campaign have an
impact on the propensity to invest in the following day.
In line with the hypotheses elaborated to test for herding behaviour, one would like to explore the impact of new information on the propensity of funding and on momentum, according to previous literature ( Block et al., 2018; Cordova et al., 2015; Hornuf & Schwienbacher, 2017).
Hypothesis 3: The arrival of new information, in the form of updates, on a given day
of a campaign have an impact on the propensity of funding in the following day.
Finally, to investigate the impact of share dilution on the propensity of funding one tests the following hypothesis.
Hypothesis 4: The ownership an investor gets for pledging the minimum investment
3.4 Variables
3.4.1 Dependent Variable
The variable one will try to explain in this model will be the number of Investments pledged in a certain day of a campaign. To do so, one defines the variable Number of Investments per day, (Nr_Invesmentsit) as the number of
investments made on campaign i on day t.
3.4.2 Explanatory Variables
The variables used to explain the model are:
• Lag Number of Investments, (Nr_inv_dayit-1), which corresponds to the
number of investments made on campaign i until day t-1. This variable will also be integrated with a quadratic term (Nr_inv_day2it-1) to restrict
the assumption that the relation between this variable and the explained variable is linear, and to test the results achieved by Chen et al. (2017) that this same relationship follows an inverted U-shape pattern6. This variable and its quadratic termwill be used to test
hypotheses 1a and 1b.
• Lag of the cumulative investments, (Cum_investmentsit-1), which
corresponds to the total number of investments made on campaign i until day t-1, following previous studies (Agrawal et al., 2014; Chen et al., 2017). This variable will be used to test hypothesis 2a.
• Lag of the Cumulative Amount, (Cum_amountit-1), which corresponds
to the total amount of funding raised on campaign i until day t-1. This variable will be used to test hypothesis 2b.
6 Although Chen et al. (2017) studied this relationship with the dependent variable being “amount raised in
22
• Lag of the Average pledge, (Average_pledgeit-1), which corresponds to
the total amount raised divided by the total number of investors of campaign i on day t-1. Previous studies investigated the impact of a large pledge in subsequent investments (Block et al., 2018; Chen et al., 2017; Hornuf & Schwienbacher, 2017; Vulkan et al., 2016). However, in this specific platform, investors cannot observe how much each investor has pledged. The crowd can only see on which days investments were made, how many pledges were made and how much was raised until the moment. Therefore, we use this variable to try to understand how the perception of the crowd of the average pledge affects the investment decisions, instead of using a variable of the largest pledge. This regressor will be used to test hypothesis 2c.
• Lag of the Updates, (Nr_updatesit-1), following previous studies that
used Updates as a variable to measure the impact of new information (Block et al., 2018; Cordova et al., 2015; Hornuf & Schwienbacher, 2017), one uses the variable updates per day, with a lag, which corresponds to the number of updates posted by the entrepreneur of campaign i on day
t-1. This variable will be used to test hypothesis 3.
• Lag of the Ownership from Minimum Investment,
(Ownership_from_minit-1), which is a variable to control for share
dilution. It measures the percentage of ownership that the minimum investment on campaign i represents until day t-1 (this variable only changes once the campaign goes into overfunding). It is calculated as the lag of
( ) , when the
campaign has not reached the minimum target; and as the lag of
( ) , when a campaign enters in
overfunding. The Minimum amount of Investment is calculated as the product of the price per share and the minimum amount of securities
required per share. Moreover, this variable suffered a natural logarithmic transformation to control for its skewness. This variable is used to test hypothesis 4.
• Lag of Percentage left unfunded, (Till_targetit-1), in line with Chen et al.
(2017) one defines this variable as the percentage of the minimum target of campaign i that is left unfunded until day t-1. This variable takes the value 0 once a campaign enters in overfunding. This variable will be used to test hypothesis 2d.
The control variables are presented below. Note that all these variables are time-invariant.
• Minimum Target, (Minimum_targeti) in line with previous studies, we
control for the minimum amount sought by the entrepreneur of campaign i (Ahlers, et al., 2015; Chen et al., 2017; Vismara, 2015).
• Minimum Equity Offered, (Minimum_equityi) following previous
studies, we control for the minimum equity offered in campaign i (Ahlers, et al., 2015; Chen et al., 2017; Vismara, 2015).
• Financial Forecasts, (Financialsi) following Ahlers et al. (2015) we use a
dummy variable that takes the value 1 in case there were presented financial forecasts in the pitch webpage of campaign i, and 0 otherwise.
• Stage – Seed and Early, (Stage_earlyi and Stage_seedi) to control for the
development stage of the venture, we introduce two dummy variables,
Stage_Seedi that takes the value 1 in case the venture of campaign i is in
the seed stage and 0 otherwise; and Stage_Earlyi, that takes the value 1
in case the venture of campaign i is in the early stage and 0 otherwise. There is a third stage, which is growth; however, if one were to introduce this variable in the model it would cause multicollinearity issues (since one regresses all models with a constant).
24
3.5 Model Specification
The estimation equation that will regress the explained variable on the explanatory and control variables, will make use of the panel dataset in Section 3.2.
The distribution of the explained variable is very skewed to the right. Of the 11245 observations in the final dataset, 8878 observations are zeros. Therefore, the use of an Ordinary Least Squares (OLS) regression would yield biased results and the estimation of the coefficients would not be appropriate. Following, one chose to estimate the equation that will be presented below with the count model for panel datasets fixed-effects negative binomial regression, with exposure to the number of days of each campaign.
The estimation equation is defined as follows:
!"_$%&_'() = +,+ +.!"_$%&_'() . + +/012_$%&34523%54 . + +6012_(271%5 .+ +89&3"(:3_;<3':3 .
+ +=!"_1;'(534 . + +>ln (AB%3"4ℎ$;D"722$%) .
+ +EF$<<5(":35 . + +GMinimumLMNOPL + +QMinimumPRSTLU + +.,V$%(%W$(<4 + +..StagePMN]U + +./Stage^PP_ + ℇ
Since the model used is a fixed-effects regression model, all the variables that are time invariant must be dropped from the equation. Thus, the first equation to be estimated will be:
!"_$%&_'() = +,+ +.!"_$%&_'() . + +/012_$%&34523%54 .
+ +6012_(271%5 .+ +89&3"(:3_;<3':3 .
+ +=!"_1;'(534 . + +>ln (AB%3"4ℎ$;D"722$%) . + +EF$<<5(":35 .+ &
(1) In order to control for specific characteristics of the campaigns, interaction terms between the cumulative amount of investment and each of the time-invariant variables is added to the model, following Chen et al. (2017).
Computing the correlation matrix of all the explanatory variables, one did not find correlation issues between the variables. However, following Hornuf & Schwienbacher (2017) we drop the variable Financialsi, taking as true the
following statement “in principle the disclosure of the business plan should not affect the dynamics of the funding process later on” (p. 10). The correlation matrix can be found in the Appendix section.
The final equation is then defined as follows:
!"_$%&_'() = +,+ +.!"_$%&_'() . + +/012_$%&34523%54 .
+ +6012_(271%5 .+ +89&3"(:3_;<3':3 . + +=!"_1;'(534 . + +>ln (AB%3"4ℎ$;D"722$%) . + +EF$<<5(":35 . + +G012_(271%5 .∗ Minimum_target + +Q012_(271%5 .∗ Minimum_equity + +.,012_(271%5 .∗ Stage_early + +./012_(271%5 .∗ Stage_Seed + 1 (2) One will estimate equation 1. Equation 2 will be estimated with 3 specifications: the full model, the full model with campaigns that received at least 30% of funding (to encompass only campaigns in which the pitch was made public), and the full model only with campaigns that were successful.
Chapter 4
Discussion of Results
4.1 Summary Statistics
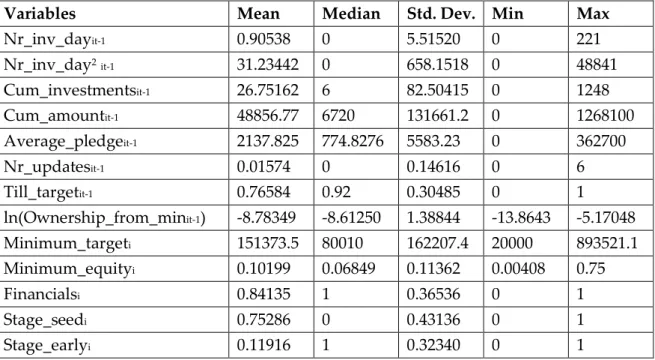
Table 1 presents the summary statistics for the full sample.
Variables Mean Median Std. Dev. Min Max
Nr_inv_dayit-1 0.90538 0 5.51520 0 221 Nr_inv_day2it-1 31.23442 0 658.1518 0 48841 Cum_investmentsit-1 26.75162 6 82.50415 0 1248 Cum_amountit-1 48856.77 6720 131661.2 0 1268100 Average_pledgeit-1 2137.825 774.8276 5583.23 0 362700 Nr_updatesit-1 0.01574 0 0.14616 0 6 Till_targetit-1 0.76584 0.92 0.30485 0 1 ln(Ownership_from_minit-1) -8.78349 -8.61250 1.38844 -13.8643 -5.17048 Minimum_targeti 151373.5 80010 162207.4 20000 893521.1 Minimum_equityi 0.10199 0.06849 0.11362 0.00408 0.75 Financialsi 0.84135 1 0.36536 0 1 Stage_seedi 0.75286 0 0.43136 0 1 Stage_earlyi 0.11916 1 0.32340 0 1
Table 1 - Summary Statistics.
Note: The statistics presented are computed across 11245 observations.
Interpreting summary statistics for a panel dataset can be somewhat challenging given that, in this specific sample, the dimension of time is not constant across campaigns. Considering the data presented in Table 1, one can infer that in the day corresponding to the middle of each campaign, the median number of investments made in the previous day is 0, the median Cumulative
28
investments made until the day before is 6, the median cumulative amount raised until the day before is 6,720 euros, the average pledge inferred from the investments made until the day before is 774.83 euros (approximately), the number of updates is 0, the median percentage left unfunded is 92%, and the median ownership one gets from the minimum investment in the previous day is 0.018%7. As for the time-invariant variables, the median minimum target is
80,010 euros, the median minimum equity offered is 6.85% (approximately), the median campaign presents financials and is on an early stage of its development.
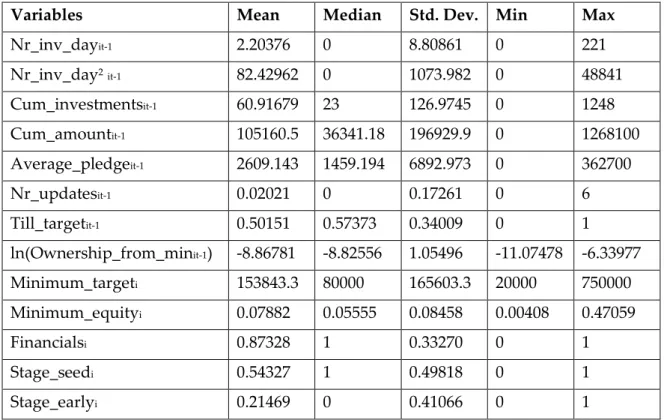
Table 2 and Table 3 present summary statistics for the same variables, distinguishing between successful and unsuccessful campaigns.
Variables Mean Median Std. Dev. Min Max
Nr_inv_dayit-1 2.20376 0 8.80861 0 221 Nr_inv_day2it-1 82.42962 0 1073.982 0 48841 Cum_investmentsit-1 60.91679 23 126.9745 0 1248 Cum_amountit-1 105160.5 36341.18 196929.9 0 1268100 Average_pledgeit-1 2609.143 1459.194 6892.973 0 362700 Nr_updatesit-1 0.02021 0 0.17261 0 6 Till_targetit-1 0.50151 0.57373 0.34009 0 1 ln(Ownership_from_minit-1) -8.86781 -8.82556 1.05496 -11.07478 -6.33977 Minimum_targeti 153843.3 80000 165603.3 20000 750000 Minimum_equityi 0.07882 0.05555 0.08458 0.00408 0.47059 Financialsi 0.87328 1 0.33270 0 1 Stage_seedi 0.54327 1 0.49818 0 1 Stage_earlyi 0.21469 0 0.41066 0 1
Table 2 - Summary Statistics for Successful Campaigns.
Note: The statistics presented are computed across 4206 observations
7Since we performed the natural logarithmic transformation of the variable Ownership_from_minit-1, the
results reported in the summary statistics are computed as following example: for a mean of ln(Ownership_from_minit-1) the mean of Ownership_from_minit-1 is given by exp(a).
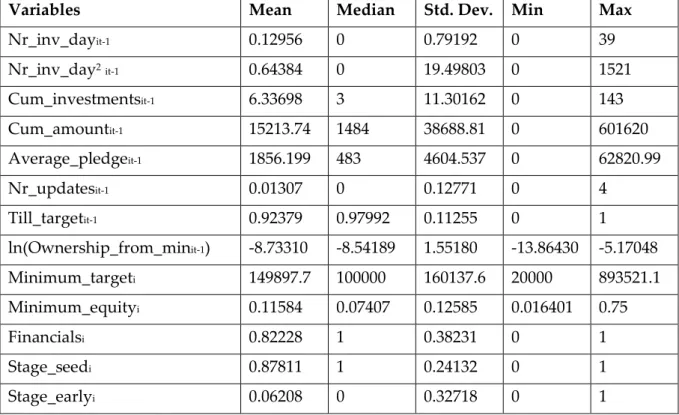
Variables Mean Median Std. Dev. Min Max Nr_inv_dayit-1 0.12956 0 0.79192 0 39 Nr_inv_day2it-1 0.64384 0 19.49803 0 1521 Cum_investmentsit-1 6.33698 3 11.30162 0 143 Cum_amountit-1 15213.74 1484 38688.81 0 601620 Average_pledgeit-1 1856.199 483 4604.537 0 62820.99 Nr_updatesit-1 0.01307 0 0.12771 0 4 Till_targetit-1 0.92379 0.97992 0.11255 0 1 ln(Ownership_from_minit-1) -8.73310 -8.54189 1.55180 -13.86430 -5.17048 Minimum_targeti 149897.7 100000 160137.6 20000 893521.1 Minimum_equityi 0.11584 0.07407 0.12585 0.016401 0.75 Financialsi 0.82228 1 0.38231 0 1 Stage_seedi 0.87811 1 0.24132 0 1 Stage_earlyi 0.06208 0 0.32718 0 1
Table 3 - Summary Statistics for Unsuccessful Campaigns.
Note: The statistics presented are computed across 7039 observations.
Both in the case of successful and unsuccessful campaigns, in the middle day of a campaign, the median number of investments made in the previous day is 0, the median number of updates made in the campaigns’ webpage in the previous day is also 0. Furthermore, the median firm presents financials and it is in the seed stage of its development.
The remaining variables differ quite a lot from successful to unsuccessful campaigns. In the median day, the median firm of an unsuccessful campaign only presented 3 investments and raised 1,484 euros, corresponding to an average pledge of 483 euros in the previous day, whereas the median firm of a successful campaign presented 23 investments and had raised 36,341.18 euros, corresponding to an average pledge of 1,459.19 euros, in the previous day. The median firm presented, in the median day, a percentage left unfunded of 97.99% and a minimum investment corresponding to an ownership of 0.02%, in the case of unsuccessful campaigns, and 57.37% and 0.015%, respectively, in the case of
30
successful campaigns. As for time-invariant variables, the minimum amount sought by the median firm is 100,000 euros, corresponding to a minimum equity of 7.41%, in the case of unsuccessful campaigns, whereas the median successful campaign sought a minimum amount of 80,000 euros, and offered 5.55% of minimum equity.
These statistics allow us to give a preliminary answer on which variables will most likely affect the funding momentum of a campaign. One expects the number of investments made in a certain day of a campaign to positively influence the number of investments made the next day, although one expects this relationship to follow an inverted U-shape (Chen et al., 2017): from a certain point on, investments made up until that point start to negatively influence subsequent investments. The cumulative investments made, the cumulative amount raised, and the average pledge are expected to positively influence subsequent investments, taken from the difference in values from successful to unsuccessful campaigns. The same impact is expected when there are updates in the previous day of a campaign. As for the percentage left to reach the target amount, in line with the expectation from the cumulative investments and amount, it is expected to negatively influence subsequent investments: the higher is the percentage left for the campaign to be successful the lower will be the propensity of subsequent investments. Regarding the percentage of ownership to which the minimum investment, throughout a campaign, correspond, it is difficult to make an inference from the summary statistics presented, although, based on the literature review performed, one expects this variable to negatively influence subsequent investments.
As for time-invariant variables, from the differences in statistics from successful and unsuccessful campaigns, one expects that the higher the target amount and equity offering are established, the lower will be the impact of previous investors on the following ones.
4.2. Empirical Analysis and Results
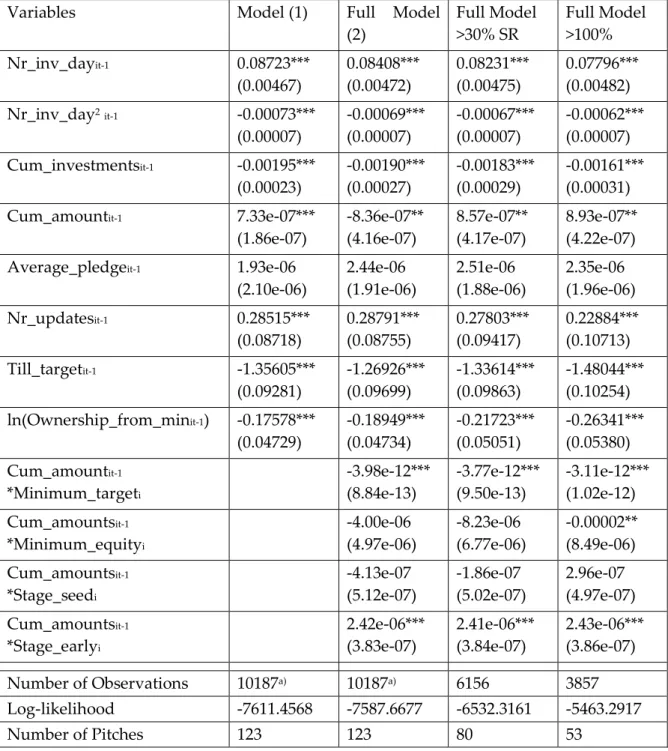
Table 4 presents the estimation results of the regression analysis.
Variables Model (1) Full Model
(2) Full Model >30% SR Full Model >100% Nr_inv_dayit-1 0.08723*** (0.00467) 0.08408*** (0.00472) 0.08231*** (0.00475) 0.07796*** (0.00482) Nr_inv_day2it-1 -0.00073*** (0.00007) -0.00069*** (0.00007) -0.00067*** (0.00007) -0.00062*** (0.00007) Cum_investmentsit-1 -0.00195*** (0.00023) -0.00190*** (0.00027) -0.00183*** (0.00029) -0.00161*** (0.00031) Cum_amountit-1 7.33e-07***
(1.86e-07) -8.36e-07** (4.16e-07) 8.57e-07** (4.17e-07) 8.93e-07** (4.22e-07) Average_pledgeit-1 1.93e-06
(2.10e-06) 2.44e-06 (1.91e-06) 2.51e-06 (1.88e-06) 2.35e-06 (1.96e-06) Nr_updatesit-1 0.28515*** (0.08718) 0.28791*** (0.08755) 0.27803*** (0.09417) 0.22884*** (0.10713) Till_targetit-1 -1.35605*** (0.09281) -1.26926*** (0.09699) -1.33614*** (0.09863) -1.48044*** (0.10254) ln(Ownership_from_minit-1) -0.17578*** (0.04729) -0.18949*** (0.04734) -0.21723*** (0.05051) -0.26341*** (0.05380) Cum_amountit-1 *Minimum_targeti -3.98e-12*** (8.84e-13) -3.77e-12*** (9.50e-13) -3.11e-12*** (1.02e-12) Cum_amountsit-1 *Minimum_equityi -4.00e-06 (4.97e-06) -8.23e-06 (6.77e-06) -0.00002** (8.49e-06) Cum_amountsit-1 *Stage_seedi -4.13e-07 (5.12e-07) -1.86e-07 (5.02e-07) 2.96e-07 (4.97e-07) Cum_amountsit-1 *Stage_earlyi 2.42e-06*** (3.83e-07) 2.41e-06*** (3.84e-07) 2.43e-06*** (3.86e-07) Number of Observations 10187a) 10187a) 6156 3857 Log-likelihood -7611.4568 -7587.6677 -6532.3161 -5463.2917 Number of Pitches 123 123 80 53
Table 4 - Estimation Results (Average Marginal Effects).
Note: All specifications include a constant term. Standard-errors in parenthesis. *** denote p-values < 0.01, ** denote p-values < 0.05, * denote p-values < 0.10.
32
In the table presented above the results of the regression model estimations are presented. Note that the negative binomial regression model models the logarithm of the expected count of the dependent variable, expressed as a function of the explanatory variables. Therefore, one should interpret the coefficients presented as follows: when the considered independent variable changes by one unit, the logs of the expected counts of the explained variable are expected to differ by the coefficient of the given independent variable.
In line with Chen et al. (2017), one’s results present evidence that the investment decisions visible in a campaign on a certain day, indeed have an impact on subsequent investment decisions. The lag of the number of investments taken as a predictor of the number of investments yields a statistically significant estimator, at a 1% level of significance, in all four model specifications, suggesting an inverted U-shape relationship between the number of investments made on day t-1 and the number of investments made on day t. This inverted U-shape relationship is inferred from the negative signal of the estimate of the quadratic term of the referred explained variable (as simple as it can be exposed: y= x – x2). Therefore, one finds evidence that confirm hypotheses
1a and 1b, finding that funding momentum arises throughout a campaign and has a positive influence on subsequent investments, although the relationship is not linear.
Following, and in line with previous studies (Agrawal et al., 2014; Chen et al., 2017), one finds that the total number of investments made up until day t-1, have a positive impact in the difference in the logs of the expected number of investments on day t, yielding statistically significant estimates for the four model specifications, at a 1% significance level. This result comes in support of the hypothesis 2a, suggesting that the crowd behaves in a herding manner taking into account how many investments were already made before making the decision to invest.
Perhaps somewhat surprisingly, one finds that when considering the three specifications of the full model, the two variables previously discussed yield lower coefficients in the case where we only consider successful campaigns. Only considering successful campaigns, one would expect the opposite effect, that is that the herding behaviour would be more, rather than less, prevalent in predicting the outcome of the explained variable and would have a higher impact on funding momentum. In other words, one would expect herding behaviour to be less intensive in unsuccessful campaigns which would yield a lower estimate for the coefficient when considering the full sample. On the other hand, one cannot infer this from the models specified since the comparison is not between unsuccessful and successful campaigns. What is being considered is the “power” of the estimates in predicting the outcome of the explained variable in successful campaigns comparing to the full sample. One could only infer this by the summary statistics presented in the previous section.
As for the cumulative amount raised until day t-1, one finds that this predictor is statistically significant to the model, impacting positively the difference in the logs of the expected number of investments on day t. The estimator yields statistically significant estimates of the explained variable, at a 1% significance level, for model specification (1). When we introduce the interaction terms with time-invariant covariates, the estimates yielded by this regressor are statistically significant but only at a 5% level. This was partially expected because the interaction terms are defined as the product of the time-invariant covariates with the cumulative amount of investment, which inevitably raises correlation between this variable and those same variables. The results one obtained for this regressor support hypothesis 2b, suggesting that there exists herding behaviour among investors, whom take in consideration how much was raised until the considered moment.
34
One finds no relation between the average pledge on day t-1 and the number of investments on day t. Since in the case of platform Invesdor one cannot see how much each investor has pledged, using the average pledge as a way to control for large investments was not a viable method. This might be because investors associate large pledges with specialized investors, an assumption that they cannot infer from an average pledge unless they monitor the campaign every single day, which is, most likely, not the case. Therefore, one finds no empirical support of hypothesis 2c.
The estimator of the percentage left unfunded on day t-1, has a statistically negative impact (at a 1% significance level) on the propensity of investments on day t. This estimate confirms the result obtained by Chen et al. (2017): when a campaign is closer to reaching its funding goal, the propensity to invest increases and when it is far it decreases. This comes in support of hypothesis 2d, highlighting that investors behave in a herding manner having few incentives to invest when the campaign has not gained momentum.
As one would expect from the results and conclusions of other studies (Block et al., 2018; Cordova et al., 2015; Hornuf & Schwienbacher, 2017), the number of updates to a pitch yields a positive, statistically significant estimate (at a 1% level of significance) of the difference in the logs of the expected number of investments on day t, on campaign i. One would expect this result since the number of updates posted in a pitch’s webpage can serve as a proxy for the availability of new information. This can be perceived specifically, and when the update is relevant enough, as the reduction in information asymmetry, which corroborates hypothesis 3.
One defined the variable ownership from minimum investment which is an estimator that controls for the share dilution that occurs when a campaign goes into overfunding. As expected, when the ownership investors get from the minimum investment on day t-1 decreases, so does the log of the expected
number of investments on day t. These results yield that investors, in fact, take into consideration the dilution of shares that occurs once a campaign enters in overfunding before they make the decision to invest. This verifies hypothesis 4: indeed, like in early-stage VC and BA, investors consider the share dilution they might suffer. This affects negatively the funding momentum and the propensity to invest. Furthermore, the effect of this variable is even more accentuated when only considering successful campaigns, which further confirms hypothesis 4. Although investments might be of small order, results yield that ownership is an important determinant of investments decisions and a possible disrupter of funding momentum.
Now analysing the time-invariant control variables, firstly, one can infer that the minimum amount sought by a firm negatively influences investment decisions. One reason for this is that the higher the funding target, the more investors will have to invest and the more difficult it will be to raise the funds necessary. Therefore, setting a reasonable funding goal is an important decision that might affect how the funding dynamics of the campaign will happen. As for the minimum equity offered, we only find a statistically significant estimate in the specification model with only successful campaigns.
Finally, the stage of the company seems to have an influence if the company is in the early stage of its development.