UNIVERSIDADE CATÓLICA PORTUGUESA, FACULDADE DE CIÊNCIAS ECONÓMICAS E EMPRESARIAIS
Equity Research:
Portugal Telecom
Carlos de Oliveira, 152111116
Dissertation submitted in partial fulfillment of requirements for the degree of MSc in
Business Administration, at the Universidade Católica Portuguesa, January 2013
Advisor:
1
i. Abstract
In the distinct fields of valuation, and in particular in Equity Research, theory and practice should be accurately combined as way to obtain the most consistent outcome which adheres to reality. The present dissertation aims at answering this need through bridging the review of relevant literature with the valuation of the leading telecommunications operator Portugal Telecom in practical terms. The year-end 2012 price target derived from the company’s stock is 5,01Euro per share, implying a Buy recommendation. Caixa Banco de Investimento’s
research is additionally analyzed and used as basis for comparison for both the methodologies followed and results yielded.
2
ii. Preface
I would like to express my gratitude to Professor José Tudela Martins, for the constant
availability, for the helpful feedback, and useful orientation; to Mr. Francisco Fonseca da Silva, for the invaluable knowledge and expertise transmitted, as well as for the availability and willingness to help; to Mr. Rogério Celeiro, for the enlightening discussions and the support provided; to Mr. Nuno Vieira, PT’s Investor Relations Officer, for all the information provided and further collaboration; and to my Family for the instilled motivation that is always needed to succeed.
3 iii. Contents 1. Introduction, 5 2. Literature Review 2.1 Comprehensive Framework, 6 2.2 Introduction , 7 2.3 Valuation Models, 8
2.3.1 Discounted Cash Flow Valuation, 9 2.3.1.1 Firm Valuation
2.3.1.1.1 Free Cash Flow to the Firm (FCFF), 10
2.3.1.1.2 Adjusted Present Value (APV), 13
2.3.1.1.3 Excess Return Models, 15
2.3.1.1.3.1 EVA, 6
2.3.1.1.3.2 Dynamic ROE, 6 2.3.1.2 Equity Valuation
2.3.1.2.1 Free Cash Flow to the Equity (FCFE), 16
2.3.1.2.2 Dividend Discount Model (DDM), 17
2.3.2 Contingent Claim Valuation, 18 2.3.3 Relative Valuation, 18
2.3.4 Cross Border and Emerging Markets’ Valuation, 20 2.4 Conclusion, 21
3. Macroeconomic Environment
3.1 International Economic Background, 22 3.2 Economic Activity in PT’s Main Geographies
3.2.1 Portugal, 25 3.2.2 Brazil, 27 3.2.3 Africa, 28
3.2.3.1 Angola, 28
4. Industry
4.1 Global Telecommunications Sector, 29
4.2 European Telcos at a glance: Cash Flows and Dividends Under Pressure, 31 4.3 Telecommunications Context in Portugal, 32
4.4 Competition, 33
4.4.1 Competition Facing Portugal Telecom’s Portuguese Operations, 33 4.4.2 Competition Facing Oi in Brazil, 38
4.5 Telecommunications Context in Africa, 42 4.5.1 Angola’s Case, 43
5. Company Overview
4
5.2 Strategy, 48
6. Risks and Uncertainties, 50
7. Regulatory Background, 52
8. Portugal Telecom Valuation, 53
8.1 Model: Opacity and Uncertainty, 54 8.2 Methodology Approach, 55 8.3 Valuation Process 8.3.1 Operating Revenues, 57 8.3.2 Operating Costs, 65 8.3.3 EBITDA margin, 68 8.3.4 Capital Expenditures, 69 8.3.5 Net Working Capital, 70 8.3.6 Financial Analysis, 70 8.3.7 Income Taxes, 73
8.3.8 Depreciation and Amortization, 73 8.4 DCF Assumptions
8.4.1 (WACC) Cost of Capita, 73 8.4.2 Cost of Equity, 75
8.4.3 Cost of Debt, 77
8.4.4 Remark on Perpetuity Inputs, 78 8.5 (SOTP) Valuation Results, 78
8.6 Sensitivity Analysis, 79
8.7 Other factors to influence the valuation outcome, 81 8.8 Difference between Market Price and Valuation Price, 82 8.9 Multiples Valuation
8.9.1 Peer Group Presentation, 83 8.9.2 Relative Valuation, 84 8.10 IB Valuation Comparison, 84 8.11 Investment Case, 87 9. Conclusion, 88 10. Appendix, 90 11. Glossary, 128 12. References, 131
5
1. Introduction
It is the purpose of this dissertation to value Portugal Telecom, a leading operator on the telecommunications industry in Portugal, holding an increasing international exposure in distinct geographic areas. Aiming at fulfilling this task, some guidance is provided resorting to a DCF-based Sum-Of-The-Parts valuation, as well as a year-end 2012 recommendation on the stock price.
This dissertation is structured into two main parts referring to its two main objectives: reviewing the fundamentals of the state of the art through a careful but comprehensive literature selection; and combining this theoretical knowledge with the methods that best fit the company profile and thus allow for a robust valuation.
In this sense I have tailored the necessary research to what I pursed as the most valuable from a scientific perspective, and as the most significant for the equity research process, taking into account the company’s type of assets, the international investments, the industry specificities, and the nature of its business model.
Accounting for all the details, the dissertation proposal is as follows. It begins with the literature review (chapter 2) and its followed by an overview of the macroeconomic environment (chap. 3). In chapter 4 the main characteristics of the telecommunications industry are presented, trends and competitive structure are analyzed, as well as the key drivers for the sector. The business profile and the company’s strategy (chap.5) are then presented into an attempt to make an overview on PT. In chapter 6 the main risks and
uncertainties related to PT’s operational and financial performance are covered, followed by a description of the regulatory background in force (chap.7).
Chapter 8 -Portugal Telecom Valuation- exposes the assumptions and its linkage to the main value drivers. The approach is presented, the sensitivity analysis is described, and the IB valuation comparison and the derived final conclusions are also among the topic addressed under this title. The valuation results are derived in this chapter and a multiples valuation is also performed. Finally, the Investment Case for PT is built, based on the strengths,
weaknesses, opportunities, and threats that influence the stock performance.
Chapter 9 presents the conclusions. Additional information on the company, including the financial statements forecasts, is compounded on the Appendix (chap. 10). The overall work is completed by the information detailed on the Glossary (chap.11), followed by the used References (chap.12).
6
2. Literature Review
2.1 Comprehensive Framework
In corporate finance it is explicitly assumed that managers’ primary concern is to create value for the shareholders (Neves, 2002). Since the 1980’s that the enterprises’ financial reports increasingly reflect this desideratum, and more often the business managers publicly assume for that to be their role.
In this sense, company valuation, corporate strategy’s valuation and managers’ performance valuation in creating value for the shareholders are matters that continuously occupy the agenda of general business and demand for the mastery of the respective financial instruments.
The firm valuation techniques in Portugal have also gained prominence as a result of the changes occurred in the corporate structure in various fields, including the privatizations, the development of the capital market, by the creation and development of a market for mergers and acquisitions, the processes of recovery and liquidation of companies with equity
participation of third parties, the dissent among shareholders, by the participation of venture capital funds in companies, agreements to repurchase shares to companies of venture capital and private equity funds, the projects of creation of companies (start-up) and for its financing, among others.
In addition, the valuation and simulation techniques can be used in the evaluation of the strategies to be adopted. Operating companies and companies being created (start-ups) need to adopt criteria for the selection of their strategies, and value creation is the most consistent criterion with financial theory, economic efficiency and the interests of the shareholders (Copeland, 2000). The explosion of companies from the called “new economy” with high growth expectations, stressed more the paradigm of the insufficiency of discounted cash flows in the presence of real options.
In the same line of thought, Fernandez (2007) argues that valuation is a key component of corporate finance literature, recognizing the importance of valuation as a mean to identify sources of economic value creation and destruction within the company. Furthermore, Damodaran (2006) utters that valuing companies is at the heart of what is done in finance, recognizing the importance of valuation to ensure efficient markets, effective corporate governance and appropriate capital budgeting decisions.
7
2.2 Introduction
Since great importance is attributed to valuation within the financial world, it could be
expected that there was a simple and well-structured way to follow and in the end the desired outcome would be easily obtained. In reality, the broader scenario involves a greater deal of complexity. There are several different methods carrying their own advantages and
disadvantages.
Managers, investors, owners and researchers of corporate finance are looking for several decades to provide a technical answer to determine the value of a company. However, the results are not totally satisfactory, since the value of a company or an asset is the result of the balance between what buyers are willing to pay for the purchase and what the sellers accept as the sale price as before the alternatives they have. Thus, in the valuation process intervene not only objective factors but also subjective and contingent phenomena. In this way, by seeking to streamline the process of calculating the value through specific techniques, the analyst should look forward to know the environment in which the valuation takes place. Under Luehrman’s (1997) view, every valuation method includes three fundamental factors – cash, timing, and risk – although each specific situation presents different challenges.
Virtually all the valuation approaches are similar in the sense that every single one is no more than a different way of expressing the same underlying model (Young, 1999).
As stated by Modigliani & Miller (1958), “though different in outward appearance, the various formulas can be shown to be equivalent in all essential aspects.”
According to Young and Sullivan (1999), there is not one single theoretically correct model and no single approach is likely to be consistently more reliable. Moreover, it should be the
robustness to data imperfections governing the choice between approaches. In the end, the solution could go through considering many approaches and not just one.
Another relevant issue to be taken into account in choosing a model concerns the adoption of the one that better addresses the scenario under analysis. In the same line of thought, it is argued by Young (1999), that a possible reason for the existence of numerous approaches to valuation is related to the fact that different models enhance different aspects of the valuation at the expense of obscuring other aspects.
8
2.3 Valuation models
It is consensual that the spectrum of approaches to valuation is vast and it would be of no practical use to treat them all extensively in this section. In this sense, the following discussion of valuation approaches will be narrowed to the most relevant ones under the topic-related specificities.
Bringing some structure, (Damodaran, 2002) and (Fernandez, 2007) propose a clear segmentation to valuation models. In broad terms, there are four main approaches to valuation.
The Discounted Cash Flow (DCF) valuation, relates the value of an asset to the present value of expected future cash flows on that same asset. The Relative Valuation estimates the value of a company or group of assets by using comparable firms’ common variables like earnings, cash flows, book value or sales. The Asset-Based Valuation is built through valuing existing assets of a firm, considering the accounting estimates of value or book value often used as a starting point. And finally, the Contingent Claim valuation or Real Option valuation, which takes into consideration option pricing models to measure the value of assets that contain option characteristics.
Notwithstanding, the relevance of the last two approaches is limited in the context of this dissertation. In what takes to the Asset-Based Valuation, the choice to disregard it is based on the fact that usually this approach does not reflect the value of expected growth potential. As Damodaran (2005) defends, “liquidation valuation is likely to yield more realistic estimates of value for firms that are distressed, where the going concern assumption underlying
conventional discounted cash flow valuation is clearly violated. For healthy firms with significant growth opportunities, it will provide estimates of value that are far too conservative.”
Regarding Contingent Claim Valuation, it derives from the DCF model and is especially valuable to estimate the value of operating and strategic flexibility, which includes for instance,
abandoning operations, opening and/or closing plants, or natural resources exploration and development (Copeland, 2000), which does not reflect PT’s reality. Furthermore, as advocated by Keenan and Copeland (1998), the majority of attempts to apply the mentioned method have been too simplistic to address the complexity of the decisions faced by managers.
9
Figure 1 : Valuation Models
Source: Damodaran, 2002
2.3.1 Discounted Cash Flow Valuation
The DCF is generally regarded as the best technique to estimate the value of corporate assets (Luehrman, 1997). According to Vernimmen (2005), the DCF valuation consists of applying the investment decision techniques regarding Net Present Value (NPV) to the estimation of the firm’s value. It basically states that the value of an asset as of today equals the expected future cash flows that the asset is expected to generate, discounted back at a rate that properly reflects the riskiness of those streams.
Valuing a company resorting to the DCF may presume the use of different expected cash flows, which carry different risks and, therefore demand different discount rates. Since we are making a valuation of the same firm, we should get the same result, independently of the expected cash flows in use (Fernandez, 2004). Moreover, another aspect shared by all the DCF approaches is related to the existence of two distinct periods that compose the analysis: the explicit forecast period, when the cash flows are estimated and discounted accordingly; and the period characterized by the cash flows stabilization, giving rise to the basis to predict a stable growth rate that stands in the essence of the terminal value concept.
According to Damodaran (2002) DCF analysis can be sectioned in three main types: the Adjusted Present Value model, which uses the unlevered cost of assets as the discount rate; the Free Cash Flow to the Firm, using WACC as the appropriate discount rate, and the Free Cash Flow to the Equity model using as discount rate the Ke.
10
2.3.1.1 Firm Valuation
2.3.1.1.1 Free Cash Flow to the Firm (FCFF)
The FCFF is the most commonly accepted version of the discounted cash flow method. In the words of Damodaran (2005), “The value of the firm is obtained by discounting the free cash flow to the firm at the weighted average cost of capital. Embedded in this valuation are the tax benefits of debt (in the use of after-tax cost of debt in the cost of capital) and expected additional risk associated with debt (in the form of higher costs of equity and debt at higher debt ratios).”
The weighted average cost of capital (WACC) is the minimum rate required by the firm’s sources of funding (Vernimen, 2005). In other words, it is the cost of capital to the firm. Furthermore, it assumes that, the risk involving the tax shields and debt is the same. It can be calculated through the use of the Capital Asset Pricing Model (CAPM), which determines the value of the needed components.
The CAPM builds on the model of portfolio choice developed by Harry Markowitz (1959). It is the most commonly accepted model dealing with the relationship of risk and return, which measures the market risk through the company’s beta measured relative to a market portfolio (Fama and French, 2004). This model is based on the assumption of a well-diversified investor whom requires a compensation for the risk added to his portfolio, which is calculated through the company’s beta (Damodaran, 2002).
This is regarded as one of the most frequently used valuation methods, mainly due to the simplicity associated with the WACC concept. As stated by Graham and Harvey (2001), one of the reasons it has been so consensual and rottenly adopted is that it works without significant disruption in a target debt-to-equity ratio scenario, representing the case of most companies. On the other hand, and supported on a similar reason, its effectiveness has been widely criticized by several academics and practitioners due to the model’s inflexibility when faced with a changing capital structure. Though applicable, the company value would need to be constantly revised, since the WACC depends on value weights, further hindering the WACC estimation (Ruback, 2002).
If the capital structure changes, the WACC will change to, through the debt-to-equity ratio and, consequently, the cost of equity. Accordingly, an increase in leverage will increase the risk faced by equity-holders given the priority of debt payments over cash flows to equity.
11 Consequently, the cost of equity will increase, since the company’s levered beta reflects the company’s risk (Koller, 2005).
It should also be noted that FCFF is an indirect valuation method, meaning that non-equity claims shall be subtracted to the enterprise value to know how much equity is worth (Koller, 2005).
2.3.1.1.1.1 Beta (β)
The calculation of the beta is a major obstacle in the use of the CAPM model. In an efficient portfolio, a diversified one, what is left in terms of risk (the “non-diversifiable risk) is commonly known as systematic risk. It is exactly this part that is measured by beta (MacQueen).
In the process of obtaining the appropriate beta it should be considered that “for well
diversified investors, it is not the isolated equity risk of the individual corporation that counts, but rather its contribution to the risk of a diversified equity portfolio. The risk of almost all managed equity portfolios looks very much like the risk of the market portfolio of all equities; that is, their risk is very highly correlated with the risk of a market index.” (Rosenberg and Rudd, 1982). Since there is no such thing as an index that encloses all the equities, a proxy like S&P500, a broad stock market index, is employed.
Several methods can be applied on estimating the accurate value for the beta. Within those the Method of Similars can be counted. It is one of the most used, and is basically the result of a weighted average of the betas from companies that operate in the same business and have an overlap of characteristics. Relying on such premises, this method encloses some limitations, being the most evident, the arbitrariness and possible inconsistency in attaining a solid group of comparable firms. Farther, the criticism does not stop here, with some voices arguing that this approach is unduly dependent on the historical behaviour. Even if the leverage or the business mix remains unaltered, firms tend to grow across time, which creates the basis for operating structures to change, implying a different beta (Damodaran, 2002). For that very reason, the Bayesian approaches presents itself as a valid alternative for estimating the beta, being achieved through a weighted average of the historical beta and a beta of 1.0.
Adding to the list, it is proposed by Rosenberg and Rudd that the beta movements are correlated mainly with four factors, these being, growth, earnings variability, financial leverage, and size.
12
2.3.1.1.1.2 Equity Risk Premium (ERP)
The risk premium is a fundamental and critical component in valuation. It can be influenced by a set of determinates enclosing: investor risk aversion, behavioural components and
macroeconomic volatility (Damodaran, 2008).
Three approaches that can be used to estimate risk premiums shall be presented, these being: “the survey approach, where investors or managers are asked to provide estimates of the equity risk premium for the future, the historical return approach, where the premium is based upon how well equities have done in the past and the implied approach, where we use future cash flows or observed bond default spreads to estimate the current equity risk premium” (Damodaran, 2008). Hence, the estimated premium can vary widely across approaches. Some theorists hold a different view over these matters, and they argue that the country risk should be reflected in the cash flows projections and not in the discount rate, by considering different scenarios. As developed above, Damodaran (2008) disagrees with this prespective advocating that creating different scenarios for the cash-flows will lead the expected cash-flow outcome to be riskier and thereby, claiming for an extra risk adjustment.
Goedhart (2003), considers that there is not a single correct method that has proven to be appropriate for every scenario, and in this sense the choice depends on the valuation at issue and its specificities, given that what is valid on the short-term may not be in a longer run. Damodaran (2002) suggests using a market risk premium for developed economies that ranges between 5 and 5.5 per cent, value that is commonly used by analysts.
2.3.1.1.1.3 Risk-free Rate (Rf)
For an investment to be considered as being risk-free, it has to fulfil two conditions. The first is that the cash flows should carry no risk of default with them. The second presupposes the nonexistence of reinvestment risk in the investment. Accordingly, the actual return is always equivalent to the expected return in such an investment.
The significance of the risk-free rate in what takes to valuation rests on the cost of equity and cost of debt estimation.
Based upon the previously described criteria, the effective risk-free rate to be used in order to attain the expected returns should be a default-free zero coupon rate that is matched when
13 the cash flows that are being discounted occur. In the words of Damodaran (2008), “in
practice, however, it is usually appropriate to match up the duration of the risk-free asset to the duration of the cash flows being analysed. In corporate finance and valuation, this will lead us towards long-term government bond rates as risk-free rates”.
Aligned with the described view, Copeland (2000) advises the use of a 10-year Treasury bond, mainly for three reasons. The first is that when compared with a 30-year bond, it is has a lower liquidity premium, being less sensitive to inflation. The second is that, the 10-year Treasury bond is preferred to a short-term Treasury Bill, given that it is a long-term rate that frequently gets near the duration of the cash flow of the firm into consideration. And the third, this rate approximates the duration of the stock market index portfolio, reinforcing its consistency when bringing to the formula the beta and market premiums accounted.
However, problems contemplating the risk-free rate estimation can arise, and may these undergo the cases when long-term government bonds are not traded, or whenever these bond rates have some default risk affiliated. In order to quell these problems, Damodaran (2008) proposes doing the valuation in a different currency or still estimating the risk-free rate from forward markets or fundamentals. As for the second issue, the default spread should be deducted from the risk-free rate.
2.3.1.1.2 Adjusted Present Value (APV)
APV has its foundations on the work performed by Modigliani and Miller (1958), and it has been further developed by Myers (1974), following a consistent rational.
As Luehrman (1997) advocates, the APV model enforces a separation between the intrinsic value of the assets-in-place, and the value created by a favourable financial structure. The real strength of this approach lies in the relevant information it can provide, given that it allows not only to see how much an asset is worth but also whence the value comes from. The APV disaggregates the value of operations from the value of the financing side effects.
Aligned with the above perspective, Damodaran (2006) utters that in opposition to typical DCF valuations, which reflect in the discount rate the effects of debt financing, APV initially values the company excluding debt and adding afterwards the benefits (tax shields) and costs of borrowing.
14 In this sense, the choice for the APV method in place of the WACC should essentially rely on a firm’s capital structure. When this crucial attribute is expected to change substantially over time, the APV appears as the most credible solution, the solution to be adopted, since this method permits to decompound the value of the firm into different parts, value them separately and sum them in a final phase, thus providing a clean and more informative value metric (Kottler, 2005).
Establishing a link with other approaches, Luehrman (1997) advances that, the DCF method, which adopts the WACC as the discount rate is deprecated, mainly because APV works when WACC does, and sometimes when WACC does not, since the APV does not require such restrictive assumptions as WACC. WACC is suitable only for the simplest and most static capital structures. In other cases (that is, in most real situations), it needs to be adjusted extensively. On the other hand, and stating that either the WACC equation or the equity cost has to be consistent with the assumed APV model, Booth (2007) argues that “it is a judgement call whether WACC is “better” than a particular APV model, but knowing one, we can always get the other”.
It should be noted that when a company opts for funding its operations resorting to debt it is making use of the tax deductibility of interest expenses, incorporating a tax benefit. However, on the other hand, by increasing the level of debt, the firm is also increasing the risk of bankruptcy.
One of the most difficult aspects to circumvent when adopting this methodology has to deal with agreeing on the most accurate discount rate, the one that better reflects the riskiness of the tax shields as well as the remaining components of the financing side effects.
2.3.1.1.2.1 Tax Shields
This topic is regarded as controversial within the existing literature, in the sense that there is no consensus around the right way to compute the value of tax shields.
Brought to discussion by Modigliani and Miller (1963), the first authors considering the benefit from debt financing, it was initially proposed to be obtain through discounting the tax savings at the risk-free rate, when looking at a no growth scenario.
15 Developing on this early work, several different approaches were presented. Harry and Pringle (1980), assuming that interest tax shields have the same systematic risk as the firm’s cash flows, suggested the use of the unlevered cost of equity, whereas Miles and Ezzell (1980) recommended a firm with a fixed debt-to-equity ratio to use the cost of debt in the first year and the unlevered cost of equity in the following periods.
Offering a different perspective, Myers (1974) and Damodaran (2006), building on the
assumption that the risk of the tax savings is equal to the one of debt, suggested using the cost of debt as the appropriate discount rate.
Ultimately, the estimation of the value of the tax shields can be seen as depending on the debt policy appropriated by the firm.
2.3.1.1.2.2 Bankruptcy Costs
Damodaran (2006) is pointed out as pioneer in what takes to considering the effects of bankruptcy costs in the final value of the firm. Subsequently, he divides this costs into two categories: the direct costs, those related with liquidation costs when the first approach bankruptcy, and the indirect costs, including the continual costs which are not related to bankruptcy but derive from the firm leverage.
The trouble in estimating those costs stems from the difficulty identifying the costs itself and its associated probability of occurrence.
According to Vernimmen (2005) the historical default rates supplied by the rating agencies, which associate a probability of default for each debt level, can be used to obtain the probability at issue.
Another possible approach, as advocated by Damodaran (2006) can go through at each level of debt, estimating a bond rating and use the empirical estimates of default probabilities for each rating, which is computed with recourse to the interest coverage ratio.
The expected bankruptcy costs can be determinant on the definition of the capital structure of a firm.
2.3.1.1.3 Excess Return Models
Excess return models have their roots in capital budgeting and the net present value rule. Actually, an incurred investment only add value if it NPV is higher than zero, what may imply
16 that cash flow growth as well as earnings are only valuable when they are escorted by excess returns, meaning this, returns on equity capital that surpass the cost of equity. Those models assimilate this conclusion further exploiting it and calculating the value of a firm as a function of the excess returns (Damodaran 2005).
Excess Return Models’ primary idea is to interpret the value of a business as being the sum of the invested capital and the excess return from both existing and future projects. This trait permits analysts to savvy whether the company is creating or destroying value.
It can de condensed into two main approaches, the Economic Value Added (EVA) and the Dynamic ROE.
2.3.1.1.3.1 EVA
“EVA is the financial performance measure that comes closer than any other to capturing the true economic profit of an enterprise. EVA also is the performance measure most directly linked to the creation of shareholder wealth over time” (Stewart, 1991). The Economic Value Added measures the excess return raised by an investment or by a set of investments (Damodaran, 2002). In order to make this model viable, it requires the articulation of three main building blocks: the return on capital, the capital invested, and the cost of capital (Burksaitiene, 2009).
Damodaran (2005) as many other authors, assert that the NPV and EVA are related.
2.3.1.1.3.2 Dynamic ROE
The Dynamic ROE is nourished by the same premises in which the EVA model builds. Its main difference is that it focuses on the equity side, being the excess returns the result of the difference between returns and cost of equity. Hence, this model enables us to verify when the company generates value for the shareholders (Damodaran, 2002).
2.3.1.2 Equity Valuation
2.3.1.2.1 Free Cash Flow to the Equity (FCFE)
The Free Cash Flow to the Equity is a direct valuation method which values the equity stake of the company. It consists in discounting the expected cash flows to shareholders (the cash flow
17 from assets after debt repayments and reinvestment needs), at a rate of return (cost of equity) applicable to the level of risk in the firm (Damodaran, 2006).
This model is aligned with the FCFF in what takes to its main handicaps. In both cases, the cost of equity will be influenced by changes in the capital structure through the company’s levered beta.
However and according to Damodaran (2006), when compared to FCFF, the FCFE model is more prone to errors. In fact, the FFFC is a pre-debt cash flow whereas the FCFE takes into account debt repayments and new issuances, being more vulnerable to the effects of the financial structure. As de author advocates, those components are harder to foresee than an optimal debt-to-equity ratio, crucial to perform the WACC calculations.
Nonetheless, in theoretical terms, and considering consistent assumptions in respect to debt financing, it can be asserted that both methods are equivalent (Fernandez, 2004).
2.3.1.2.2 Dividend Discount Model (DDM)
The Dividend Discount Model rests on the assumption that through the acquisition of shares, an investor aims to receive a selling price at the end of the holding period, and another type of cash flow, dividends (Damodaran, 2006).
This particular model reaches the value of equity through calculating the present value of the expected dividends, delineating consistent assumptions on the earnings future growth and payout ratio. If so, it can fail to be truly representative in situations where the company instead of distributing as much dividends as they can, opt to hold cash, which originate a scenario of misestimating the actual equity value (Damodaran, 2002)
DDM is widely appreciated by investors if we consider the dividends high level of tangibility when compared to distinct cash flows. Ultimately, and respecting all the enunciated premises, this could constitute one of the most accurate DCF models.
Despite all this, this approach can give rise to scenarios of overestimation of the results, particularly in cases where companies fund themselves to distribute dividends or, on the other hand, when holding cash that was available to be distributed to stockholders (Damodaran, 2006).
18
2.3.2 Contingent Claim Valuation
The Contingent Claim Valuation, or Option Valuation, is particularly relevant for its ability to value flexibility. It is also relevant when valuing projects or individual businesses that entail substantial levels of uncertainty and opportunities associated (Vernimmen, 2005). Even though it is not a regularly used method to value the entire business, it yields concrete advantages when applied to companies that only commercialize one type of product, that are in financial distress, or in a commodity based industry (Koller, 2005).
Option valuation is often used to make decisions such as whether or not to explore an
opportunity, regarding for instance, natural resources, new technologies or, R&D investments. It is therefore a crucial component in some businesses’ decision-making process (Luehrman, 1997).
Reinforcing the previous observation Damodaran (2002) states that “real options offer the right but not the obligation, to change an investment project and, in particular, when information on its prospective returns becomes available”.
There are several valuation models, including the binomial model or, the Black-Scholes model, which derives from the first.
2.3.3 Relative Valuation
In regard to relative valuation, an asset is valued taking into account the way other assets with similar characteristics are priced in the market. According to Damodaran (2006) this process is composed by three connected steps. First, one should look for similar assets which are priced in the market; second, it is important to scale the market prices to a common variable in order to obtain comparable standardized prices; and the third calls for adjusting for differences across assets when collating the standardized values.
The use of multiples yields some advantages when compared to other valuation methods. It overpasses the inherent difficulty in determining in an independent way the future cash flows, since when the basis of substitutability can be accurately determined; there are verily
comparable publicly traded transactions available and; when the multiple can be estimated reliably, this particular method would end up being superior to other valuation metrics, such as the discounted cash flow. It also avoids the issues associated with applying the discounted cash flow method of picking a theoretical-based model of the proper discount rate, which uses
19 historical data to estimate it, since the method of multiples adopts current market measures of industry growth rates and required returns (Baker and Ruback, 1999).
Following the same authors’ view, the relative valuation also contemplates some handicaps. One problem related to its implementation as to deal with finding the best basis of
substitutability, which varies from industry to industry because the underlying value drivers also differ across industries. This is commonly chosen on a qualitative way as a measure of financial performance (including revenues, earnings before interest taxes and depreciation, or cash flow), or as a measure of operating performance (like established reserves or
subscribers). Another one, regards measuring the multiple, what is typically done through the use of the simple mean or median of the multiples implicit in the market pricing of a group of publicly traded comparable firms or transactions. The last handicap, relates to the choice of a consistent peer group, inclosing truly comparable firms.
If by one side, through the use of multiples as a valuation metric, the practitioners may forfeit some of the benefits associated to the use a complete pro-forma analysis; on the other, they get a handy valuation heuristic that provides accurate results without incurring extensive time and effort costs. In fact, in accordance to Bhojraj and Lee (2002), it is possible to overcome the limitations in terms of information evidenced by this approach through a careful and
consistent selection of comparable firms. It is further argued that the composition of such group should be a function of the variables that drive cross-sectional variation in a given valuation multiple.
Hence, Cheng and McNamara (2000), Bhojraj and Lee (2002) and Bhojraj et al. (2003) argue that “picking comparables using a combination of industry categorization and fundamentals such as total assets yields more precise valuations than using just the industry classification”. Furthermore, this selection should include that apart from competing in the same market, those companies are subject to the same macroeconomic forces, and have similar profitability, growth, and returns on capital (Foushee, Koller and Mehta, 2012).
In what comes to deciding which type of multiples to use in performing the valuation, it is a fact that some multiples are considered better than others when comparing performance is the goal. In Foushee, Koller and Metha’s (2012) words, and by way of example, the P/E ratio is affected by differences in capital structures and non-operating items (such as write-offs and one-time events), which can be responsible for ambiguous conclusions if no adjustments are performed. Therefore, and by the fact that they are not by distortions affecting earnings, many analysts use other multiples like EV/EBITDA. In general, asset based multiples tend to be more
20 accurate and less biased in estimating the final values than sales and earnings multiples. The appropriateness and consequent superiority of enterprise-value multiples is advocated given the fact that both equity and debt are valued and in this sense, are less vulnerable to changes in capital structure.
Taking an opposite, supported by several studies, Liu (2002,2007) utters that the choice on the right multiple to use should lie on earnings multiples given that the resulting valuations are more accurate for the majority of the companies, supported by the increased availability of earnings forecasts. The same author advises the use of forward earnings instead of historical ones, since those explain stock prices well for a considerable number of firms.
Reconciling relative valuation with the discounted cash flows ones, it is relevant to stress that the difference in value from those methods arise from market inefficiency. In relative valuation it is assumed that the markets are correct on average, even if making mistakes on individual stocks, whereas in discounted cash flow valuation it is assumed that the market makes mistakes, which are corrected over time, and that these mistakes can occur across sectors or even the entire market (Damodaran, 2005).
Moreover, the discounted cash flow and the relative valuation, when used separately, can yield convergent results if the market is correct.
2.3.4 Cross Border and Emerging Markets’ Valuation
The rationale behind the deepening of this topic relates to the Portugal Telecom’s international expression.
It is of great relevance to begin by declaring that the major principles of valuation that apply to the conventional domestic capital budgeting are on their essence, equal to those conducting cross border valuations. Hence, the only applicable change concerns the application of the widely used standard valuation techniques.
Though, currency conversion is a great concern embodied on those types of valuation and therefore, should be incorporated into the analysis. This issue can be overcome by “explicitly forecasting exchange rates, converting foreign-currency cash flows, and then discounting at an appropriate home-country discount rate; or by appropriately incorporating the expected rate of change in exchange rates in the discount rate when discounting foreign currency cash flows” (Kester and Morley, 1997).
21 Apart from the exchange rate there are other components deserving some attention when dialing with such valuations, counting within many others: the choice of which cash flows, earned or remitted, to discount; possible divergence of the reporting standards; adjusting for foreign currency; the relevant tax rate and the amount of taxable income; capturing special financial benefits and costs associated with cross-border investments; and adjusting for various types of country risk (Kester and Morley, 1997).
As previously mentioned, the basic procedures used to estimate future cash flows discounted at the appropriate rate, are basically equal in every case. Yet, when emerging markets are equated, the ampleness of the involved risks may be considerably higher. According to Koller and Timothy (2000), not only the methods need to be adapted but also often require making arbitrary adjustments that are sustained by limited empirical evidence and even by gut feel. As pronouncedly stressed by Goedhart and Haden (2003), emerging markets are characterized by their exposure to some additional risks, among which are included, high levels of inflation; macroeconomic volatility; political distress; exchange rate fluctuation; regulatory change and; adverse fiscal laws. These set of factors influence decision making and involve changes to the traditional format of business valuation. However, “while individual risks in each country may be high, it is important to keep in mind that they have low correlations with each other. As a result, the overall performance of an emerging-market portfolio can be quite stable if investments are spread out over several countries”(Goedhart and Haden, 2003).
Commonly accepted is the fact that country-specific risks might affect different businesses differently, leading to very different valuations.
2.4 Conclusion
After presenting the main valuation methods and approaches it is crucial to identify the one that best suits the purpose of this dissertation. In this sense, it is of great importance to determine the company’s characteristics and frame it on the referring industry as a way to get the sense of the entire picture.
Aligning these thoughts with empirical evidence, the choice will relapse on an explicit multiperiod DCF method. Furthermore, since Portugal Telecom holds several investments in distinct geographical areas and has more than one business, a Sum-Of-The-Parts (SOTP) valuation should be used.
22 Exercising its influence on the decision-making process is also, among other factors, the
available data and the adopted financial policy. Once more, taking into account the relevant academic research, the DCF technique based on the WACC is largely preferred when dealing with stable, large, and not really high growth companies, which detain a defined dividend policy and a sustained target capital structure. Additionally, since this an acknowledged methodology within managers and other type of practitioners, it becomes considerably easier and at some extent less complex to established value added comparisons between company’s valuation outputs in broad terms, and more specifically in what takes to its main drivers and fundamentals.
Complementing the developed reasoning, it is worth noticing that despite the fact that multiples valuation is most of the times, and counting on the yielded advantages over other methods, the one adopted by practitioners, DCF can provide accurate results with a higher degree of adherence to reality, depending on the consistency of its fundamentals.
However, the multiples valuation will also be utilized as a way to validate the results obtained through the discounted cash flow approach, and to value the international investments hold by PT. The chosen multiple -EV/EBITDA- is one of the most commonly used valuation metrics and, among other reasons, it as an Enterprise Value multiple allow for direct comparison of different firms, opposing to the Equity multiples which are influenced by leverage.
3. Macroeconomic Environment
3.1 International Economic Background
Eurozone, over the last past years, has been clearly distressed by the sovereign debt crisis, which has severely affected the Southern European regions, in particular. Several
developments arise directly from this problematic phenomenon, such as the need from some countries like Greece, Ireland and posteriorly Portugal, of financial external support from the European Union (EU) through the commonly denominated “Troika”, composed by the European Central Bank (ECB), the International Monetary Fund (IMF), and the European Commission (EC). The dissemination and collateral effects of this crisis also affected other more peripheral economies such as Spain and Italy, and even though in minor proportions, some economies regarded as core, like France or Austria. This sovereign debt crisis not only contributed to a devastating reduction in liquidity in monetary and credit markets, as it
23 increased the risk aversion within the investors’ frame, which materialized in (a.) a decrease on the yields of some healthy economies like the German (ten-year bond declined from 2,963% in 2010 to 1,829% in the end of 2011), (b.) on the Euro’s depreciation against the US dollar (-3% in 2011), and (c.) on the increase of spreads of sovereigns considered to be riskier against the German Bond ; pronouncedly modifying the market trends.
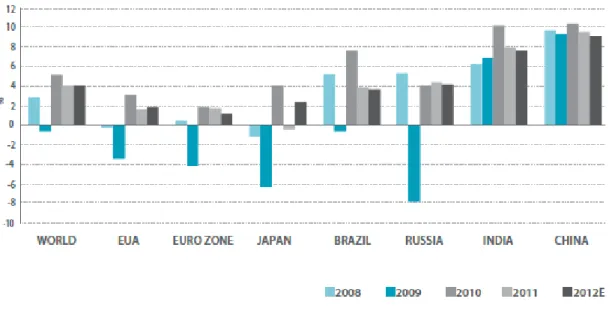
Figure 2: GDP Growth (%)
Source: IMF As a way of responding to the described situation, the ECB embraced a less restrictive policy, made effective through a reduction on the reference interest rate (two cuts of 25bp in the last quarter of 2011) and an injection of liquidity on the financial system, whereas the distinct European policy setters betted on budget control and fiscal consolidation.
Equity markets through reporting generalized losses throughout the main European indexes also evidence the importance attributed to this crisis. Portuguese Index, PSI20, was penalised by a 27,6% decrease. Less impacted were the US markets, given their better future economic prospects, and the ability to put into practice a more expansionary monetary policy by the hands of the Federal Reserve (FED). In other non-European markets such as the Brazilian, the declining pattern was once more followed, mainly due to their focus on inflation and price’s control (Bovespa declined 18,1%).
Accounting for other indicators such as inflation, it is possible to identify a declining pattern in late 2011, supported by a continuous fall in raw materials’ prices. Other indicator, the Brent oil price, increased from 94,91US dollars on the end of 2010 to 106,3 US dollars on the end of 2011, thanks to lower expectations on the global demand (see Appendix 1.1).
24
Figure 3: Main Economic Indicators
Source: IMF
3.1.1 Economic and Monetary Union – EUROZONE
After a period characterized by strong investment, which translated into an economy’s acceleration, the Eurozone faced a gradual slow down throughout the year, resulting in a contraction of the activity in the last quarter of 2011. Even though facing this scenario, the annual GDP growth in European economic area was 1,5%, registering a slight decrease when compared with the previous year’s of 1,9%. For this fact contributed a constant spectrum of heterogeneity that characterized this particular geographic area. In fact, if by one side the strongest economy in the Eurozone - Germany - kept growing at a 3% pace, on the other, the Southern European countries did not perform that good as a result of a strong fiscal
consolidation effort, registering negative GDP growth in cases like Portugal or Greece, and dejected growth in Italy and Spain. In fact, this deceleration in growth and activity contraction are due to a tightening of fiscal policy and inherent fiscal consolidation (deficit decreased from 6,2% in 2010 to 4,1% of GDP in 2011); a break in the exports trend, given the lack of demand in emerging economies; and the deterioration of other GDP components such as the private consumption and investment that succumb to higher levels of unemployment and to a more restrictive policy in what takes to credit access.
2010 2011 2012E 2013E 2014E 2015E 2016E 2017E
Portugal: GDP 1,38 -1,47 -3,25 0,35 2,1 1,9 1,9 1,5 Inflation 2,16 3,79 2,65 1,30 1,55 1,47 1,47 1,47 Unemployment Rate 10,8 12,74 14,43 13,96 13,16 12,38 11,7 11,1 Eurozone: GDP 1,87 1,44 -0,32 0,89 1,4 1,6 1,66 1,67 Inflation 2,21 2,75 1,86 1,46 1,65 1,72 1,76 1,81 Unemployment Rate 10,12 10,13 10,87 10,82 10,47 10,10 9,60 9,10 Brazil: GDP 7,53 2,73 3,03 4,15 4,00 4,12 4,10 4,10 Inflation 5,91 6,50 4,96 5,02 4,50 4,50 4,50 4,50 Unemployment Rate 6,74 5,97 6,00 6,50 7,00 7,00 7,00 7,00 Angola: GDP 3,41 3,40 9,66 6,75 6,67 6,63 6,06 6,16 Inflation 15,33 11,39 10,00 7,00 6,00 6,00 4,50 4,50 Main Indicators
25
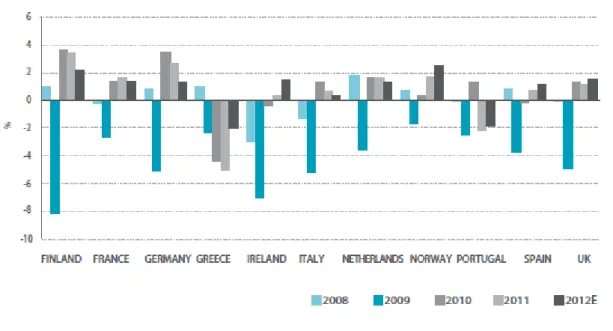
Figure 4: Eurozone GDP Growth (%)
Source: IMF Despite of this tardy growth, the core inflation in the Euro area was 1,4%. As for the annual average inflation rate, it increased from 2,2% in 2010 to 2,7% in 2011, mainly due to an increase in the energy and food prices. In line with this, the European Central Bank decreased the reference interest rates to 1% in the second half of 2011. In addition, the European monetary authority as response to the low levels of liquidity in the interbank markets and the lack of confidence evidenced by the various economic agents, took further action under the shape of acquisition of sovereign debt securities with resort to the secondary market and injection of liquidity in the banking system.
Embracing this overall situation, the Euro ended the year of 2011 devaluing against the US dollar, closing at 1,296 US dollars, after a period (first half of the year) when it strengthened.
3.2 Economic Activity in PT’s Main Geographies
3.2.1 Portugal
Deeply immersed in the economic and financial crisis, in 2011 Portugal faced the effects of declining economic growth and a costly financial external assistance program, the last resort to sustain the difficult period that the country is going through after the worsening of the funding conditions in the primary markets and an unstable environment well expressed by an
increasing risk aversion among investors in respect to the Portuguese sovereign debt. Align with the described scenario, the rating agencies have spoken out, downgrading the Portuguese sovereign debt, leading to a huge increase (from 6,6% in 2010 to 13,36% in 2011) in the yield
26 of the Portuguese sovereign 10-year bonds, reaching a spread of 11,54% against the 10-year German bund.
Figure 5: Portuguese Deficit as percentage of GDP
Source: Portuguese Ministry of Finance Managing its 78 billion bailout, the Portuguese government had to impose some severe measures in order to reach a set of pre-determined objectives. Following its implementation in May 2011 the financial adjustment program has been subject to several positive reviews by the Troika, composed by European Central Bank, the International Monetary Fund and the European Commission. In what concerns fiscal consolidation the process is being relatively well driven with the deficit numbers declining from 9,8% of GDP in 2010 to around 4 % in 2011. Aside from a group of extraordinary measures that were implemented (particularly the transfer of pension funds from banks), the fiscal consolidation process rests on a sustained effort to reduce expenditures, and a favorable tax revenue, respecting the forecasts. It is the government conviction that Portugal will return to the markets in over 2014.
Some structural reforms have also been carried into practice namely those involving the rental and the labor markets, as others targeted to stimulate competition in various markets.
This general process headed by the fiscal consolidation measures allied to a worsening of credit conditions resulted in a shrinking demand and consequently to a decline in the consumption patterns (public and private, of approximately 3% on average in 2011) and investment (around 11%). In what takes to the trade balance the deleveraging process continued, with the exports leading the process by registering a sustained growth of around 7% (in real terms) in the trading volume concerning the emerging markets, with emphasis on Africa, Asia and Latin America; and the imports lowering, what contributes to mitigate the external deficit.
27
3.2.2 Brazil
After growing 7,5% in 2010 the Brazilian economy showed a consistent performance despite the difficult environment affecting the international landscape, growing at 3% in 2011 as a result of a soaring middle-income class that has been gaining influence, and an effective effort targeting an income redistribution. In fact, the overall panorama in Brazil continues to be marked by a set of favorable conditions ravaging different aspects of the economy as it is the case of the labor market, which registered a low unemployment rate of about 6%, and at the same time saw the wages increasing by 5,2% in real terms.
Figure 6: Brazil GDP Growth (%)
Source: IMF Taking advantage of the willingness to buy of the emerging economies together with the developed countries’ liquidity injection on their central banks, the Brazilian economy was also able to enhance its exports (increasing by 26,8% and reaching record figures), favoring in this way its external trade balance (increase in trade surplus of around 47,8%) which mirrored higher commodities prices. Such attractive scenery can be even sounder if considering the future prospects driven by hosting major sporting events and the inherent dynamism linked to the necessary infrastructures, which will generate more opportunities and have a positive impact on the economy by attracting foreign investment.
Trying to take full advantage of this positive economic cycle the Brazilian Central Bank changed strategy incurring in an expansionary policy, decreasing the SELIC reference rate to 9,75%, as a way of defending the economic activity. Reflecting the strengthening process, inflation
28
3.2.3 Africa
African economies in general have responded quickly and effectively to the slowdown caused by the international crisis and are expected to grow at approximately 3,7% in 2011. A
particular region deserves to be extolled for its consistent economic performance, the Sub-Saharan Africa. Many countries within this geography are showing solid recoveries sustained by growing rates that are practically the same as the pre-crisis figures, however, some downside risks are make themselves more visible, namely the increasing exposure to commodity price swings and inflation.
3.2.3.1 Angola
As one of the forerunners of the African continent in terms of growth, Angola presents a growing economic activity (grew about 3,7% in 2011) sustained by a quality performance of the oil sector, being Angola the second largest player in Sub-Saharan Africa, which is possible primarily because of an expressive recovery in what takes to prices and its demand.
Figure 7: Angola GDP Growth (%)
Source: IMF Responsible for this economic growth is also the component of investments, mainly directed to building infrastructures in many distinct areas. Angola is nowadays one of the biggest receivers of foreign investment in Africa.
This overall picture aligned with improvement on the credit front, contributed to enhance the confidence in such country, which was translated in upgrades on the sovereign rating by the main rating agencies.
In what concerns other macroeconomic indicators, inflation kept its high figures in 2011, registering a considerable increase, which is due to prices of food and beverages (mainly
29 affected by difficulties in logistics and distribution). Regarding the currency, the Kwanza has valued against the Euro and did not oscillate much against the US dollar. Departing from this framing, the monetary authorities as a way of boosting the economy adopted an expansionary policy based on a discount rate reduction (see Appendix 1 for additional information).
4. Industry
4.1 Global Telecommunications Sector
The global telecommunications sector is characterized by a set of well-defined trends that constitute the basis for a changing environment.
Within these trends we count a considerable transformation of consumer habits which is mainly driven by technology. This event is the result of an increasing number of players in areas like telecommunications, media or technology that bet on internationalization and innovation. The focus of their strategy allows for a wider spectrum of intervention as well as greater offer in terms of products and applications forcing the appearance of new needs. This is further enhanced by the inherent promotion of interactivity materialized through the social networks, fostering the use of new and more devices.
Figure 8: Number of Devices in Portugal
Source: PT Innovation Conference,2012
The development of new networks and access technologies is only possible through considerable investments. Such investments are carried in specific plans contemplating technologies that are known to be more efficient in data transmission (allowing for higher access speed with lower costs associated), the New Generation Access Networks (NGAN), which include on the side of fixed business, the Fiber-To-The-Home networks (FTTH), and the Long Term Evolution (LTE/4G) on the mobile business side. These prospects are originating exponential data consumptions through various types of equipment (compatible with video,
30 data and voice) that call for new services. It is forecasted that globally the consumption of data will drastically increase in the medium term (5 times in the wireline and 65 times in the
wireless, until 2014).
Figure 9: Worldwide Data Consumption: Fixed Accesses Figure 10 : Worldwide Data Consumption: Mobile Accesses
Source: PT Consolidated Annual Report,2011 The consumption patterns are in this way being driven under new premises. The fast pace assumed in the technological world allied with the increasing availability of new devices is contributing to incremental internet users and linked usage, which is responsible for a higher bandwidth consumption, enhanced by the convergence of devices like TV, PC and mobile handset. This conjoint reality permits the brake through of the triple-play multi-screen concept in this industry, increasing the ability to be much of the time connected to the internet.
Figure 11: Worldwide Connected TV Penetration
Source: PT Consolidated Annual Report,2010
The telecommunications sector is expected to keep its growing patterns and in this way to set new competitive boundaries. Connectivity is therefore a key term in this new shape assumed by the sector, realized through the emergence of cloud-based services which join players from different areas that contributed for the same output (internet providers, equipment
manufacturers, and media). Notwithstanding the solid emergence of this trend allowing for the creation of new brands and players in the personal and residential services, and also covering the corporate (SMEs and SOHOs), the bet on traditional services is to keep.
31
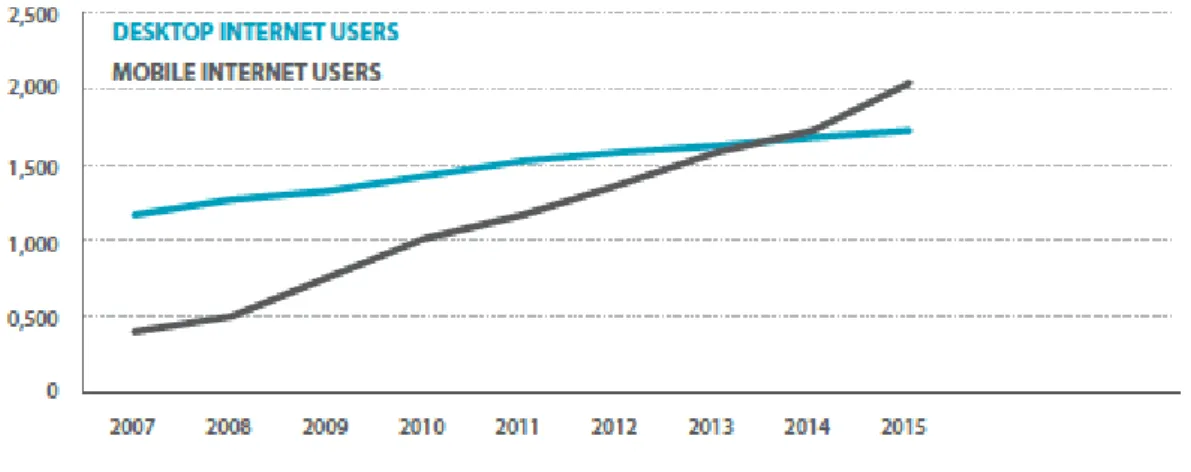
Figure 12: Internet Users (in Millions)
Source: PT Consolidated Annual Report,2011
4.2 European Telcos at a glance: Cash Flow and Dividends Under Pressure
The European Telecommunications sector has underperformed the wider European equity market by around 7%, positioning itself as the third worst performing sector in Europe, just behind Mining and Oil&Gas. This poor performance can be attributed mainly to two key factors. Firstly the European Telco sector suffered from a poor last quarter of 2011 reporting season with outlook commentaries from a number of incumbents implying meaningful downward forecasts to most of the players. This sector has on average seen EPS estimates falling 6% YTD, which constitute a much severe scenario than that from the wider market. With competitive pressures in some core mobile markets having intensified meaningfully, this has raised understandable concerns that deflationary pressures will continue to weigh on the sector to a great extent. Additionally, the possible forecasts downgrades combined with credit rating pressures, have forced some of the incumbent operators to lower their shareholder return commitments in 2011 and 2012.
It is regarded as a fact that the Telecommunications sector’s financial leverage is significantly higher than that of the wider market, which together with considerable off balance sheet adjustments, such as pensions and leases, leaves several players close to breaching their current ratings criteria and hence being subject to credit rating downgrades. This can have an immense effect on the companies’ strategies (including revising their dividend policy).
32
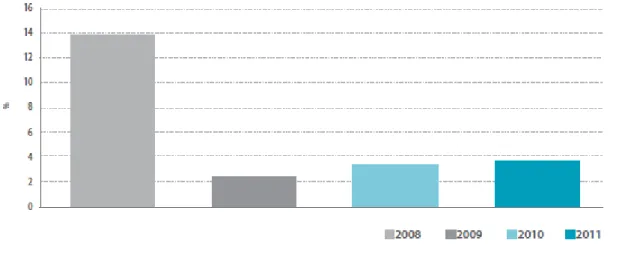
Figure 13:European Telecommunication Leverage Evolution: Net Debt/EBITDA
Source: JP Morgan Another relevant trend that raged the sector has to deal with EBITDA declines and its
compounding effect on the impact of credit rating risks. After the recent dividend cuts, pay-out ratios tend to be more sensible, which over time would seem to allow for some modest
reductions in net debt. However, what actually happens is that for most companies a resulting benefit on reported leverage ratios is completely neutralized by ongoing EBITDA decreases.
The cash flows associated to the Telecommunications sector have fallen by circa 20% since their 2007 peak, including a 6% decline in 2012. As a consequence, the sector’s EFCF yield has decreased from a historical level of between 12 to 13% to 10%, as of September 2012.
4.3 Telecommunications Context in Portugal
The telecommunications sector in Portugal is being marked by a continuous consolidation of bundled offers. The last four years were craved by a bet on the bundled offers by the majority of the players performing in this market, which are increasingly turning attentions to the joint reality of broadband, TV and voice, the so called triple-play. This action is mainly characterized by the presence of copper operators in TV segment, and the exploitation of the voice segment by cable operators. As a response to these new necessities, the main operators in Portugal
33 focused part of their efforts in improving the business related to data and voice, where PT stands as one of the most successful cases, achieving co-leadership in the pay-TV market. The Portuguese telecommunications reality does not distune from the trends evidenced throughout Europe, adapting its landscape with resort to investments directed towards fiber. In this field, Portugal Telecom, benefiting from a changed regulation (geographical
segmentation approach), should be highlighted since it covers around 1,6 million households with its FTTH service (refer to Appendix 2 for PT’s Positioning).
Figure 15:Service Revenue Composition for Leading European and US Mobile Operators
Source: Espirito Santo Investment Bank
4.4 Competition
PT competes in a sector that since 2000 (year when it was fully opened to competition) characterized as challenging and highly competitive. Detailed information comprising all business areas where PT act will be presented below.
4.4.1 Competition Facing Portugal Telecom’s Portuguese Operations
As a player inserted in the telecommunications world, PT faces intense competition from diverse operators. The main competitors in Portuguese soil enclose ZON, Vodafone (the Portuguese subsidiary), Sonaecom (more than half owned by Sonae, SGPS), Cabovisão (owned by a private equity group), Oni Telecom- InfoComunicações, SA, AR Telecom, and Colt.
34 As verified at a global level, in Portugal the telecommunications sector has also followed the trend and became more challenging and aggressive in what takes to competition. This is mainly due to the entrance of mobile operators on the fixed market business, and inversely to the emergence of fixed services providers within the mobile’s domain. Other factors like the increasing bet on diversification through the adoption of the bundled offers centered on the triple play (3P) services, have also contribute to the entrench of such environment. This has been adopted as a core part of most players’ strategy, with emphasis to PT (registered an increase of around 32,9% from 2010) and ZON (10,3% growth in relation to 2010), which record a membership of 36,9% and 60,1% of their fixed-line customers to 3P, respectively. Note that PT drives its competition based on price.
Residential Customers. This particular segment does not constitute an exception in the sense
that competition is fierce and tends to intensify, thanks to the fact that it comes from both sides, fixed and mobile services providers. Nowadays, as a result of the convergence in the existing offers, mobile network operators are able to match PT’s fixed line telephone offer and in this way target the same group of customers. Those operators have already gone further and are in position to practice lower prices through the creation of low-cost brands, which will not only impact the fixed-line business, as it will also attempt to reach the lower end of the market.
One end leads to the other, and as a response to the increase in competition, operators come up with new solutions. In what concerns the international telephone service, which has been watching its revenues being damaged owing to, for instance, competition from calling cards, and declining call prices, the answer goes through providing unlimited communications to all national numbers and to a large range of international fixed locations. This overall framing keeps pushing PT towards an international fixed line telephone price reduction.
The Portuguese fixed voice market is traditionally a direct access market and this trend is well consolidated as ANACOM’s figures show, pre-selection has registered the lowest number of lines in this configuration of the past ten years. According to the same source, PT has a 58,7% market share in this market, a slight decrease from 2010 (60,4%). PT also has around 56,7% market share in what concerns the outgoing traffic.
Based on the same source’s estimations, in 2011 PT has approximately 49,4% market share, and is the number one provider of fixed broadband Internet services, a sector with visible potential (more than 2 million users) that is already growing.
35
Figure 16: Portugal Fixed Broadband Market Share
Source: Bernstein Research
PT also performs well in other viable markets as it is the case of Pay-TV. This is an especially good example of a market that is characterized by a fierce competition which contributed to a recent change in strategies. It was initially regarded as a high-value market, but nowadays the strategy goes through creating new low-end offers, and opting for a price skimming tactic making it affordable to all the market segments, and at the same time, in order to keep the high-value customers, offering new free quality content (such as video-on-demand). This is a market which enclose around 3 million customers (around 51,7% of the total households), where PT detains a 35% market share (meaning a 5,1% increase from 2010), being the second player in this market just behind ZON who keeps being the market leader despite its decrease of 4% in market share from 2010 (current market share of 53,9%). The remaining direct competition has been struggling to keep its residual scores.
The figures presented above are the result of different strategies carried out by the various players. In PT’s case there has been a clear bet on a strategy based on a FTTH roll-out which proved effective enough to reach a number around 1 million households in 2011. ZON embarked on a different path turning its efforts towards its coaxial networks, aiming at upgrading those. Cabovisão assume a similar strategy whereas Sonaecom abreast Vodafone focused on developing their IPTV (leasing PT’s lines), centering their actions on fiber based networks in Lisbon and Oporto. The main common ambition transverse to all the players concerns retaining and in some cases acquiring customers at the expense of providing higher speed Internet.
36
Personal Customers. Portugal has one of the most dynamic markets in what takes to the
mobile business. With more than 150 active mobile cards per each group of 100 habitants, this market performance has been remarkable as a result of the innumerous offers available which cover most of the customer needs in this field. In this market PT competes through its mobile operator -TMN- with two major opponents: Vodafone and Optimus which benefit from their multinational status that translates into higher resources availability, a set of well spread best practices, and cost synergies, to make tuff competition to TMN, on the mobile market, and broadly to PT thanks their capacity to improve performance in fixed-line services. There are also two recently founded Mobile Virtual Networks Operators (MVNO), named ZON Mobile (tutored by Vodafone), and Phone-ix (launched by the CTT and supported by TMN).
Figure 17: Voice Revenue Forecast per Operator
Source: Espirito Santo Investment Bank
In 2011, TMN assumes a leadership position with around 44% market share as a result of a strategy focused on strengthening its share, even more when its main competitors are betted on gaining territory in a near future, marketing its services belligerently.
A revolutionary development that transformed this market in an even more competitive reality is linked to the introduction of the called “tribal plans” (introduced by Optmius first and followed by the remaining operators). Those plans consist of on-net pricing plans adaptable to each type of customers’ reality (TMN’s plan is known as “Moche”). Other innovative plans followed under the form of post-paid services and bundles including Internet. In TMN’s case this trend was materialized under the name of “e- e nunca mais acaba”, which allowed for all customers to adhere, increasing the number of minutes of usage on one hand, and negatively impacting per minute revenues on the other.