Universidade de Aveiro 2015
Departamento de Ciências Médicas
Márcio Gabriel Siva
Costa
Matriz enriquecida com RERMS da APP como
substrato de adesão para o crescimento de neurites
APP RERMS enriched matrix as an adhesion
substrate for neuritic outgrowth
Universidade de Aveiro 2015
Departamento de Ciências Médicas
Márcio Gabriel Siva
Costa
Matriz enriquecida com RERMS da APP como
substrato de adesão para o crescimento de neurites
APP RERMS enriched matrix as an adhesion
substrate for neuritic outgrowth
Dissertação apresentada à Universidade de Aveiro para cumprimento dos requisitos necessários à obtenção do grau de Mestre em Biomedicina Molecular, realizada sob a orientação científica da Professora Doutora Odete Abreu Beirão da Cruz e Silva, Professora Auxiliar com Agregação do Departamento de Ciências Médicas da Universidade de Aveiro.
Este trabalho contou com o apoio do grupo de Neurociências e Sinalização Celular do iBiMED, Departamento de Ciências Médicas, e pelo
Centro de Biologia Celular (CBC) da
Universidade de Aveiro, e foi financiado pelos
fundos JPND/0006/2011 BiomarKAPDua e
Dedico este trabalho aos meus pais por tornarem todo este percurso possível, Há minha avó por todos os valores que me passou. E aos meus amigos mais chegados pelo apoio.
o júri
presidente Professora Doutora Ana Gabriela da Silva Cavaleiro Henriques
Professora Auxiliar Convidada, Universidade de Aveiro
Professora Doutora Maria Helena Figueira Vaz Fernandes
Professora Auxiliar, Universidade de Aveiro
Professora Doutora Odete Abreu Beirão da Cruz e Silva
agradecimentos Gostaria de agradecer à Professora Doutora Odete da Cruz e Silva pela oportunidade de realizar este trabalho no laboratório de neurociências e por toda a sua orientação, encorajamento e conselhos durante a realização desta dissertação.
À Ana Roque por toda a ajuda no aconselhamento e execução de alguns procedimentos laboratoriais.
À Mariza por toda a disponibilidade e pela disponibilização de equipamentos necessários às práticas aqui executadas.
A todos os meus colegas de laboratório que sempre se disponibilizaram a ajudar quando necessário, e por todo o companheirismo e bom ambiente de trabalho criado.
Aos meus colegas de equipa do ADAC, em especial ao Ricardo Esteves, pela compreensão da minha ausência aos treinos durante a última época.
Aos meus amigos e companheiros Hélder Alves, José Mateus, e Sérgio Reguengo por tornarem este longo percurso muito mais fácil.
À Diana por toda a compreensão que teve, e pelo apoio incondicional nos momentos mais difíceis.
E principalmente aos meus pais que tornaram tudo isto possível, e por me apoiarem em tudo ao longo da minha vida.
palavras-chave APP, RERMS, matriz de adesão, crescimento de neurites
resumo Nas proteínas domínios específicos podem determinar as suas relações funcionais e estruturais. Na Proteína Precursora da Doença de Alzheimer (APP) já foram descritos vários domínios presentes em ambas as porções intra e extracelulares. Várias funções têm sido atribuídas à APP incluindo na adesão celular e no reconhecimento célula-célula. Isto coloca a APP em respostas biológicas chave como a transmissão sináptica. Tendo em conta estas funções, os domínios extracelulares merecem uma maior atenção. O domínio extracelular RERMS da APP é de facto um candidato provável para estar envolvidos nos processos fisiológicos acima referidos
Para investigar o papel do RERMS foi utilizada uma abordagem multidisciplinar. O péptido RERMS ligado ao PEG (polietileno glicol) através de uma reação de crosslinking, validada por FTIR (Fourier transform infrared spectrometry). A FTIR provou ser a técnica mais eficiente para a validação desta reação porque apenas necessita de uma gota de amostra, e providencia informação acerca das reações ocorridas numa mistura. O resultado obtido consiste num espectro de radiação infravermelha da amostra, onde as posições dos picos dão informação acerca da estrutura das moléculas, e a intensidade dos picos está relacionada com a concentração das moléculas. Subsequentemente foram preparados substratos com PEG e RERMS, plaqueadas células SH-SY5Y (células de neuroblastoma humano) e induzida a sua diferenciação. Foram claramente evidentes várias alterações morfológicas. O péptido RERMS causou uma morfologia mais achatada e a arquitetura do citoesqueleto ficou alterada, com o aparecimento de fibras de stress, um indicador da reorganização da actina.
Dadas as adesões focais desempenharem um papel chave na determinação da estrutura celular, foram investigadas diretamente.
A Cinase de adesão focal (FAK) é uma das proteínas mais expressas no sistema nervoso central (CNS) durante o desenvolvimento. Esta proteína foi descrita como crucial para a migração radial dos neurónios. A FAK pode ser localizada nos cones de crescimento e medeia a resposta a sinais atrativos e repulsivos durante a migração. Um dos mecanismos através do qual a FAK fica ativa é a auto-fosforilação no resíduo tirosina 397.
Tornou-se evidente que na presença do péptido RERMS houve um aumento da marcação da pFAK (FAK fosforilada) nas adesões focais e mais adesões se tornaram evidentes. Além disso também aumentaram as estruturas arredondadas de pFAK no núcleo na presença do RERMS. Estes resultados indicam que o domínio RERMS da APP tem um papel critico na determinação de respostas fisiológicas celulares.
Aqui é sugerido um modelo onde o domínio RERMS da APP é reconhecido pelas integrinas e medeia desta forma respostas intracelulares que envolvem a FAK, a talina, a vinculina e filamentos de actina. Este mecanismo é uma
keywords APP, RERMS, adhesion matrix, neurite outgrowth
abstract Specific domains can determine protein structural functional relationships. For the Alzheimer’s Amyloid Precursor Protein (APP) several domains have been described, both in its intracellular and extracellular fragments. Many functions have been attributed to APP including an important role in cell adhesion and cell to cell recognition. This places APP at key biological responses, including synaptic transmission. To fulfil these functions, extracellular domains take on added significance. The APP extracellular domain RERMS is in fact a likely candidate to be involved in the aforementioned physiological processes. A multidisciplinary approach was employed to address the role of RERMS. The peptide RERMS was crosslinked to PEG (Polyethylene glycol) and the reaction validated by FTIR (Fourier transform infrared spectrometry). FTIR proved to be the most efficient at validating this reaction because it requires only a drop of sample, and it gives information about the reactions occurred in a mixture. The data obtained consist in an infrared spectra of the sample, where peaks positions give information about the structure of the molecules, and the intensity of peaks is related to the concentration of the molecules.
Subsequently substrates of PEG impregnated with RERMS were prepared and SH-SY5Y (human neuroblastoma cell line) cells were plated and differentiated on the latter. Several morphological alterations were clearly evident. The RERMS peptide provoked cells to take on a flatter appearance and the cytoskeletal architecture changed, with the appearance of stress fibres, a clear indicator of actin reorganization.
Given that focal adhesions play a key role in determining cellular structure the latter were directly investigated.
Focal adhesion kinase (FAK) is one of the most highly expressed proteins in the CNS (central nervous system) during development. It has been described to be crucial for radial migration of neurons. FAK can be localized in growth cones and mediated the response to attractive and repulsive cues during migration. One of the mechanisms by which FAK becomes active is by auto phosphorylation at tyrosine 397.
It became clearly evident that in the presence of the RERMS peptide pFAK staining at focal adhesions intensified and more focal adhesions became apparent. Furthermore speckled structures in the nucleus, putatively corresponding to increased expression activity, also increased with RERMS. Taken together these results indicate that the RERMS domain in APP plays a critical role in determining cellular physiological responses.
Here is suggested a model by which RERMS domain is recognized by integrins and mediate intracellular responses involving FAK, talin, actin filaments and vinculin. This mechanism probably is responsible for mediating cell adhesion and neurite outgrowth on neurons.
Index
I. List of figures ... II II. List of tables ... III III. Abbreviations ... V
1. Introduction ... 3
1.1. The human brain and neuronal cells ... 3
1.2. Neuron morphology ... 5
1.3. Neurite outgrowth ... 5
1.3.1. Growth cones architecture ... 6
1.4. β-Amyloid precursor protein (APP) ... 7
1.4.1. Proteolytic processing of APP ... 8
1.4.2. APP domains and sub domains ... 9
1.4.3. APP functions ... 10
RERMS ... 11
1.5. Extracellular Matrix ... 11
1.6. Polyethylenoglycol (PEG) ... 12
1.6.1. PEGylation and NHS-ester PEG reaction chemistry ... 14
2. Objectives ... 19
3. Materials and methods ... 23
3.1. Culture, growth and maintenance of SH-SY5Y cell line ... 23
3.1.1. Differentiation of the SH-SY5Y neuroblastoma cell line ... 23
3.2. Surface cleaning and treatment of coverslips for cell culture ... 25
3.2.1. Surface cleaning of coverslips ... 25
3.2.2. Amino-silanization of coverslips ... 26
3.2.3. Surface treatment with PEG and crosslinkers ... 27
3.2.4. Crosslinking reaction ... 27
3.3. Evaluating the crosslinking reaction ... 28
3.3.1. Western blot ... 28
3.3.2. General considerations on infrared spectroscopy ... 30
Infrared spectroscopy ... 30
Fourier transform infrared spectrometry ... 31
FTIR equipment... 31
Functioning ... 32
Golden Gate™ Diamond ATR ... 32
3.3.3. MIR spectral acquisition ... 33
3.4. Cell Plating ... 34
3.4.1. Cell counting and viability assay ... 34
3.4.2. Cell plating on treated coverslips... 34
3.5. Immunocytochemistry ... 35
3.6. Data collection and analysis ... 37
4. Results and discussion ... 41
4.1. Crosslinking Reaction evaluation ... 41
4.1.1. Western blot ... 41
4.1.2. FTIR ... 42
4.2. Effect of the APP RERMS enriched matrix on SH-SY5Y cell adhesion ... 43
4.3. Effect of the APP RERMS enriched matrix on SH-SY5Y cells morphology and neurite outgrowth 46 4.3.1. RGDS and RERMS affect general morphology ... 48
4.4. RGDS and RERMS promote increases in focal adhesion phosphoFAK ... 50
4.5. RGDS and RERMS increase nuclear staining ... 51
5. Conclusion ... 55
6. References ... 61
I.
List of figures
Figure 1. Morphology based classification of neurons by polarity. ... 4
Figure 2. Nerve Cell. ... 5
Figure 3. Growth cone architecture. ... 7
Figure 4. APP isoforms. ... 8
Figure 5. APP proteolytic cleavage. ... 9
Figure 6. The domain structure of APP. ... 10
Figure 7. RERMS sequence in APP. ... 11
Figure 8. PEG structure. ... 13
Figure 9. NHS ester reaction for chemical conjugation to a primary amine. ... 14
Figure 10.Undifferentiated SH - SY5Y cells. ... 24
Figure 11. Differentiated SH - SY5Y cells. ... 24
Figure 12. Packaging coverslips. ... 25
Figure 13. Preparing coverslips. ... 26
Figure 14. Representation of NH2 groups attached after amino-silanization. ... 27
Figure 15. Structure of 4-arm NHS-ester PEG ... 27
Figure 16. The electromagnetic spectrum ... 30
Figure 17. Schematic representation of a FTIR spectrometer. ... 32
Figure 18. Golden Gate™ Diamond ATR. ... 33
Figure 19. Loss of NHS-ester bonds general spectra. ... 42
Figure 20. Loss of NHS-ester bonds detailed spectra. ... 43
Figure 21. Cell adhesion to different substrates ... 44
Figure 22. Adhesion complex. ... 45
Figure 23. Immunocytochemestry of SH-SY5Y cells. ... 47
II.
List of tables
Table 1. Table showing the concentration of stock solutions of PEG, RGDS, and RERMS, and the volumes used in the crosslinking reaction. ... 28 Table 2. Organization of the 24 well plates used in cell culture. These two plates were
replicated for 48 hours, 7 days, and 7 days with 10 µM of RA. ... 34 Table 3. Primary antibodies used in immunocytochemistry. ... 36 Table 4. Secondary antibodies used in immunocytochemistry. ... 36
III.
Abbreviations
2D Two dimensions
3D Three dimensions
AICD APP intracellular domain AD Alzheimer’s disease APLP1 APP-like proteins 1 APLP2 APP-like proteins 2 APP Amyloidprecursor protein
APP695 Amyloidprecursor protein 695 isoform
APP751 Amyloidprecursor protein 751 isoform
APP770 Amyloidprecursor protein 770 isoform
APS Ammonium persulfate
APTES 3-aminopropyltrimethoxysilane ATR Attenuated total reflection
Aβ β amyloid
BSA Bovine serum albumin CAPPD Central APP domain CNS Central nervous system CuBD Copper-binding domain DAPI 4',6-diamidino-2-phenylindole ECM Extracellular matrix
FAK Focal adhesion kinase FBS Fetal bovine serum FIR Far-infrared radiation
Fn Fibronectin
FTIR Fourier transform infrared spectrometry GFLD Growth factor-like domain
H2O2 Hydrogen peroxide
H2SO4 Sulfuric acid
HA Hyaluronic acid
ICC Immunocytochemistry KOH Potassium hydroxide
KPI Kunitz type serine protease inhibitor
LB Loading buffer
LGB Lower gel buffer
MEM Minimum essential medium MIR Mid-infrared radiation NHS N-hydroxysuccinimide esters NIR Near-infrared radiation PBS Phosphate buffered saline PEG Polyethylenoglycol
PEG-RERMS Polyethylenoglycol-RERMS sequence crosslinker PEG-RGDS Polyethylenoglycol-RGDS sequence crosslinker
PFA Paraformaldehyde
pFAK Phosphorylated focal adhesion kinase
pFAK sY397 Phosphorylated focal adhesion kinase at tyrosine 397
RA Retinoic acid
RERMS RERMS sequence
RGDS RGDS sequence
sAPP Secreted amyloid precursor protein SCM Succinimidyl
SDS Sodium dodecylsulfate
SDS-Page SDS-polyacrylamide gel electrophoresis SNRs Signal-to-noise ratios
UGB Upper gel buffer
1. Introduction
1.1.
The human brain and neuronal cells
The human brain is the most complex human organ. It is responsible for the storage, processing, integration, and transmission of almost all the information generated by internal and external stimuli. It is also responsible for maintaining homeostasis.1–3
It is believed that the human genome contains approximately 20 thousand genes, of which 14 thousand are expressed in the developing and/or the mature brain. From these 14 thousand genes, 8 thousand are also expressed in all cells and tissues. Taking this into consideration, 6 thousand genes are brain exclusive. Furthermore a great amount of brain-specific genetic information resides in the introns and regulatory sequences that control timing, quantity, quality, variability, and cellular specificity of gene expression.1
Cells that compose the nervous system can be divided in two broad categories: nerve cells, also commonly called neurons, and supporting glial cells, also called neuroglia or glia. It is estimated that the human brain contains about 100 billion neuros and several times as many neuroglia. Nerve cells and glia share the same organelles, which are present in all cells. These include the endoplasmic reticulum, Golgi complex, mitochondria, and a variety of vesicular structures.1
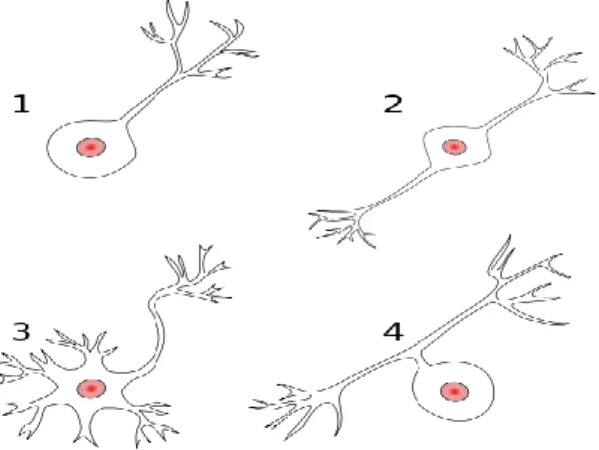
Nerve cells are specialized in fast transport of electrical signaling over long distances without loss or alteration of the initial signal. Nerve cells can be divided and classified with respect to their polarity (Figure 1), in other words, based on the number of extensions that arise from the cell body. They can be divided into unipolar or pseudounipolar, the axon and dendrite emerge from the same process; bipolar cells, have the axon and dendrites emerging from cell body on opposite sites; multipolar cells, have two or more dendrites and one axon emerging from the cell body; and finally in anaxonic cells, the axon cannot be distinguished from dendrites.1,3
Figure 1. Morphology based classification of neurons by polarity.
1 - unipolar neuron; 2 – bipolar neuron; 3 – multipolar neuron; 4 – pseudounipolar neuron.(taken from4)
Glia support rather than generate electrical signals. Glia are also essential to repair damage to the nervous system, acting as stem cells in specific brain regions, promoting regrowth of damaged neurons in regions where regeneration can usefully occur, and preventing regeneration in other regions where uncontrolled regrowth might do more harm than good.1
In the mature nervous system three different types of glial cells are present; astrocytes, oligodendrocytes, and microglial cells.1
Astrocytes, occur only in the central nervous system (CNS), which comprises the brain and the spinal cord. These cells have elaborate local processes that give them a star-like appearance. The major function of astrocytes is to maintain an appropriate chemical environment for neuronal signaling.1
Oligodendrocytes, are also present only in the CNS, create a laminated, lipid-rich wrapping, called myelin, around some axons. This wrapping has important effects on the speed of the transmission of electrical signals, increasing the transmission speed.1
Microglial cells are derived primarily from hematopoietic cells. This type of glia shares many properties with macrophages found in other tissues. They are primarily scavenger cells that remove cellular waste from injury sites of normal cell turnover. Moreover, microglia secrete signaling molecules, particularly cytokines, which can modulate local inflammation and influence cell survival or death.1
1.2.
Neuron morphology
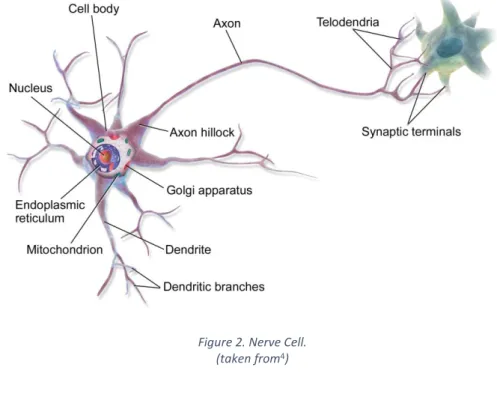
The high level of differentiation for intercellular communication and moment-to-moment electrical signaling distinguishes neurons from other cell types. The most perceptible morphological aspect of neuronal specialization for communication is the extensive branching of neurons. This extensive branching is mainly due to the presence of an axon (Figure 2), an elongated structure that arises from the cell body and connects to the axon terminal arborization, the initial portion of the axon is called the axon hillock and is responsible for the generation of the electrical signal, also called telodendria. Additionally dendrites have an elaborate arborization that arises from the neuronal cell body in the form of dendritic branches. Dendrites are the primary target for the synaptic input from the axon terminals of other neurons, pre-synaptic neuron, and are distinguished by the high content of ribosomes and specific cytoskeletal proteins.1
Figure 2. Nerve Cell. (taken from4)
1.3.
Neurite outgrowth
During development, neuronal cells become organized into functional neuronal networks by developing dendrites and axons, collectively called neurites, which connect synaptically to other neurons. The structures responsible for this process are the growth cones, specialized structures at the tip of the outgrowing neurites, which integrate chemical and structural signals from the extracellular matrix, and control neurite extension. Growth cone migration
elongates or retracts the trailing neurite, whereas growth cone splitting creates two daughter branches. Through these growth cone activities, neurons gradually develop their characteristic, highly branched axonal and dendritic trees.5-7
The axon outgrowth process can be divided in three sequential stages: protrusion, corresponding to the extension of new membrane at the growth cone, driven by the polymerization of filamentous actin; engorgement which is the transportation of membranous organelles and vesicles, made by microtubules, into actin-dominated peripheral regions; and consolidation that is the contraction and stabilization of the proximal growth cone, which takes a cylindrical axon shaft. Completion of this process allows for the bidirectional movement of organelles and vesicles, made possible by microtubules 7,8
This outgrowth process involves traveling across long distances and pathfinding, which consists in a turn, of responses to extracellular signals.5-9
Focal adhesion kinase (FAK) is one of the most highly expressed proteins in the central nervous system during its development. It has been reported to be dispensable for tangential migration, but crucial for radial migration, because FAK regulates the formation of contact points formed by Connexin-26, between migrating cells and radial glial fibers.9-12
FAK can be localized in growth cones13 and mediates the response to attractive and repulsive
cues during its migration.14,15 FAK has also been reported to be highly expressed in the
hippocampus, and has an important role in long term memory storage.9, 15-17
Although FAK activity has been shown to be very important in the CNS formation, more precisely in neuronal growth and migration, the molecular mechanisms involved in these processes and regulation of FAK are still poorly characterized and require further study.
1.3.1. Growth cones architecture
Growth cones can be divided in three regions. These regions are not well defined, in other words, they are transient.5,8
Peripheral regions of outgrowth cones are composed by Filopodia, tapered finger-like projections, and Lamellipodia, flat sheet-like protrusions, both together, forming a very dynamic region.5,8,18
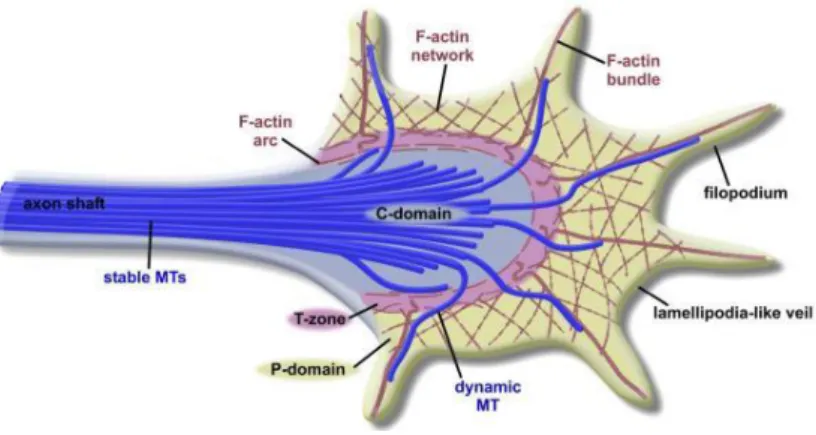
Surrounded by the peripheral region is a central region, that is more stable and exhibits less plasma membrane dynamics (Figure 3), but has substantial molecular motion, including
constant transport of vesicles and organelles along microtubules. More distally, this central region transitions into the cylindrical axon shaft.5,8,18
Figure 3. Growth cone architecture.
A peripheral region (P-domain) composed of Filopodia (F-actin bundles) and lamellipodia (F-actin network). A central region (C-domain) more stable, composed of a wide net of microtubules (blue) that send extensions to peripheral region, and connect to the peripheral region by a transition zone (T-zone). Also indicated the axon shaft region with microtubules (MTs).(Image taken from5)
1.4.
β-Amyloid precursor protein (APP)
APP is a type I transmembrane glycoprotein expressed in a wide range of mammalian and non-mammalian cells 19, and belongs to a small gene family of APP-like proteins, which includes
APLP1 and APLP2.20
The APP gene is found in chromosome 21 and contains 19 exons. By alternative splicing, APP generates 8 different isoforms, of which 3 are more common (Figure 4): The 695 amino acid form, expressed predominantly in the CNS, and the 751 and 770 amino acid forms, which are ubiquitously expressed.19,21,22
Figure 4. APP isoforms.
Exon structure of full length APP transcript and the 3 most common isoforms APP770, APP751, and APP695. The alternative spliced exons are represented in blue (exon 7), green (exon 8) and purple (exon 15). The Aβ sequence is represented in red.
1.4.1. Proteolytic processing of APP
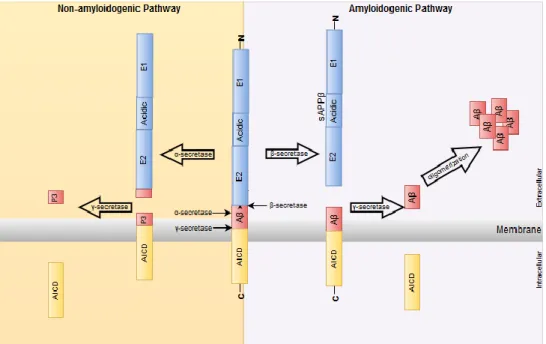
Two pathways can proteolytically process APP: the amyloidogenic, and the non-amyloidogenic (Figure 4). In the amyloidogenic pathway APP is first cleaved between amino acids 596 and 597 (APP 695) by β- secretase followed by γ- secretase that cleaves between 711-712 or 713-714 amino acids, resulting in the N-terminal sAPP (sAPPβ), the intra cellular domain of APP (AICD), and the Aβ peptide. The latter can accumulate in neurons to form amyloid plaques, one of the hallmark of Alzheimer’s disease (AD). In the non-amyloidogenic pathway APP is first cleaved by α- secretase between residues 596 and 597 (APP695) within the Aβ region, preventing the formation of the Aβ peptide, and then it is sequentially cleaved by γ-secretase.19–25
Figure 5. APP proteolytic cleavage.
In the amyloidogenic pathway APP is sequentially cleaved by β-secretase and γ-secretase leading to the formation of the Aβ peptide, sAPPβ fragment and AICD fragment; and the non-amyloidogenic pathway where APP is sequentially cleaved by α-secretase and γ-secretase leading to the formation of sAPPα fragment, P3 fragment and AICD fragment.
1.4.2. APP domains and sub domains
Protein domains are critical for determining protein structure and function. Thus specific domains dictate structural functional relationships and specific isoforms can have different domains. For example, this is the case with the APP770 isoform that has the Kunitz Protease Inhibitor (KPI) domain (Figure 5, exon 8 and Figure 6), which is absent in APP751 and APP695. However, APP has other domains, critical for the protein’s function.
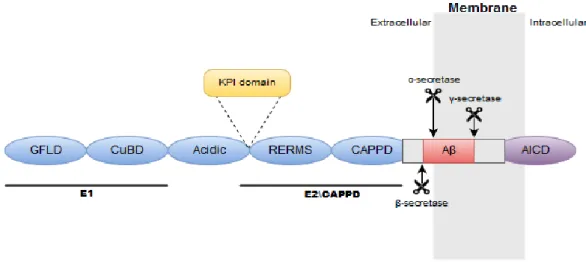
Figure 6. The domain structure of APP.
Showing E1 domain composed of the N-terminal growth factor-like domain (GFLD) and the copper-binding domain (CuBD). E1 domain is connected to the E2 domain, by the acidic domain. E2 domain contains the RERMS sequence and central APP domain (CAPPD). Aβ region and the APP intracellular domain (AICD) are also represented. Between
the acidic domain and RERMS sequence there is the KPI domain. Secretases cutting sites are also represented.
Members of the APP protein family have two extracellular conserved domains, E1 and E2. The E1 domain contains the N-terminal growth factor-like domain (GFLD) and the copper-binding domain (CuBD). The E1 domain is connected to the carbohydrate domain, namely the E2 domain, by the acidic domain (Figure 6). The E2 domain contains the RERMS sequence and central APP domain (CAPPD). Linked to the E2 domain is the Aβ region and the APP intracellular domain (AICD). AICD is the most conserved region. Between the acidic domain and RERMS sequence there is the KPI, already mentioned above.20,24–26
1.4.3. APP functions
Several biological functions have been attributed do the extracellular, N-terminal region of APP during the last few years. Longer isoforms of APP (APP751 and APP770), containing the KPI
domain have been implicated in the regulation of neurite extension, blood coagulation, and wound-healing. On the other hand APP695 (lacking the KPI domain) plays a role in growth
regulation and modulation of neural excitability, synaptic plasticity, and cell survival, showing that these functions are KPI-independent. Neuron excitability has been shown to be sAPPα specific.26
RERMS
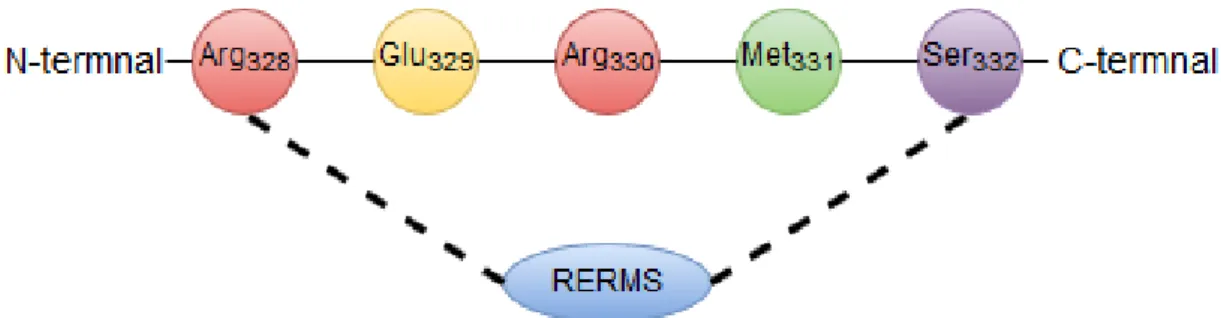
REMRS, is a five amino acid sequence (Arg328-Glu329-Arg330-Met331-Ser332) located between the
KPI and CAPPD domains (Figure 7), it has been reported to play role in neurite outgrowth on neurons: the N-terminal portion of sAPP containing RERMS sequence was proven to have growth-regulating activity in fibroblasts27. The same sequence induced neurite outgrowth in a
neuronal cell line from the rat central nervous system (B103 cell line)28. RERMS-containing APP
peptides were demonstrated to promote neuronal survival in primary rat cortical cells.29 In a
rabbit spinal cord model for ischemia, the ability of a 17-mer peptide containing the RERMS sequence to protect against neuronal loss was tested. This peptide largely increased the required ischemia time to produce paraplegia.30 This same peptide when infused in elderly rats
trained in a Morris water maze, led to increased memory retention and synaptic density in frontoparietal cortex.31
Figure 7. RERMS sequence in APP.
1.5.
Extracellular Matrix
The extracellular matrix (ECM) comprises the non-cellular components of tissues, and water, proteins, and polysaccharides are important components. ECMs of different tissues, although they have the same basic components, differ in their composition and organization, leading to a wide diversity of ECMs over the whole body. ECMs are highly dynamic and undergo constant remodeling by adjacent cells through both enzymatic and non-enzymatic processes.32
Fibrous ECM proteins such as collagen and fibronectin (Fn) as well as glycosaminoglycocans such as hyaluronic acid (HA), can form complex three dimensional (3D) scaffolds that mechanically support cells and form the basis of tissue shape.33–35
The role of the ECM is not only for support, the ECM also provides a great number of biochemical cues to cells through the presentation of specific amino acid binding sequences. Cells bind to the ECM through ECM receptors such as syndecans, discoidin domain receptors, and the most important and common integrins.32
,33,36,37
Fn has many binding sites for integrins, other ECM proteins, growth factors, and itself, mediating many cellular interactions with the ECM. Such interactions are crucial for many cell behaviors including adhesion, migration and differentiation, morphogenesis, and wound healing and morphogenesis.38
One of the main, possibly the most pertinent, cell-binding site is the peptide sequence arginine-glycine-aspartic acid-serine (RGDS).32,36,37,39–46
1.6.
Polyethylenoglycol (PEG)
In order to better understand the function of the ECM, biomaterials are being pursued as attractive experimental models. Among biomaterials, PEG is particularly attractive. This fact is due mostly to its properties that include resistance to protein adsorption, it repels proteins without desnaturating them, has high water solubility, good biocompatibility, is non-immunogenity, available in different molecular weights, and is fully transparent, facilitating microscopic analyses of cells. These properties have permitted PEG to be widely applied in biomedical sciences including surface modification, bioconjugation, drug delivery, and tissue engineering.47-51
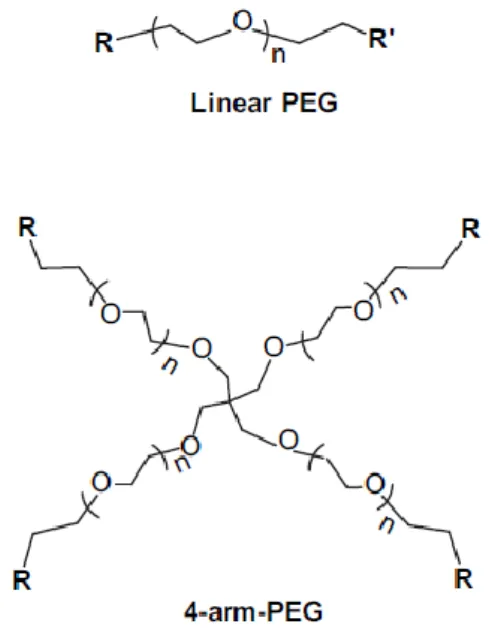
In the most common form, PEG can be linear or branched, and can have one or more branches terminated with hydroxyl groups, which can be converted into different functional groups, such as methyloxyl, carboxyl, amine, thiol, azide, vinyl sulfone, azide, acetylene, and acrylate. In multi armed PEG, termination groups can be all the same, or they can be different within the same molecule (Figure 8).
Figure 8. PEG structure.
A linear and a 4-arm PEG are represented. (adapted from47)
PEG polymer is synthesized by anionic polymerization of ethylene oxides initiated by nucleophilic attack of hydroxide ion on the epoxy ring.47,48,51
PEG can be modified in many ways by a wide range of processes, but the most useful polypeptide modification is monomethoxy PEG (mPEG), synthesized by anionic ring opening polymerization initiated with methoxide ions.48,51
In order to conjugate PEG with biomolecules there are some factors that must be taken into consideration: the chemical structure, molecular weight, steric hindrance, and the reactivity of both PEG and biomolecules.48,49,51
1.6.1. PEGylation and NHS-ester PEG reaction chemistry
PEGylation is the term used for the covalent attachment of PEG to peptides or proteins. This is a very advantageous process, making it possible to immobilize proteins or peptides in a matrix gel, in a 3D set up, or in a surface as a substrate for cells in a 2D manner. PEGylation has also been used as a drug delivery system because it enhances water solubility of hydrophobic drugs, prolongs the circulation time, and minimizes non-specific uptake.48,51-55 A significant
amount of studies have been carried out with respect to PEGylation, thus the proof of concept is well established. Within the scope of this work particular attention will be dedicated to immobilizing RERMS sequence to a surface matrix suitable for cell culture. To achieve this NHS-ester PEG is an attractive model. For the work here described NHS-NHS-ester PEG will be employed, given that NHS-ester crosslinkers, such as NHS-ester PEG (Figure 9), reacts with primary amines in physiological to slightly alkaline conditions (pH=7,2-9). This reaction is covalent and thereby it is very stable.56
Figure 9. NHS ester reaction for chemical conjugation to a primary amine.
(R) represents a labeling reagent or one end of a crosslinker having the NHS ester reactive group; (P) represents a protein or other molecule that contains the target functional group. (Taken from56)
The major characteristics of this reaction are as follows:56
Half-life of hydrolysis for NHS-ester is 4 to 5 hours at pH 7,0 and 0°C;
Half-life of hydrolysis for NHS-ester decreases to 10 minutes at pH 8,6 and 4°C; NHS, when free in solution, can be measured at 260 to 280nm, because it absorbs in
In the present study, NHS-ester PEG will be used as a crosslinker for the RERMS sequence. This crosslinking reaction will be applied in pre-treated and amino-silanizated coverslips, which will be used as a surface for cell culture. The model will be used to study the effect of the RERMS sequence with respect to cell adhesion, cell number and the effect of this surface on cell altering cell morphological, using immunocytochemistry, will also be tested.
2. Objectives
The major goal of this thesis is to investigate how the RERMS domain of APP can influence cell adhesion and neuritic outgrowth. The underlying hypothesis is that the RERMS domain, typically exposed extracellularly in APP, can influence cell morphology and neuritic outgrowth and is hence a critical domain in the developing CNS and in the maintenance of the neuronal network.
Thus the specific objectives of the present study are:
1. To optimize PEG crosslinking with the RERMS peptide; 2. To characterize the role of APP RERMS in cell adhesion;
3. To characterize the role of APP RERMS on cell morphology and neuritis outgrowth; 4. To identify potential molecular targets/mechanisms involved in RERMS mediated
3. Materials and methods
3.1.
Culture, growth and maintenance of SH-SY5Y cell line
In neurosciences the use of mammalian neurons derived from embryonic the CNS tissue is very limited mainly because once these cells are terminally differentiated into mature neurons, they can no longer be propagated.
To overcome this limitation transformed neuron-like cell lines are commonly used. Among them, there is a very popular and well characterized one, the SH-SY5Y neuroblastoma cell line (ATCC® CRL-2266™).57
The SH-SY5Y cell line was originally derived from a metastatic bone tumor biopsy, and a subline of the parental line SK-N-SH, which were subcloned three times: first to SH-SY, them to SH-SY5, and finally to SH-SY5Y.57
In order to archive the objectives proposed for the present study, SH-SY5Y neuroblastoma cell line was chosen for the reasons described above, and because this cell line is a human cell line that can be easily differentiated into a more mature neuronal-like phenotype.
SH-SY5Y cells (ATCC® CRL-2266™) were grown and maintained in Minimal Essential Medium (MEM)/F12 (1:1) medium supplemented with 10% fetal bovine serum (FBS), 0.5 mM L-glutamine, 100 U/mL penicillin and 100 mg/mL streptomycin. Cultures were maintained in a humidified chamber at 37°C under 5% CO2.9,57 Cells were subcultured whenever 80-90% confluence was
reached. The procedures are in routine use in the laboratory.
3.1.1. Differentiation of the SH-SY5Y neuroblastoma cell line
Differentiation of SH-SY5Y cells is relatively easy to achieve by manipulation of the culture medium. There are many reagents\compounds that can be added to culture medium in order to differentiate SH-SY5Y cells, but Retinoic Acid (RA) is the most commonly used.57
Cells were plated at a density of approximately 30 000 cells in 15 mm
ᴓ
plates (example - Figure 10). Cells were allowed to adapt for 24 hrs (day -1) and were then subjected to differentiation. In order to differentiate SH-SY5Y cells in this study, RA was added to the culture medium, at aconcentration of 10 µM and FBS at 10%.58 This culture medium was replaced every 48 hours until
the time of 7 days was reached (example-figure 11).
This procedure was carried out on different substrates, some incorporating peptides like RERMS and RGDS as described below.
Figure 10.Undifferentiated SH - SY5Y cells.
Cells tend to grow in clusters and may form clumps of rounded cells on top of one another (arrow). At the edges of the cluster, cells begin to extend short neurites (arrowhead).(taken from 57)
Figure 11. Differentiated SH - SY5Y cells.
Cells do not cluster and have a more pyramidal shaped cell body (arrowhead). Neurites begin to extend, reminiscent of dendrites and/or axons.(taken from 57)
3.2.
Surface cleaning and treatment of coverslips for cell
culture
In order to remove all residues, organic and non-organic, a protocol from “Journal of Visualized Experiments” was followed, with some modifications. The same protocol was followed with few alterations for amino-silanization and PEG attachment to the surface.66
3.2.1. Surface cleaning of coverslips
Before cleaning and treatment, coverslips were disposed in a homemade basket, made of Teflon net (bought in the local tools store). The selection of the material from which the basket was made, was of great importance and resolved many problems once the reagents used in this protocol are very strong and abrasive. The only materials resistant to all the reagents used are ceramic, glass and Teflon. The material easiest to get, and more affordable was the Teflon net.
Figure 12. Packaging coverslips.
Teflon net basket (left). Baskets full with coverslips, contained in the glass staining jar (right).
Coverslips were first rinsed with MilliQ water three times, and sonicated (a Branson 1510 sonicator was used) with MilliQ water for 10 minutes to remove dirt.
MilliQ water was replaced by acetone, and the coverslips were sonicated for 30 min. After this the acetone was disposed in a specific residue recipient, and replaced by MilliQ water. In order to remove all acetone residues from the coverslips, they were rinsed in MilliQ water three times.
Figure 13. Preparing coverslips.
Basket with coverslips, inside a glass staining jar, placed in the immersible ultra sonicator Branson 1510.
Then MilliQ water was replaced by potassium hydroxide (KOH) at a concentration of 1M, and sonicated for 30 minutes. After this, to remove all residues of KOH from the coverslips, they were rinsed three times in MilliQ water.
The final stage of coverslip cleaning was the piranha etching. This reaction was made in a 2 liter beaker, because it is a very exothermic and violent reaction. First the slide basket was placed in the bottom of the beaker, and to it were added 450 mL of sulfuric acid (H2SO4). Then 150 mL of
hydrogen peroxide (H2O2) was added and all the solution was stirred. The reaction starts as soon
as H2O2 was added and the basket was only taken out of the reaction when it stopped and the
temperature decreased. Piranha solution was neutralized by slow addition of small volumes of water, and then discarded to appropriate residues. Once the basket was taken out from the piranha solution, it was rinsed three times in MilliQ water, in order to remove all possible piranha solution residues.
3.2.2. Amino-silanization of coverslips
In order to functionalize coverslips, MilliQ water from the previous step of cleaning was replaced by methanol. Then the amino-silanization solution was prepared by adding to a Pyrex flask 100 mL of methanol, 5 mL of acetic acid, and 3 mL of APTES (3-aminopropyl trimethoxysilane). This solution was gently mixed. In this solution, methanol functions as a solvent, and acetic acid functions as a catalyst for the amino-silanization reaction.
Figure 14. Representation of NH2 groups attached after amino-silanization.
Methanol was replaced by the amino-silanization solution, and coverslips were incubated for 40 minutes, and sonicated once for one minute during this period.
Following this, amino-silanization solution was replaced with methanol and rinsed 3 times. Coverslips were left in methanol until the next steps, but it is not advisable for coverslips to stay more than 1 hour in methanol, because it can damage the amino-silanizated coverslips.
3.2.3. Surface treatment with PEG and crosslinkers
The class of PEG chosen for this study, was and NHS ester PEG, more specifically 4-Arm PEG-SCM with a molecular weight of 20k (purchased from Creative PEGWorks). This is a multiarm PEG derivative with succinimidyl NHS ester groups at each terminal of the four arms connected to one pentaerythritol core.
Figure 15. Structure of 4-arm NHS-ester PEG (20 KDa) used in this study.
3.2.4. Crosslinking reaction
In order to attach PEG and the crosslinkers to NH2 groups present at the surface of the previous amino-silanizated coverslips, first PEG has to be reconstituted in a buffer with a pH between 7,5 and 8,9. For this experiment, a buffer with pH=8,5 was chosen, because this was consistent with the buffer used in the previous procedures.
For the buffer preparation 84 mg of sodium bicarbonate (Thermo scientific) were dissolved in 10 ml of MilliQ water.
PEG was then weight and dissolved in a concentration of 20 mg of PEG in 1 mL of sodium bicarbonate, buffer was prepared previously. This concentration was chosen, because it a thicker PEG gel was desired, if the concentration was increased it was very difficult to dissolve all the PEG. Following this step, the peptides were added to the PEG solution. Theoretically 4-Arm PEG-SCM is capable of linking to 4 peptides, but NHS which is released into solution competes with NH2 from the N-terminus of each peptide for the position at the end of PEG arms. Furthermore, RERMS and RGDS peptides are very reactive. Thus, it was decided to use a higher ratio between PEG and peptides than that theoretical calculated. For the present experiments a ratio of 1/10 of PEG/peptide (number of molecules/number of molecules) was used. In this case peptides were reconstituted in deionized water at a concentration of 5 mg/mL. Concerning the molecular weight of peptides, the following was used; 10 µl of peptide solution for 100 µL of PEG solution.
Table 1. Table showing the concentration of stock solutions of PEG, RGDS, and RERMS, and the volumes used in the crosslinking reactions.
Stock solution Volume used in crosslinking reaction
PEG RGDS RERMS PEG RGDS RERMS
20 mg/mL 5 mg/mL 5 mg/mL 100 µL 10 µL 10 µL Proportion (molecule/molecule) 1 PEG/10 peptide
3.3.
Evaluating the crosslinking reaction
3.3.1. Western blot
Western blot (WB), also known as immunoblot, is one of the most common techniques for detection and analysis of proteins. This technique is extremely well established and involves several steps. Firstly, the sample has to be prepared, then the proteins in the sample are separated on an electrophoresis gel and finally transferred onto a nitrocellulose membrane.
Following transfer, membranes are incubated with antibodies, and then the complex of antibody:protein can be detected and analyzed with one of several detection methods.59
In the present work electrophoresis gels used were 8% SDS-PAGE, a denaturing gel, which allows for separation of proteins solely on the basis of their molecular weight. It consists of two gels, a resolving (bottom) gel, with higher concentration of polyacrylamide to separate proteins, and a stacking (top) gel, with lower concentration of polyacrylamide.
Prior to loading the samples, a loading buffer is added, which consists of glycerol, SDS, a reducing agent (β-mercaptoethanol) and a dye (bromophenol blue). Glycerol increases the density of the samples and helps anchor the sample in the wells; SDS masks any inherent charge of the proteins; the reducing agent breaks any disulfide bonds, disrupting quaternary and tertiary protein structures; and the dye enables tracking the progression of the sample in the gel.59
Electrical current is then applied to the gel, enabling the separation of proteins. After separation, the proteins are transferred electrophoretically onto a nitrocellulose membrane. This immobilized all proteins, that were initially loaded into the gel and separated, at their respective relative migration positions at the time point when the electric current of the gel run was stopped.59
After this, membranes were stained with Ponceau S to confirm whether the proteins were transferred. This permits assessing if all the wells were equally loaded. Membranes are blocked with non-fat dry milk or BSA to block any non-specific binding sites of the primary antibody. After blocking, membranes are incubated with a specific primary antibody and the appropriate secondary antibody. Following incubation, proteins can be detected through chemiluminescence, a method that incorporates the ability of the horseradish peroxidase conjugated on the secondary antibody to catalyze the oxidation of luminol, resulting in the emission of light. This light signal can then be detected on X-ray film which can be analyzed using a densitometer.59
In the present work, samples of crosslinking reactions were prepared taking into account the proportions/concentrations of table 1. The running 8% gel was prepared and allowed to polymerize for 45 minutes at room temperature. Subsequently, the stacking gel solution was prepared and loaded on the top of the resolving gel. A comb was inserted into the stacking gel and left to polymerize for 30 minutes at room temperature. Prior to loading, Loading Buffer (LB) 4x (form composition see appendix 1) was added to the samples (1/4 of the final volume), boiled for 10 minutes at 90°C and spun down.
Samples were gently loaded into the wells, as well as a molecular weight marker (Precision Plus Protein™ Dual Color Standards, Bio-Rad) and gels were run at 100 V for approximately 2 hours.
The samples were: the sodium bicarbonate buffer pH =8,5, PEG, RGDS, RERMS, PEG-RGDS, and PEG-RERMS.
25 ul of each sample were loaded and once the gel run was stopped no further steps were carried out. This was due to an unexpected problem, which made impossible to use this technique to identify and prove the crosslinking reaction. The problem will be discussed in section 4.
3.3.2. General considerations on infrared spectroscopy
Infrared spectroscopy
Spectroscopy comprises a technique based on the interaction between sample and electromagnetic radiation, in order to analyze chemical compounds including biomolecules such as proteins, nucleic acids, and metabolites. In fact spectroscopy contributes with detailed information concerning the structure and mechanism of action of such molecules.60
Infrared radiation of electromagnetic spectrum is located in the invisible area of the spectrum, and its wave length ranges from 14 000 to 4 cm-1 (Figure 12). These energy frequencies are responsible for molecular vibrations, energy frequencies higher than 14 000 cm-1, comprising ultraviolet and visible light, cause electrical transitions, and energy frequencies lower than 4 cm-1, microwaves, cause molecular rotation. Furthermore, infrared spectrum can be subdivided in three categories: Near-infrared region (NIR), wave length range between 14 000 and 4000 cm-1; Mid-infrared region (MIR), wave length range between 4000 and 400 cm-1; and Far-Mid-infrared region (FIR), wave length range between 400 and 4 cm-1. 60
Fourier transform infrared spectrometry
Fourier transform infrared spectrometry (FTIR) is a widely used technique for the large number of molecules that have strong absorbance in the MIR region. Its high versatility is due to the many types of samples it can analyze, including solids, liquids, gases, pastes, and gels. Furthermore, in order to obtain a spectrum only a very small sample is required.60,61
In the infrared spectra obtained, peaks positions give information about the structure of the molecules in the sample, the intensity of peaks is related to the concentration of the molecules, and peak widths are sensitive to the chemical matrix of the sample, taking into account pH and hydrogen bounds.60,61
The further advantage that comes from the use of FTIR, rather than other types of spectrometers, is the ability to acquire spectra with high signal-to-noise ratios (SNRs). This is due to some features of the spectrometer like throughput, multiplex and wavenumber precision. Throughput comes from the high-intensity of infrared beam that arrives at the detector, increasing the signal level. Multiplex is related to the possibility of co-adding scans, improving the SNR of a spectrum. Finally the high precision comes from the laser that acts as an internal wavenumber standard. All these features increase SNRs, which lead to an increase in the sensitivity of the instrument, and allows for quantitative accuracy, increasing its applications.60,61
FTIR equipment
A light source, an optical system, a detector and a sample holder compose a spectrophotometer. The radiant energy is directed from the source to the sample, and the detector measures the intensity of the emergent beam.60,61
FTIR spectrophotometers use and interferometer, the most common is the four arms Michelson interferometer (Figure 13). In this interferometer the top arm contains the infrared source and a collimating mirror that collects the light from the source and makes its rays parallel. The bottom arm contains a stationary mirror, the right arm contains a moving mirror, and the left arm contains the sample holder and the detector. At the center of the interferometer there is a beam splitter.60,61
Figure 17. Schematic representation of a FTIR spectrometer.
The major compartments - BS:beamsplitter; X: relative position variation of moving mirror. (taken from 60)
Functioning
At the source, IR energy is emitted from a glowing black-body source, this beam passes through an aperture which controls the energy presented to the sample and, ultimately, to the detector. The beam enters the interferometer and promotes the spectral encoding, this generates an interferogram signal with information of every IR frequency that comes from the source. The interferometer divides radiant beams, generates an optical path difference between beams and then recombines them in order to produce repetitive interferences signals measured as a function of optical path difference by the detector. At the sample holder, the beam is reflected off or transmitted through the sample surface. The specific energy frequencies characteristic of the sample are then absorbed. In the detector the last measurement of the interferogram occurs. Finally the signal is sent to the computer where the Fourier transform takes place, resulting in a final FTIR spectrum that can be interpreted and further manipulated.60,61
Golden Gate™ Diamond ATR
Presently IR-measurements are mainly performed in Attenuated Total Reflection (ATR) node because this technique is simpler and more versatile than the conventional transmission mode. The last implies that IR beam cross the whole sample, thus being necessary to control the sample thickness and opacity. With the transmission mode it is possible to analyze liquid samples, but extremely difficult.62–64
ATR allows a quick analysis of solids, liquids, powders or pastes. In ATR the sample is in direct contact with a crystal. The IR beam passes through the crystal, within it is totally internally reflected beyond its surface into the sample. The sample, placed on the crystal, absorbs energy,
spectrometer and the information is converted into spectra. The modification, absorption or attenuation, of the IF beam is proportional to the chemical concentration of the sample, making it possible to extract quantitative data from the sample.62–64
Figure 18. Golden Gate™ Diamond ATR. (adapted from 65
The Golden Gate™ Diamond ATR (Figure 14) is one of the most sensitive, robust and versatile infrared accessories designed for all the high performance FTIR spectrometers. The most advantageous features of this accessory are the diamond surface to place the sample, and its rugged construction. Being made of diamond it is very resistant to chemical attack and it allows for the analysis of corrosive liquids, and resists high loads applied against a solid sample. Furthermore, due to its resistance it can be cleaned quite aggressively, removing all the residues of the samples analyzed.63,64
3.3.3. MIR spectral acquisition
In order to collect the spectra, PEG, RGDS (a control test peptide), and RERMS (APP derived peptide) were kept in ice until the moment of reaction, because of their high reactivity. 10 mg of PEG powder were dissolved in 1ml of sodium bicarbonate buffer pH=8,5, and then crosslinking reactions were prepared using the concentrations mentioned in Table 1.
Spectra were acquired immediately after the solution was prepared with a Perkin-Elmer Spectrum BX FTIRTM spectrometer in the range of 4000-900 cm-1, at a resolution of 8 cm-1 with 64 co-added scans. During acquisition, room temperature and humidity were kept at ± 25°C and ± 37% respectively.
For spectra acquisition, by drying kinetics, it was perform the acquisition of background single beam against air (with the empty crystal). Then a drop of the PEG solution or the crosslinking
reactions was placed on the ATR crystal. The drying time was achieved and established after approximately 30 minutes, which corresponds to the acquisition of 16 consecutive spectra. For the arithmetic subtraction of the buffer spectra it was necessary to acquire a spectrum of buffer, and of all crosslinking reactions.
At the end, a spectra of the air background was obtained, as well as spectra for the sodium bicarbonate buffer, PEG, and PEG crosslinking reactions with RGDS and RERMS.
3.4.
Cell Plating
3.4.1. Cell counting and viability assay
In order to plate cells an initial confluency of approximately 30%, 10 000 cells per well of 24 well plates was used. To confirm, a dye exclusion assay was employed, in which living cells with an intact cytoplasmic membrane exclude the reagent, while dead cells stain blue due to dye incorporation through permeabilized damaged cytoplasmic membranes. To an aliquot (90 μL) of cells suspension, 10 μL of 0,4% Trypan Blue were added and incubated for 1 minute at room temperature. The unstained (viable) cells were counted in a hemacytometer, and cell concentration calculated for further cell plating.
3.4.2. Cell plating on treated coverslips
After coverslips were treated, they were placed in a well, 30 000 cells in 1 mL culture medium was added. Cell plating scheme is describe In table 2.
Table 2. Organization of the 24 well plates used in cell culture. These two plates were replicated for 48 hours, 7 days, and 7 days with 10 µM of RA.
PEG-RGDS PEG-RGDS PEG-RGDS PEG-RGDS PEG-RGDS PEG-RGDS PEG-RGDS PEG-RGDS PEG-RGDS PEG-RGDS PEG-RGDS PEG-RGDS PEG-RERMS PEG-RERMS PEG-RERMS PEG-RERMS PEG-RERMS PEG-RERMS
PEG- PEG- PEG- PEG- PEG-
PEG-Glass Glass Glass Glass Glass Glass
Glass Glass Glass Glass Glass Glass
These conditions were performed at two different times. A time point at 48 hours in order to study the number of cells that adhere to the different surfaces treatments was chosen, and 7 days in order to study the morphology and neurite outgrowth in the different surfaces treatments. In the time of 7 days a set of plates were incubated with non-differentiating medium, and another set was incubated with medium containing 10µM of RA to permit cell differentiation.
In the 7 days assays, cell medium was replaced with new medium every 48 hours. In the 7 days assay, with retinoic acid, cells were plated for one day with medium without retinoic acid, corresponding to a -1 day, only at day 0 (zero) was medium replaced with new medium, containing retinoic acid at a concentration of 10 µM. This medium was renewed every 48 hours until the time of 7 days was reached.
When the time of 48 hours or 7 days, depending the assay, was achieved, culture medium was removed, coverslips washed once with PBS pH=7,4 and then the Immunocytochemistry protocol was applied followed by sample fixation.
3.5.
Immunocytochemistry
Immunocytochemistry consists of a technique whereby cells, are fixed in paraformaldehyde (PFA), in order to permit the visualization and subsequent determination of the location of a given protein or peptide by the use of specific antibodies.67
This technique involves several and crucial steps in order to obtain good final preparations. First samples are prepared by fixing with a fixation agent, this agent helps to stabilize and preserve cells as close to life-like as possible by binding to reactive groups on proteins and lipids and holding them in the same position as if the cells were still alive. The second step is the permeabilization of the cells achieved by the addition of detergents, which can solubilize membranes without destroying the protein-protein interactions. After this cells are blocked, incubated with the chosen antibody and corresponding fluorescent secondary antibody and mounted in a media with anti-fading and anti-photobleaching properties. Finally the preparation can be visualized through a microscope, and images analyzed.67
In the present work, cell culture was performed as described in the previous section in 24-well plates (Corning) with glass coverslips of 15mm diameter. Cells were then washed with PBS 1x
pH=7,4 and 300 μL of 4% PFA was added for 30 minutes. Following fixation, cells were washed three times with PBS 1x pH=7,4 and 300 μL of 0.2% Triton-X was added for 10 minutes. Cells were then incubated for 2 hours with the specific antibodies, as indicated in Table 3, followed by three washes with PBS 1x pH=7,4 and incubation for 1 hour with the appropriate fluorescent antibodies (Table 4). After this cells were washed five times with PBS 1x pH=7,4 in order to remove all non-ligand antibody. Samples were then mounted onto a microscope slide with VECTASHIELD® Mounting Media with DAPI (Vector Laboratories) and visualized using a LSM510-Meta confocal microscope (Zeiss) and a 63x/1.4 oil immersion objective. The argon laser lines of 405 nm, 488 nm, and a 561 nm DPSS laser were used. Profiles were acquired using the Zeiss LSM 510 4.0 software.
Table 3. Primary antibodies used in immunocytochemistry.
Antibody Antibody type Target Dilution
Anti-FAK (34Q36)
(Thermo scientific) Mouse, monoclonal Focal adhesion kinase 1:200
Anti-FAK [pY397]
ABfinityTM (InvitrogenTM) Rabbit, monoclonal
Focal adhesion kinase
pSer397 1:300
Table 4. Secondary antibodies used in immunocytochemistry.
Antibody Excitation maximum (nm) Emission maximum (nm) Observed colour Dilution Alexa Fluor 488 goat
anti-mouse IgG (Invitrogen) 495 519 Green 1:300
Alexa Fluor 488 goat
anti-rabbit IgG (Invitrogen) 495 519 Green 1:300
Alexa Fluor 594 goat
anti-rabbit IgG (Invitrogen) 590 617 Red 1:300
Alexa Fluor 568 Phalloidin
Each condition described in section 2.3.2 contained 9 coverslips, for each set: 3 were incubated with DAPI, Phalloidin, and anti-FAK antibody; 3 were incubated with DAPI, Phalloidin, and anti-FAK pY397 antibody;
3 were incubated with DAPI, anti-FAK antibody, and anti-FAK pY397 antibody.
3.6.
Data collection and analysis
In order to collect data from cell staining, 5 fields from each coverslip were photographed. To analyze the data for cell adhesion studies, the ImageJ program from Fiji was used to count cell number per coverslip, and then the GraphPad Prism program was used to carry out statistical analysis with a P value of <0,05. Data are presented as mean ± SEM (standard error of the mean). Statistical significance analysis was conducted by one way analysis of variance (ANOVA) followed by the Tukey’s test. To analyze data from cellular morphology a qualitative analysis was also carried out.
4. Results and discussion
4.1.
Crosslinking Reaction evaluation
4.1.1. Western blot
In order to evaluate if crosslinking reaction, between PEG and peptides, the western blot technique was performed, as described in section 3.2.1. Molecular weight of PEG used was 20 kD, and the molecular weight of peptides was about 0,5 KD. Taking into consideration that only proteins can be identified in this technique, and that the marker used ranges only from 250 KD to 37 kD, bands would only be observed if the reaction between PEG and peptides had occurred, once PEG is a polymer and the peptides are too small to alone ‘be caught’ in the gel.
After about 30 min, when the samples entered the running gel, it was observed that the running front was not linear, and it seemed that some wells were destroyed/deformed.
When running was finally stopped, it was evident that the gel wells were deformed, and that the sample didn´t run in a straight line downwards, loading buffer was found throughout the running gel. The most deformed wells were those loaded with samples containing PEG. Due to this result, no further steps were executed in the western blot, and no data was collected from this technique.
This technique was attempted twice, and in both assays the same occurred, all wells containing PEG were totally deformed, and the running buffer was dispersed throughout the running gel. The only explanation plausible for this event is that 4-Arm PEG-SCM have quite big arms, and a considerable molecular weight. PEG’s structure is not altered with the loading buffer, in other words, it can´t be denatured like proteins. Because of this, PEG’s long arms do not easily pass through running gel pores, and because the electrical pulse pulls samples down the gel, the gel pores start to breakdown. Because of this, western blot analysis was excluded as a technique to evaluate the crosslinking reaction between PEG and peptides.
4.1.2. FTIR
As an alternative the FTIR technique described in section 3.2.2.2 was used. Although the methodology is simple, handling and interpretation of data is very complex and requires a great deal of experience to perform a detailed and correct analysis.
Samples were prepared, and the data handling and interpretations was carried out with the support of Prof. Alexandra Nunes, who has great expertise in this area.
In order for PEG to react with the peptide, it has to lose the NHS-ester group to the NH-terminal group of the peptide covalently bound to PEG. The peak of spectra found in the literature and tables of wavelengths that correspond to the loss of NHS-ester bonds, is around 1650 cm-1.
Figure 19. Loss of NHS-ester bonds general spectra.
Figure 20. Loss of NHS-ester bonds detailed spectra. (Resolution 8 cm-1)
As a first examination of data in Figure 19, all spectra looked generally the same, showing no apparent relevant differences. But after a thorough examination of the data, alterations between spectra in the peak of 1642 cm-1 were found (Figures 19 and 20).
Being that the resolution of the FTIR spectrometer 8 cm-1, the peak of 1642 cm-1 can be related to the peak of 1650 cm-1, described in the literature, the latter corresponds to the loss of NHS-ester bonds.68
This result suggest that NHS-ester bond at the end of each PEG arm has been loss, leaving space for the N-terminal of the peptides to form covalent bonds with PEG arms.
4.2.
Effect of the APP RERMS enriched matrix on SH-SY5Y
cell adhesion
This experiment was performed in order to evaluate the effect of PEG, and the effect of the peptides RGDS, as a positive control, and RERMS as the peptide of study. Peptides were covalent linked to PEG by a crosslinking reaction that was validated as described above By carrying this