THE IMPACT OF SOCIAL SUPPORT ON ACADEMIC MOTIVATION
LEVELS IN HIGHER EDUCATION
Cristina Costa-Lobo
1, Patrícia da Silva
1, Alexandra Ribeiro
2, Stéphanie Silva
21
Portucalense University & Portucalense Institute of Neuropsychology and Cognitive and
Behavioral (PORTUGAL)
2
Portucalense University (PORTUGAL)
Abstract
The study presented reveals the procedures, presents and discusses the results of an investigation with the main objective of evaluate the effect of social support on the academic motivation of university students, and to analyze the psychometric characteristics of the scales used. The instruments used in the protocol of investigation are a Sociodemographic Questionnaire, the Multidimensional Scale of Perceived Social Support (MSPSS) and the Motivation to Learn – University students (EMA-U). This study was conducted with a total of 154 students aged 18-29. On the scale of Motivation to Learn - University students, factor analysis allowed the observation of the existence of two factors, the intrinsic motivation and the extrinsic motivation. The area of student training assumed itself as a statistically significant predictor of extrinsic motivation. Regarding intrinsic motivation, we did not observe statistically significant results in the variables present in the study. Regarding social support, we verified, through the factorial analysis, the existence of three factors: Family Social Support; Social Support of Friends, and, Social Support of other significant ones. There is a tendency for high social support results and a concordance between our study and the studied literature regarding factor scores and reliability analysis. Social support in motivation to learn does not behave as a predictor of motivation, both intrinsic and extrinsic, and there is no statistically significant correlation between the two. The results show that social support does not have a significant impact on academic motivation, contrary most of the existing literature.
Keywords: Academic motivation, social support, psychometric characteristics, higher education.
1 INTRODUCTION
Motivation is, for a long time, a variable recognized as an important non-study of human behavior[1]. The study of this variable has indeed pointed to a general motivation that works for all situations, but that develops in a context that is being analyze [1]. In this sense, one could speak in several motivations, or in motivations in different contexts, motivation for an education, political motivation, among others. Regarding motivation for academic achievement, this would be a component of a more generalized construct of motivation for achievement, which in turn would be contained in an even broader construct of motivation [1]. Several authors argue as appropriate define motivation as an internal force, which emerges, regulates, and sustains all as important actions of the individual [2]. In this sense, as appropriate to refer the existence of several motivations, or of motivations in different contexts, namely motivation for education, political motivation, among others. Regarding motivation for academic achievement, this would be a component of a more generalized construct of motivation for achievement, which in turn would be contained in an even broader construct of motivation [1].
Sociocognitive approaches have defended the existence of two types of motivational orientations, namely intrinsic motivation and extrinsic motivation. In this way, the intrinsic motivation refers to the execution of activities in which pleasure is inherent to it [1]. That is, the individual seeks innovations and challenges, not being external pressures or rewards are required for accomplishing tasks, since participation in the task is a major reward. Intrinsic motivational orientation is a basis for growth, psychological integrity, and social cohesion, thus representing the positive potential of human nature [1]. Several studies conducted as indicators to assess intrinsic motivation, in relation to academic learning, curiosity to learn, persistence of students in simple tasks confronting difficulties, time spent no development of activity, absence of any kind of reward or incentive to start or complete a task, the feeling of effectiveness in relation to the actions required for performance and the desire to perform that activity [1]. Extrinsic motivation refers to the motivation to work in response to something external to the task or activity, such as to obtain material or social rewards of recognition, in order to respond to other people's requests or pressures, or to demonstrate skills and abilities [1]. The student who is
extrinsically motivated, looks for a school assignment to improve grades, receive rewards and praise, or avoid.
Over the years, it has been verified that in academic context, motivation is determinant for the quality of learning and student performance. Motivated students demonstrate being active and participatory in the learning process, seeking to capture the different information and expending the effort and dedication to develop and improve the strategies for understanding and mastering the content presented [3].
Motivation is a concept that encompasses several connotations related to learning and educational development, which has provided multiple perspectives of study. During the first years of Higher Education, the student is confronted with a number of stress factors, given the changes and challenges presented by the new educational context [4]. The challenges of transition and academic integration present some requirements, appealing to the adjusted levels of autonomy and maturity of the various students to ensure their adaptation and success [5]. To evaluate the academic motivation, we used the Motivation to Learn - University Scale (EMA-U), which is not validated for the Portuguese population.
With regard to social support, this was a concept considered as polysemic and heterogeneous, but gradually and progressively became operational [6]. This is due to the contributions of social support models, such as the Network Model, the Received Support Model and the Perceived Support Model, as well as the effort expended in the attempt to operationalize the concepts through the creation of different Instruments of this construct [7]. Regarding the origin of the concept of social support, it is believed that it was present in the epidemiological studies carried out by Cassel in the 1970s, where he emphasized psychosocial processes in the etiology of certain diseases, namely those related to stress [6]. It is a multidimensional concept that refers to the material and psychological resources to which people have access through their social networks [6]. Social support has been shown to be a relevant variable for the disease, for health and for well-being. A variety of instruments are available to evaluate this construct that is considered of great relevance and complex definition, involving several types and categories, which come from diverse sources, dimensions and components, being these characterized as resources between the provider and the receiver, as to promote the well-being of the recipient [8]. On the other hand, the resources provided by others do not always have positive effects on the beneficiary [8]. Several investigators have observed that the absence of adequate social support is related to the severity of physical and psychological symptoms, acting as a barrier between life events that are originally stressful and the manifestation of symptoms in individuals [8]. The basis of social support is the ability to provide and obtain care that is relevant to the individual and the group according to their vital needs. However, there is an interaction between the motivations, the emotions, the information processing routines, and the behaviors that cause distinct internal patterns of neurophysiological activity that can be termed social mentalities [8]. The basis of social support is the ability to provide and obtain care that is relevant to the individual and the group according to their vital needs. However, there is an interaction between the motivations, the emotions, the information processing routines, and the behaviors that cause distinct internal patterns of neurophysiological activity that can be termed social mentalities [8]. Social support comprises several types of support that an individual acquires from others and are classified into three types of categories, namely, emotional, instrumental, and informational support. In turn, the social support of an individual comes from the existence of people, who can be trusted, who reveal concern, who value and show affection for the person, aiming at high self-esteem [7]. Regarding emotional social support, it is sometimes referred to as psychological [8].
While instrumental support covers all types of tangible support, including financial support, support in childcare, home care or even transportation. Finally, informational support is sometimes included in instrumental social support and refers to the help that others can provide through the provision of information. The social support that is referred to in the last two categories is sometimes referred to as non-psychological [8]. Was used the Multidimensional Social Support Scale (MSPSS) in order to evaluate the social support of family, friends and other significant individuals, presenting psychometric characteristics of the Portuguese version of the MSPSS [8]. Consequently, this article aims to verify the impact of Social Support on Academic Motivation in university students. Taking this objective into account, we define university students as public and private institutions
2 METHODOLOGY
2.1 Participants
The sample is made up of 154 university students, of which 122 (79.2%) are female and 32 (20.8%) are male. The age of the students is between 18 and 29 years, with an average value of 21 years of age (SD = 2.02). Of the 154 students, 152 are unmarried (98.7%). 63 students attend the first year of the degree (40.9%), 35 the second year of the degree (22.7%), 43 are in the 3rd year of undergraduate degree, only 1 student attends the 4th year of licentiate (0.6%) and 12 7.8%), the sample being very diversified in terms of the course and the educational institution.
2.2 Instruments
Social Support: Multidimensional Scale of Perceived Social Support (MSPSS; Carvalho, Pinto, Pimentel, Maia, & Mota-Pereira, 2011)
Academic motivation: Motivation to Learn – University students (EMA-U). (EMA-U; Boruchovitch & Neves, 2005)
2.3
Procedures
The data collection procedure was carried out through an online platform (Google Docs), with voluntary participation, guaranteed quality and confidentiality of the information on which they were provided, noting that banks were treated only for academic and scientific purposes. It was also explained in writing to each participant the purpose of the work and referenced that all as answers were mandatory. Subsequently, a statistical analysis of the results for version 12.0 of the program Statistical Package for Social Sciences (SPSS).
3 RESULTS
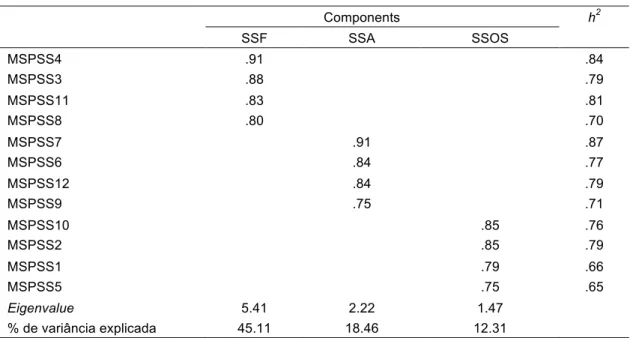
Table 1. Principal Components Analysis of Perceived Social Support Items (N = 154)
Components h2 SSF SSA SSOS MSPSS4 .91 .84 MSPSS3 .88 .79 MSPSS11 .83 .81 MSPSS8 .80 .70 MSPSS7 .91 .87 MSPSS6 .84 .77 MSPSS12 .84 .79 MSPSS9 .75 .71 MSPSS10 .85 .76 MSPSS2 .85 .79 MSPSS1 .79 .66 MSPSS5 .75 .65 Eigenvalue 5.41 2.22 1.47 % de variância explicada 45.11 18.46 12.31
Based on the responses to the 12 items of evaluation of the perceived social support, a factor analysis was performed using the principal component analysis method with varimax rotation. The Kaiser-Mayer-Olkin test (KMO = .82) and Bartlett's Sphericity (χ2 (66) = 1259.08, p <.001) allowed us to verify that the data are factorizable. Commodities greater than .20 were got in all items (varying from .64 to .87), which shows adequate levels of relation between items and factors. Through analysis of principal components (Table 1), three factors with eigenvalue greater than unity, which in your aggregated explain for 75.89% of the total data variance. The first factor, with its own value = 5.41, explains 45.11% of the variance and integrates 4 items (MSPSS4, MSPSS3, MSPSS11, MSPSS8). Factor
saturations for this factor range from .80 (MSPSS8) to .91 (MSPSS4). The second factor, with its own value = 2.22, explains 18.46% of the total data variance. This factor integrates 4 items (MSPSS7, MSPSS6, MSPSS 12, MSPSS9) and has factorial loadings ranging from .75 (MSPSS9) to .91 (MSPSS7). Finally, the third factor, with its own value = 1.47, explains 12.31% of the total data variance and integrates the remaining 4 items (MSPSS10, MSPSS2, MSPSS1, MSPSS5). Factor saturations for this subscale range from .75 (MSPSS5) to .85 (MSPSS10).
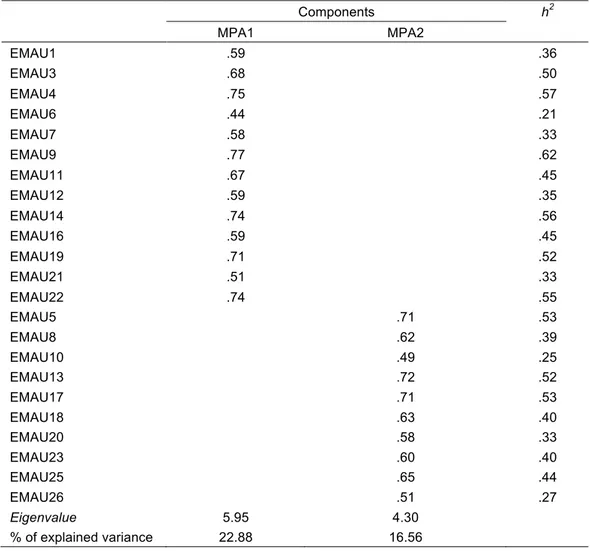
Table 2. Principal Components Analysis of Perceived Social Support Items (N = 154)
Components h2 MPA1 MPA2 EMAU1 .59 .36 EMAU3 .68 .50 EMAU4 .75 .57 EMAU6 .44 .21 EMAU7 .58 .33 EMAU9 .77 .62 EMAU11 .67 .45 EMAU12 .59 .35 EMAU14 .74 .56 EMAU16 .59 .45 EMAU19 .71 .52 EMAU21 .51 .33 EMAU22 .74 .55 EMAU5 .71 .53 EMAU8 .62 .39 EMAU10 .49 .25 EMAU13 .72 .52 EMAU17 .71 .53 EMAU18 .63 .40 EMAU20 .58 .33 EMAU23 .60 .40 EMAU25 .65 .44 EMAU26 .51 .27 Eigenvalue 5.95 4.30 % of explained variance 22.88 16.56
Based on the answers to the 26 evaluation items of the motivation to learn from university students, we initially tried to extract the factors based on eigenvalue but the structure obtained was not interpretable. Given that factors 5 and 6 do not have items with saturation equal to or above .40 was try to extract the factors by forcing the extraction of two factors according to the theoretical construction of the scale. The factorial analysis was performed using the principal components analysis method with varimax rotation. The Kaiser-Mayer-Olkin test (KMO = .82) and Bartlett's Sphericity (χ2 (276) = 1576.69, p <.001) allowed us to conclude that the data are factorizable. In all items, except for item 2 and item 24 that we chose to exclude, commonalities above .20 were obtained, ranging from .21 (EMAU6) to .62 (EMAU9), which shows adequate levels of relation between Items and factors. Through analysis of principal components (Table 2) two factors with eigenvalue greater than unity were identified, which together account for 39.45% of the total variance of the data. The first factor, with its own value = 5.95, explains 22.88% of the total data variance and integrates 13 items (EMAU1, EMAU3, EMAU4, EMAU6, EMAU7, EMAU9, EMAU11, EMAU12, EMAU14, EMAU16, EMAU19, EMAU21, EMAU22). The loadings for this factor vary between .44 (EMAU6) and .77 (EMAU9). The second factor, with its own value = 4.30, explains 16.56% of the total variance of the data. This factor includes the remaining 11 items (EMAU5, EMAU10, EMAU13, EMAU15, EMAU17, EMAU18, EMAU20, EMAU23, EMAU25, EMAU26), with factorial weights ranging from .49 (EMAU10) to .71 (EMAU17).
Table 3. Reliability Analysis of SSF Items (α = .90)
M DP Ritc alfa if…
MSPSS4 4.36 .88 .82 .85
MSPSS3 4.55 .72 .77 .87
MSPSS11 4.41 .83 .80 .86
MSPSS8 4.10 .98 .73 .89
In order to analyze the reliability of the Multidimensional Scale of Perceived Social Support, through the analysis of internal consistency we used Cronbach's Alpha. The first identified factor (SSF) has α = .90, which indicates a very satisfactory scale accuracy. By reading table 3, corrected correlations of the items with the subscale total are found, all items are greater than the critical value of .20, ranging from .73 (MSPSS8) to .82 (MSPSS4). It is also verified that no item if eliminated causes an increase in the alpha value.
Table 4. Reliability Analysis of SSA Items (α = .90)
M DP Ritc alfa if…
MSPSS7 4.27 .77 .86 .85
MSPSS6 4.22 .75 .78 .88
MSPSS12 4.32 .78 .79 .87
MSPSS9 4.48 .66 .73 .90
Concerning the second factor (SSA), α = .90 was obtained, also indicating a high internal consistency of the factor. Through the reading of table 4, corrected correlations of the item with the subscale total above .20, varying between .73 (MSPSS9) and .86 (MSPSS7) are observed. Subsequently, it is visible in the analyzes that no item if excluded causes an increase of the initial alpha value for this subscale.
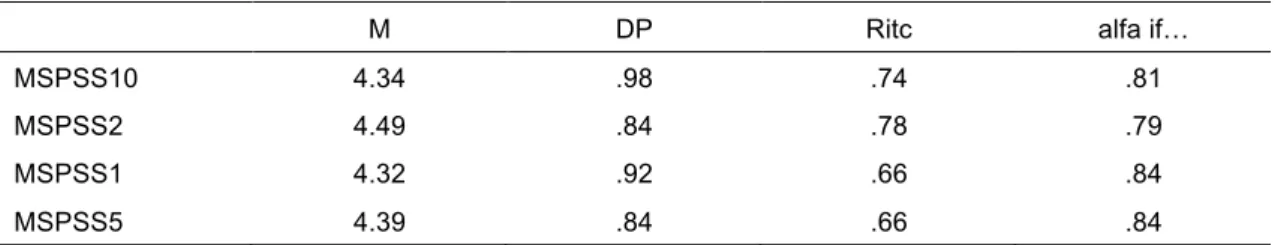
Table 5. Reliability Analysis of SSOS Items (α = .86)
M DP Ritc alfa if…
MSPSS10 4.34 .98 .74 .81
MSPSS2 4.49 .84 .78 .79
MSPSS1 4.32 .92 .66 .84
MSPSS5 4.39 .84 .66 .84
Regarding the third and last factor (SSOS), α = .86 was obtained, indicating a good internal consistency of this factor. Table 5 shows the corrected corrections of the item with the subscale total of more than .20, ranging from .66 (MSPSS1 and MSPSS5) to .78 (MSPSS2). No items taken out result in an increase in the initial alpha value for this factor. In this way, we can conclude that the Multidimensional Scale of Perceived Social Support presents a good internal consistency.
Table 6. Reliability Analysis of MPA1 Items (α = .88)
M DP Ritc alfa if…
EMAU1 4.40 .65 .51 .88 EMAU3 4.37 .72 .60 .87 EMAU4 3.50 1.00 .66 .87 EMAU6 4.10 .80 .38 .88 EMAU7 4.15 .75 .51 .88 EMAU9 4.25 .71 .70 .87 EMAU11 3.37 .94 .60 .87 EMAU12 3.75 .95 .52 .88 EMAU14 3.92 .81 .67 .87 EMAU16 3.71 .79 .57 .88 EMAU19 4.07 .79 .63 .87 EMAU21 3.48 1.18 .49 .88 EMAU22 3.78 .89 .68 .87
The reliability of the Motivation Scale to Learn - University students was analyzed through the internal consistency analysis using Cronbach 's Alpha. The first identified factor (MPA1), obtained α = .88, indicating a good internal consistency of this factor. Through reading 6, corrected correlations of the item with the subscale total of more than .20, varying between .38 (EMAU6) and .70 (EMAU9) are verified. No items taken out result in an increase of the starting alpha for this subscale.
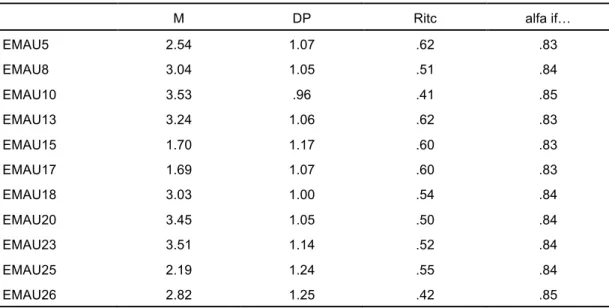
Table 7. Analysis of the Reliability of MPA2 Items (α = .85)
M DP Ritc alfa if…
EMAU5 2.54 1.07 .62 .83 EMAU8 3.04 1.05 .51 .84 EMAU10 3.53 .96 .41 .85 EMAU13 3.24 1.06 .62 .83 EMAU15 1.70 1.17 .60 .83 EMAU17 1.69 1.07 .60 .83 EMAU18 3.03 1.00 .54 .84 EMAU20 3.45 1.05 .50 .84 EMAU23 3.51 1.14 .52 .84 EMAU25 2.19 1.24 .55 .84 EMAU26 2.82 1.25 .42 .85
Regarding the second factor (MPA2), it has α = .85, indicating a good internal consistency of this factor. Table 7 shows corrected corrections of the item with the subscale total greater than .20, ranging from .41 (EMAU10) to .62 (EMAU5 and EMAU13). No item is withdrawn causes an increase in the initial value for this factor, thus concluding that this factor contributes to the internal consistency of this scale.
An analysis of variance was conducted through One-Way ANOVA to analyze the variance of social support and it was verified that there are no statistically significant differences in the different training areas (namely the Humanities, Economic Sciences and The sciences and technologies) and in the levels of social support of the family, F (2,151) = .72, p> .05. Subsequently, the results also showed that there are no statistically significant differences in the area of formation and levels of social support
of friends, F (2,151) = .31, p> .05. Finally, it was also found that there are no statistically significant differences in the area of training and social support levels of other significant ones, F (2,151) = .89, p> .05.
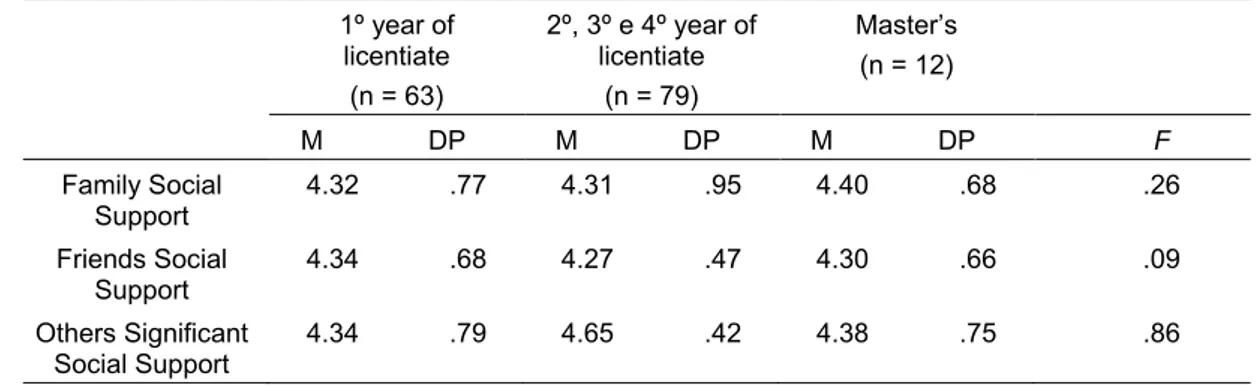
Table 8. Variance Analysis of Social Support in the Cycle of Studies (N = 154)
• • 1º year of licentiate (n = 63) 2º, 3º e 4º year of licentiate (n = 79) Master’s (n = 12) M DP M DP M DP F Family Social Support 4.32 .77 4.31 .95 4.40 .68 .26 Friends Social Support 4.34 .68 4.27 .47 4.30 .66 .09 Others Significant Social Support 4.34 .79 4.65 .42 4.38 .75 .86
Table 8 shows that there are no statistically significant differences in the three levels of the study cycle (the first level corresponds to the 1st year of the Degree, the second level to the 2nd, 3rd and 4th year of the Degree and the third level to the Master ) And in the social support levels of the family, F (2,151) = .26, p> .05. Subsequently, the results also demonstrated that there are no statistically significant differences without study cycle and social support levels of friends, F (2,151) = 0.09, p> 0.05. Finally, was verified that there are no statistically significant differences without study cycle and levels of social support of other signifiers, F (2,151) = 0,86, p> 0,05.
Table 9. Analysis of Social Support Regarding Sex (N = 154)
Male (n = 32) Female (n = 122) M DP M DP t
Family Social Support 4.33 .72 4.36 .76 -.21 Friends Social Support 4.29 .56 4.29 .67 1.17 Others Significant Social Support 4.32 .65 4.39 .78 -.50
With the use of the t-student test for independent samples, it was observed from table 9 that there are no statistically significant differences between female students and male students in relation to family social support, t (152) = -21.It was also verified that there are no statistically significant differences between female students and male students in relation to social support friends, t (152) = 1.17, p> .05. Finally, we can conclude that there are no statistically significant differences between female students and male students in relation to other social support, t (152) = -.50, p> .05.
It was observed, after conducting the t-student test for independent groups, that there are no statistically significant differences between attending a public or private educational institution at the levels of social support of the family, 1.72, p .05. Likewise, it was found that there are no statistically significant differences between attending a public or private educational institution at the levels of social support of friends, t (152) = -18, p> .05. And finally, we do not observe statistically significant differences between studying in a public or private institution in the levels of social support of significant others, t (152) = .38, p> .05.
Table 10. Variance Analysis of Motivation in the Training Area Human Sciences (n = 43) Sciences and Technologies (n = 77) Economic Sciences (n = 34) F M DP M DP M DP Intrinsic Motivation 3.91 .60 3.91 .56 3.89 .43 .02 Extrinsic Motivation 2.99 .64 2.67 .70 2.76 .68 2.97*
One-way ANOVA was used to analyze the motivation variance. By reading table 10, it is possible to verify that the results indicated that there are no statistically significant differences in the areas of training (Human Sciences, Sciences and Technologies, Economics) in the levels of intrinsic motivation, F (2,151) = .02, p > .05. Regarding extrinsic motivation, the results indicate that there are differences in the areas of training (Human Sciences, Science and Technology, Economic Sciences) in the levels of extrinsic motivation, F (2,151) = 2.97, p <.05. Bonferroni Post-Hoc tests allow us to observe that students with a background in Human Sciences have significantly higher levels of extrinsic motivation (M = 2.99, SD = .64) than students with a background in Science and Technology (M = 2.6, SD = .70), p <.05.
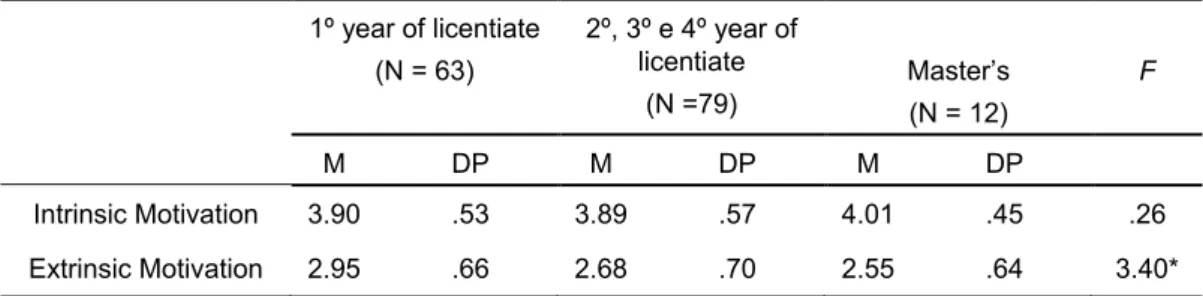
Table 11. Variance Analysis of Motivation in the Cycle of Studies
• 1º year of licentiate (N = 63) 2º, 3º e 4º year of licentiate (N =79) Master’s (N = 12) F M DP M DP M DP Intrinsic Motivation 3.90 .53 3.89 .57 4.01 .45 .26 Extrinsic Motivation 2.95 .66 2.68 .70 2.55 .64 3.40*
Table 11 shows that there are no statistically significant differences in the three levels of the study cycle (the first level corresponds to the 1st year of the Degree, the second level to the 2nd, 3rd and 4th year of Degree and the third level to masters) and in intrinsic motivation, F (2,151) = .26, p> .05. Subsequently, the results also demonstrated that there are statistically significant differences in the study cycle and extrinsic motivation, F (2,151) = 3.40, p <.05. Bonferroni's Post Hoc tests show that students in the first year of the degree (M = 2.95, SD = .66) have significantly higher levels than the 2nd, 3rd and 4th year undergraduate students (M = 2.68, SD = .70) In extrinsic motivation.
Through the t-student test for independent samples it was observed that there are no statistically significant differences between female students and male students in relation to intrinsic motivation, t (152) = .57, p> .05. Likewise, there are no statistically significant differences between female students and male students in relation to extrinsic motivation, t (152) = -1.35, p> .05.
Table 12. Variance Analysis of Intrinsic Motivation and Extrinsic Motivation in the Public Institution or Private Institution
•
Public Institution Private Institution
M DP M DP t Intrinsic Motivation 3.88 .57 3.92 .54 .69 Extrinsic Motivation 2.71 .52 2.82 .77 .30
Subsequently, through the reading of table 12, it was verified that there are no statistically significant differences between attending a public or private teaching institution in intrinsic motivation, t (152) = .69, p> .05. Likewise, it has been found that there are no statistically significant differences between attending a public or private educational institution in extrinsic motivation, t (150) = .30, p> .05.
4 CONCLUSIONS
On the Motivation Scale for Learning - University Students (EMA-U) the values of alpha and percentage of total variance explained for each factor were identical to the results of the original article of the scale analyzed (Boruchovitch, 2008) as well as reliability analysis, since the alphas of both studies range from .76 and .88. There was also a tendency for relatively high values of motivation, demonstrating consensus among researchers on the existence of two forms of motivation in humans. It was verified that the social support of other significant ones and the cycle of studies are predictors of the extrinsic motivation, being that the students of the first year of degree consider the superior levels of extrinsic motivation when compared with the students of the cycles of studies. The field of training of university students is also a statistically significant predictor of extrinsic motivation, which students of Human Sciences are statistically superior compared to students of Science and Technology. There was no evidence of statistically significant correlations between intrinsic motivation and social support. Such facts contradict the existing literature, since Eccheli (2008) affirms that social support, especially what contributes to the increase of the perception of competence or positive performance in an activity, increases the intrinsic motivation. In the Multidimensional Perceived Social Support Scale (MSPSS) the results reported in the present study are similar to the results observed in the original article of the Multidimensional Scale of Perceived Social Support, Portuguese version [8] - the three equal factors were observed in both studies. When analyzing the variance of social support in sex, in the present study, it was verified the existence of no statistically significant differences, contrary to what was exposed by [8], since the latter reports the existence of differences in social support in relation to the female and male sex, with the female having the highest values in the three types of social support. The study cycle as well as the sample training area is also not a statistically significant predictor of social support.
This absence of significant results leads us to conclude that being a university student of a public or private institution, as well as the training area that attends independently of the teaching cycle, are not associated with the social support of family, friends and others Significant. The limitations of the study are: Sample reduced and specific, the motivation studied be directed only to the target learn and questionnaires realized online. For future studies is suggest: Corporate evaluations among students of private higher education and public higher education and longitudinal studies. Only through a longitudinal study can we truly know the predictive potential of the selected variables. To this goal, it would be necessary to reach a larger number of courses to conclude if the observed pattern of results would be maintained. Therefore, there are implications for future studies and for the development of vocational intervention strategies and career management, with particular interest to psychological support offices in higher education. The results showed direct and future research and psychological intervention concerning the academic motivation. This study is an effective contribution to the understanding of the adaptation and integration of these students as well as to the study of their well-being. It is important to carry out studies in which the relationship of these variables is studied in different samples of higher education for the higher education institutions are sufficiently supported by creating the necessary resources to favor the adaptation and well-being of its students.
REFERENCES
[1] Martinelli, S. M., & Bartholomeu, D. (2007). Escala de Motivação Acadêmica: Uma medida de motivação extrínseca e intrínseca. Avaliação Psicológica, 6(1), 21-31.
[2] Todorov, J. C., & Moreira, M. B. (2005). O conceito de motivação em psicologia. Revista Brasileira de Terapia Comportamental e Cognitiva, VII, 119-132.
[3] Ramos, S. I. (9 de Março de 2013). Motivação académica dos alunos do ensino superior. Psicologia.pt.
[4] Santos, A. A., Mognon, J. F., Lima, T. H., & Cunha, N. B. (Julho-Dezembro de 2011). A relação entre vida académica e a motivação para aprender em universitários. Revista Semestral da Associação Brasileira de Psicologia Escolar e Educacional, 15(2), 283-290.
[5] Soares, A. B., Francischetto, V., Dutra, B. M., Miranda, J. M., Nogueira, C., Leme, V. R., Almeida, L. S. (2014). O impacto das expectativas na adaptação académica dos estudantes no ensino superior. Psico-USF, 19(1), 49-60.
[6] Vaz, T. R. (2010). Vivências académicas e suporte social na adaptação ao ensino superior dos estudantes do 1º ano da Universidade da Beira Interior. Tese de Mestrado , Universidade da Beira Interior, Departamento de Psicologia e Educação, Covilhã.
[7] Siqueira, M. M. (2008). Construção e Validação da Escala de Perceção de Suporte Social. Psicologia em Estudo, 13(2), 381-388.
[8] Carvalho, S., Pinto, G. P., Pimentel, P., Maia, D., & Mota-Pereira, J. (2011). Características psicométricas da versão portuguesa da Escala Multidimensional de Suporte Percebido (Multidimensional Scale of Perceived Social Support - MSPSS). Psychologica, 54, 309-358.