UNIVERSIDADE DE LISBOA
FACULDADE DE CIÊNCIAS
DEPARTAMENTO DE INFORMÁTICA
TRANSCRIPTOME PROFILING OF SPINAL
MUSCULAR ATROPHY MODELS USING RNA-SEQ
Francisco Maria de Aboim Borges Fialho de Brito
DISSERTAÇÃO
MESTRADO EM BIOINFORMÁTICA E BIOLOGIA COMPUTACIONAL
ESPECIALIDADE EM BIOINFORMÁTICA
UNIVERSIDADE DE LISBOA
FACULDADE DE CIÊNCIAS
DEPARTAMENTO DE INFORMÁTICA
TRANSCRIPTOME PROFILING OF SPINAL
MUSCULAR ATROPHY MODELS USING RNA-SEQ
Francisco Maria de Aboim Borges Fialho de Brito
DISSERTAÇÃO
MESTRADO EM BIOINFORMÁTICA E BIOLOGIA COMPUTACIONAL
ESPECIALIZAÇÃO EM BIOINFORMÁTICA
Tese orientada pela Prof. Doutora Margarida Gama-Carvalho
e co-orientada pela Doutora Andreia Amaral
i
This thesis resulted in the publication of an article and a poster.
Article
- Amaral AJ, Brito FF, Chobanyan T, Yoshikawa S, Yokokura T, Van Vactor D and Gama-Carvalho M (2014). Quality assessment and control of tissue specific RNA-seq libraries of Drosophila transgenic RNAi models. Front. Genet. 5:43. doi: 10.3389/fgene.2014.00043
Poster
- Francisco Brito, Andreia J. Amaral, Takakazu Yokokura, David van Vactor and Margarida Gama-Carvalho (2013). A roadmap for tissue specific RNA-seq analysis of Drosophila shRNA models. Molecular Biology in Portugal and EMBL (and EMBL Alumni), 18th July 2013, Lisboa, Portugal.
ii
Abstract
Spinal Muscular Atrophy (SMA) is a neurodegenerative disorder that represents the second most common cause of hereditary infant death. It is caused by the reduced expression of the ubiquitous protein SMN (Survival of Motor Neuron), which is known to have a central function in the assembly of ribonucleoprotein complexes involved in pre-mRNA splicing. More recently, this protein has been reported to be involved in trafficking of mRNA molecules along neuron axons. Although the SMA causing gene has been identified for over a decade, the exact mechanisms that lead to the specific death of motor neurons remain unclear. A long-standing hypothesis suggests that the disease emerges from motor-neuron specific changes in pre-mRNA splicing that affect key genes required for the survival of these cells. A possible approach to identify these genes is whole-transcriptome profiling. Nowadays, one of the most powerful tools for transcriptome profiling is next generation RNA sequencing (RNA-Seq), which can provide data with minimal biological variation between replicates, resulting in a precise comparison of different phenotypes. However this is not a bias-free technique and library preparation and sequencing problems can introduce several artifacts which need to be addressed.
Here we present an RNA-Seq study of disease models based on D. melanogaster and H. sapiens iPSC cultures developed to help unravel the pathways related to SMN down-regulation and SMA by identifying changes in gene expression and transcript isoform expression.
During the development of the analysis pipeline for Drosophila, several difficulties were encountered, emerging from the inherent complexity of the process of preparing tissue specific RNA samples requiring dissection and pooling of multiple larvae brains, and the presence of an shRNA expression vector. This resulted in intra-treatment variance that needed to be addressed and stabilized. Furthermore, we found that some widely used algorithms for discovery of novel transcript isoforms can perform poorly on Drosophila, requiring the selection of alternative approaches. Similarly, the human analysis pipeline showed a high amount of variance due to the limited number of individuals used to create iPSC libraries, introducing bias in the analysis.
Finally, we showed via comparison of differentially expressed ortholog genes that changes caused by SMN down-regulation affect several conserved genes across species, making Drosophila a favourable approach for modelling SMA.
iii
Resumo
A Atrofia Muscular Espinhal (SMA) é uma doença neuro-degenerativa que representa a segunda causa mais comum de morte infantil hereditária. É causada pela expressão reduzida da proteína ubíqua SMN (Survival of Motor neuron), que tem uma função central na assemblagem de complexos ribonucleoproteicos envolvidos no splicing do pre-mRNA. Recentemente, esta proteína também foi reportada como estando envolvida no tráfego de moléculas de mRNA ao longo dos axónios. Apesar do gene causador da SMA estar identificado há mais de uma década, os mecanismos que levam à morte dos neurónios motores continuam por descobrir. Uma das hipóteses sugere que a doença emerge devido a alterações de eventos de splicing no pre-mRNA em neurónios motores, afectando genes chave necessários para a sobrevivência destas células.
Uma abordagem possível para identificar estes genes é o estudo do perfil do transcriptoma, que permite identificar como alterações de expressão génica e padrões de splicing podem levar à activação de vias moleculares relacionadas com a doença. Hoje em dia, uma das ferramentas mais poderosas para estudar o transcriptoma é a sequenciação de RNA usando métodos de “Next Generation Sequencing”, mais conhecida por RNA-seq, que produz dados com o mínimo de variação biologica entre replicados, resultando em comparações precisas entre fenótipos. Esta técnica produz vários milhões de pequenas sequências de nucleótidos chamadas reads que, quando alinhadas a um genoma de referência, permitem quantificar os níveis de expressão do transcriptoma, servindo como a base de comparação entre diferentes condições. Porém, esta técnica não é livre de problemas de enviesamento e a preparação das bibliotecas e erros durante a sequenciação podem introduzir vários artefactos que necessitam de ser tratados.
Nesta tese apresentamos um estudo de RNA-Seq de modelos de doença de D. melanogaster e culturas de iPSC de H. sapiens desenvolvidas com o objectivo de caracterizar as vias biológicas relacionadas com a sub-expressão do SMN e as causas da SMA através da identificação de alterações na expressão génica e isoformas dos transcritos.
D. melanogaster é um modelo de doença que apresenta um grande número de genes conservados quando comparado a humanos. Também tem um sistema nervoso complexo, essencial para um estudo eficaz de doenças neurodegenerativas a um nível molecular. Devido a estas características, modelos de doença humana podem ser facilmente gerados em drosófila através do uso de vectores de expressão de “small hairpin RNA” (shRNA) para alterar a expressão do gene causador da doença homologo num tecido especifico ou em todo o organismo.
Para estudar os efeitos da sub-expressão de SMN em D. melanogaster foram produzidas bibliotecas de RNA-seq do sistema nervoso central de moscas com três
iv
fenótipos diferentes: um controlo, um modelo baseado em shRNA que provoca um knock-down médio da expressão de SMN em neurónios e um modelo severo de SMA. Durante a análise, encontrámos vários problemas que emergiram da complexidade inerente do processo de preparar amostras de RNA de um tecido especifico, que requerem a dissecção e pooling de múltiplos cérebros de larva e da presença de um vector de expressão de shRNA. Isto resultou em variância entre replicados que precisaram de ser tratados e estabilizados. De modo a identificar se as bibliotecas estariam contaminadas por tecido não-neuronal, criámos um método baseado comparação dos níveis normalizados de expressão de genes com expressão específica em tecidos neuronais e expressão específica em tecidos não neuronais. Este método conseguiu identificar um padrão específico de expressão génica neuronal, dando-nos uma ferramenta para remover bibliotecas com um elevado nível de contaminação de tecido não neuronal.
Uma nova ronda de sequenciação mostrou reduzidos níveis de contaminação por tecido não neuronal porém, ao fazer uma análise de expressão diferencial entre os níveis de expressão dos genes do controlo vs SMA médio, SMN não foi encontrado como diferencialmente expresso. Concluímos que tal estaria associado ao facto do sistema nervoso central ser um tecido complexo e algumas das suas componentes, como as células da glia, não são afectadas pelo shRNA devido a não possuírem elav, necessário para a expressão do shRNA. Isto levou-nos a produzir uma terceira ronda de sequenciação, contendo o modelo severo de SMA, onde os niveis de expressão de SMN estão reduzidos em todos os tecidos. Nesta ronda encontrámos alterações no conteúdo de GC que foram demonstradas como estando relacionadas com duplicações de reads feitas pelas rondas de PCR antes de se efectuar a sequenciação. Neste modelo, a análise dos dados encontrou SMN como diferencialmente expresso bem como, ao efectuar uma “gene set enrichment analysis” (GSEA), vários processos biológicos enriquecidos relacionados com SMA e a sub-expressão de SMN. Uma análise de sub-expressão diferencial de isoformas revelou várias alterações atribuídas à falta de expressão de SMN, previamente observadas em outros estudos. Por último também observámos que alguns dos algoritmos muito usados para a descoberta de novas isoformas de transcritos têm uma performance pobre em drosófila, requerendo a utilização de abordagens alternativas.
O modelo usado nesta tese para o estudo de SMA em humanos é baseado em iPSC (induced Pluripotent Stem Cells). São culturas de células estaminais estáveis desenvolvidas a partir de células somáticas adultas através da expressão de quatro genes (Oct4, Sox2, Klf4 e c-myc) através de vectores virais, plasmídeos ou mRNA sintetizado codificando estes factores de transcrição. Estas culturas podem ser induzidas a diferenciar-se em vários tipos de células, tornando-as numa ferramenta extremamente poderosa no estudo de doenças genéticas humanas. Vários estudos usaram com sucesso esta abordagem para o estudo de
v
doenças neurodegenerativas como Parkinson e esclerose lateral amiotrófica.
Para estudar os efeitos da SMA nos humanos, foram produzidas bibliotecas de RNA-seq de neurónios motores diferenciados de culturas de iPSC criadas a partir de fibroblastos de um individuo normal (controlo), o mesmo individuo normal com um shRNA que diminui a expressão de SMN e um paciente de SMA. A análise dos dados de RNA-seq, de um modo semelhante a D. melanogaster, mostrou grandes valores de variância entre condições devido ao número limitado de indivíduos usados para criar as bibliotecas de iPSC, enviesando a análise. Esta análise levou à conclusão de que o modelo de shRNA não diminui os niveis como esperado, não tendo sido encontrado o gene SMN1 como diferencialmente expresso quando comparado com o controlo bem como a análise entre este modelo e o paciente de SMA mostra resultados similares à análise entre o controlo e o paciente. A análise entre o controlo e o paciente revelaram uma grande variação biológica relacionada com erros de amostragem, tendo sido encontrado cerca de um terço do genoma humano como diferencialmente expresso. Apesar disso, foi possível encontrar o sinal de uma resposta de expressão génica à falta de expressão de SMN via comparação com estudos de SMA prévios, bem como alterações de expressão de isoformas relacionadas com regulação de expressão snRNPs.
Por último, apesar dos vários desafios encontrados no processamento dos dados do modelo de drosófila e o modelo humano, mostrámos através da comparação de genes ortologos diferencialmente expressos que as alterações causadas pela sub-expressão do SMN afectam vários genes conservados entre estas duas espécies, mostrando que o modelo de Drosophila é uma boa abordagem para modelar a SMA. Também propomos modificações a fazer em futuros estudos usando estes modelos de modo a diminuir os erros de preparação das bibliotecas e sequenciação, melhorando a subsequente análise dos dados.
vi
Acknowledgements
Dr. Margarida Gama-Carvalho Dr. Andreia J. Amaral
Dr. David Van Vactor Dr. Takakazu Yokokura
vii
Index
1 – Introduction & Objectives ... 1
1.1 – Transcriptome profiling ... 1
1.2 – A Bioinformatical approach to RNA-Seq data ... 2
1.3 – Disease models ... 6
1.4 – Spinal Muscular Atrophy ... 6
1.5 – Objectives... 7
2 – Materials & Methods ... 8
3 – Results & Discussion ... 12
3.1 – D. melanogaster model...12
3.1.1 – Quality assessment of mRNA-seq libraries derived from the CNS of fly larvae ... 12
3.1.2 – Characterization of the transcriptome of the CNS of neuronal Smn knockdown Drosophila lines modeling a mild SMA phenotype ... 15
3.1.3 - Characterization of the CNS transcriptome of Drosophila lines with neuronal Smn knockdown on a heterozygous null background ... 19
3.1.4 – Assessment of the effect of read trimming on nucleotide frequency bias and read coverage ... 25
3.1.5 – Comparative analysis of the transcriptome profiles of C24 and X7/C24 flies ... 26
3.2 – Transcriptome profiling of motor neurons derived from SMA patient iPSCs ...29
3.3 – Integrated analysis of human and fly SMA models ...35
4 – Final Remarks ... 37
5 – Bibliography ... 39
viii
List of Figures
Figure 1 – A typical RNA-Seq experiment. ... 2
Figure 2 – A typical analysis pipeline for NGS data. ... 3
Figure 3 – Comparison between two different approaches for aligning short sequencing reads to a genome ... 4
Figure 4 – Differences between aligning reads to the genome and the transcriptome ... 5
Figure 5 – The elav-GAL4 model. a) The elav-GAL4 construct (modifed image from Dow, Julian A T41 ) b) Representation of the Smn gene area targeted by C24. ... 8
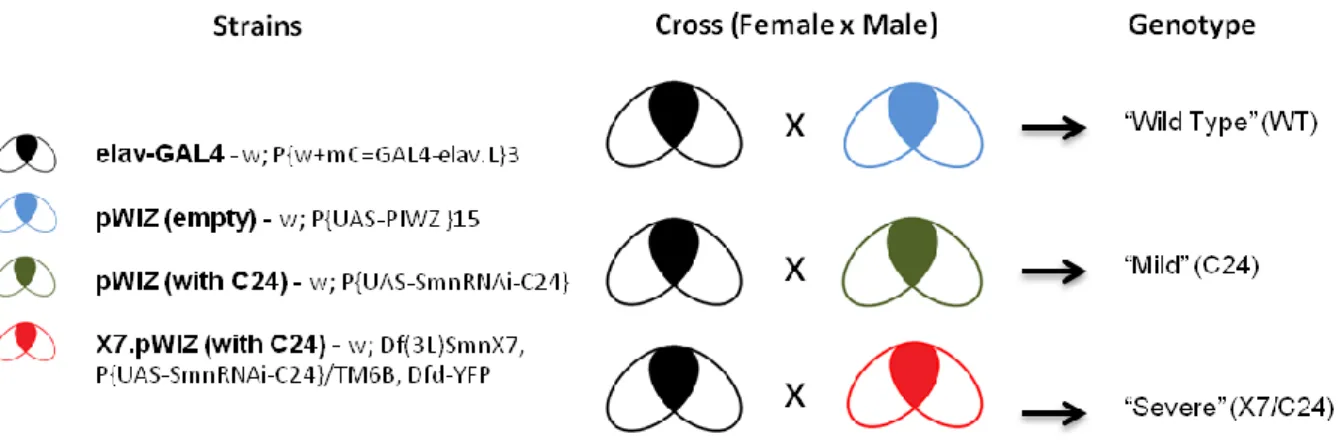
Figure 6 – Drosophila lines used in this study. Details the crosses made to obtain the studied genotypes (WT,C24 and X7/C24) ... 9
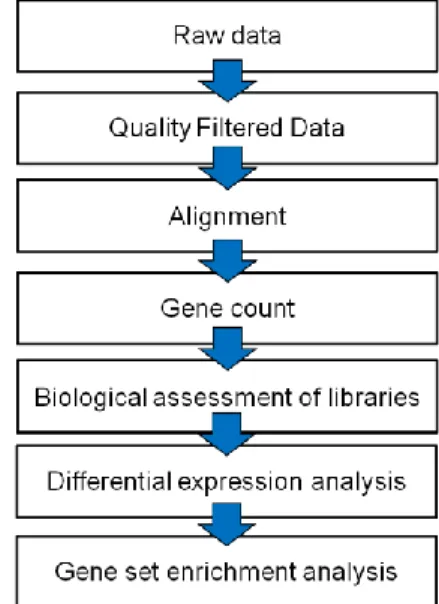
Figure 7 – Worfklow used for the analysis of the RNA-Seq libraries in both humans and flies. ... 10
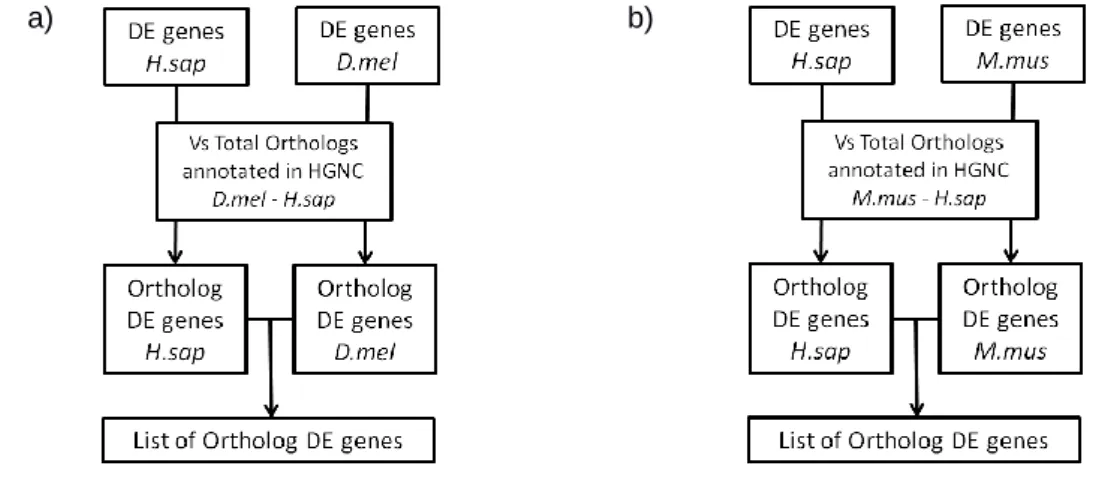
Figure 8 – Pipeline for the analysis of co-expression of a) D. melanogaster and H. sapiens ortholog genes and b) M. musculus and H. sapiens ortholog genes ... 11
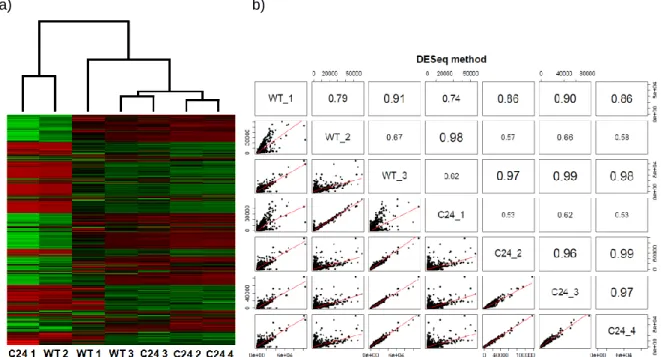
Figure 9 – Clustering and correlation analysis of the first sequencing batch. ... 13
Figure 10 – Benchmarking genes’ expression values for the first sequencing batch libraries, normalized for library size and gene length ... 14
Figure 11 – Clustering analysis of the four libraries that passed the benchmarking gene assessment ... 15
Figure 12 – Expression values of the benchmarking genes from the second sequencing batch and the first sequencing batch samples that passed the test. ... 16
Figure 13 – Clustering analysis of the second sequencing batch. As seen, C24 6 and WT 5 are not clustering according to phenotype. ... 16
Figure 14 – Transcriptome profiling of the second sequencing batch ... 17
Figure 15 – SMN read distribution. ... 19
Figure 16 – Transcriptome profiling of the X7/C24 dataset (third sequencing batch) ... 20
Figure 17 - Expression values of the benchmarking genes from the second sequencing batch and third sequencing batch samples, normalized for gene length and library size ... 21
Figure 18 – Read GC content distribution for a) Wildtype and b) X7/C24 ... 21
Figure 19 – Intron feature/protein coding feature ratio for the second and third sequencing batch libraries on reads with 19-40% of GC content. ... 22
Figure 20 – Number of DE exons found on each gene predicted to be modified by the U12 snRNP. . 24
Figure 21 – Example of aberrant transcripts predicted by the Cufflinks algorithm resulting from an artificial fusion of sequencing reads from closely positioned genes. ... 25
Figure 22 – Nucleotide abundance across read positions. ... 25
Figure 23 – Aligned read gain by trimming the first 10 nucleotides of each read ... 26
Figure 24 – RT-qPCR of SMN expression levels. From Amaral et al.(2013)42 ... 27
Figure 25 – Overlap between the differentially expressed genes found in C24 and X7/C24 libraries .. 28
Figure 26 – Human data assessment ... 30
Figure 27 - Overlap between the genes found as DE in the H. sapiens sequencing batch. ... 31
ix
Figure 29 – Overlap between DE genes in the NSxSMAiPS DEA and two SMA studies on a M.
musculus model. ... 34
Figure 30 – H. sapiens and D. melanogaster differentially expressed genes which are also orthologs. ... 35
x
List of Tables
Table 1 – Gene expression levels of the benchmarking genes described in Flybase’s high-throughput expression database and their respective gene length for the central nervous system (CNS) and imaginal discs (ID) ... 14 Table 2 – SMN’s expression fold change between Wildtype and C24 libraries. ... 17 Table 3 – Selected terms (highest adj-p) from the GSEA (BP) for the list of genes obtained in the WTxX7/C24 gene DEA ... 23 Table 4 - Differentially expressed genes in C24 or X7/C24 flies that are classified as having neuronal, glial or ubiquitous expression in Flybase. ... 28 Table 5 - Selected terms (highest adj-p) from the GSEA (BP) for the gene list obtained in the NSxSMAiPS gene DEA ... 31 Table 6 - Selected terms (highest adj-p) from the GSEA (BP) for the gene list obtained in the shSMN2xSMAiPS gene DEA. ... 32 Table 7 – Enriched terms from the GSEA (BP) for the gene list obtained in the NSxSMAiPS gene DEA. ... 32
xi
List of Abbreviations
Adj-p – Adjusted P-value
ALS – Amyotrophic lateral sclerosis BH – Benjamini-Hochberg
BP – Biological Process
BWA – Burrows-Wheeler Aligner BWT – Burrows-Wheeler Transform cDNA – complementary DNA CNS – Central Nervous System CNV – Copy Number Variants
DEA – Differential Expression Analysis DE – Differentially Expressed
FPKM – Fragments Per Kilobase of transcript per Million mapped reads GSEA – Gene Set Enrichment Analysis
GO – Gene Ontology
iPSC – induced Pluripotent Stem Cells
KEGG - Kyoto Encyclopedia of Genes and Genomes MF – Molecular Function
NMJ – Neuromuscular Junction PCA – Principle Components Analysis QS – Quality Score
RNAi – RNA interference RNA-Seq – RNA-Sequencing SBS – Sequencing by Synthesis shRNA – short hairpin RNA SMA – Spinal Muscular Atrophy WT – Wild-type
1
1 – Introduction & Objectives
1.1 – Transcriptome profiling
Transcriptome profiling has become a major focus in biological research, showing how changes in gene expression and splicing patterns can lead to the activation of molecular pathways related to disease. Indeed, it has shed some light into the processes involved in the cause of neurodegenerative diseases, such as Alzheimer disease, Parkinson disease and amyotrophic lateral sclerosis (ALS)1,2.
RNA-Sequencing, or RNA-Seq3, is currently the most widely used technology to sequence the transcriptome. It is based on the high-throughput sequencing (also known as deep sequencing, next generation sequencing or NGS) of a cDNA library generated from steady-state RNA, producing millions of short nucleotide sequences (30-400 nucleotides in size) also known as reads. These reads, when mapped to a reference genome, can be used to quantify transcript abundances and serve as the basis for comparison between different phenotypes, providing information about gene expression, sequence variation in the transcriptome, allele specific expression levels, and exon usage, as well as allowing for the identification of novel splice junctions and promoters. Also, since RNA-Seq is not limited to the detection of transcripts corresponding to a previously known genomic sequence, it allows the assembly of transcriptomes of species for which a reference genome is not yet available.
However, like all sequencing technologies, it presents a series of challenges and disadvantages. Because the preparation of RNA-seq libraries relies on reverse transcription and PCR amplification before sequencing, several types of biases have been reported as a consequence, including random hexamer priming bias4, GC content bias5 and depletion of 3’ and 5’ ends of the transcripts, which impacts read nucleotide content and read annotation and bias the quantification of gene expression6.
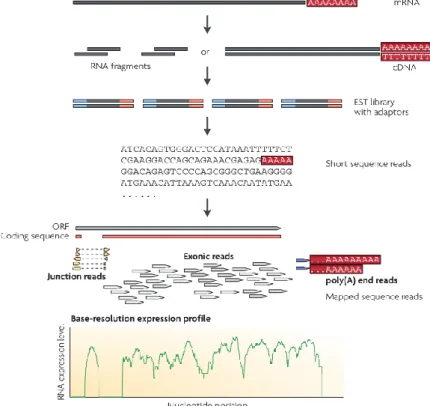
Creating an RNA-Seq library follows a protocol with several steps (Figure 1), the first one being the enrichment of mature mRNAs (which have a 3’ poly-adenylated tail, or poly-A) from the total extracted RNA or the depletion of ribosomal RNA (rRNA). The mature RNA is then randomly fragmented by hydrolysis or nebulization and reverse-transcribed into a cDNA via random hexamer or oligo-dT priming. Alternatively, fragmentation can be done after the creation of the cDNA library. RNA fragmentation results in an even read coverage over the transcript body with a decrease in coverage towards the transcript ends, whereas cDNA fragmentation results in lower read coverage over the transcript body with an increase of read coverage on the 3’ and 5’ ends. The cDNA library is then size selected for fragments suitable for sequencing by one of the various high-throughput sequencing technologies available (e.g: Illumina’s Genome Analyser/HiSeq, Applied Biosystems’ SOLiD, Roche’s 454
2
– reviewed in 7), which generates reads from one (single-end reads) or both (paired-end reads) ends of each of the selected fragments, producing up to hundreds of millions of reads.
Figure 1 – A typical RNA-Seq experiment. Image and text adapted from Wang et al.3
. “Long RNAs are
converted into a library of cDNA fragments through either RNA fragmentation or DNA fragmentation. Sequencing adaptors (blue) are subsequently added to each cDNA fragment and a short sequence is obtained from each cDNA using high-throughput sequencing technology. The resulting sequence reads are aligned with the reference genome or transcriptome, and classified as three types: exonic reads, junction reads and poly(A) end-reads. These three types are used to generate a base-resolution expression profile for each gene, as illustrated at the bottom.”
1.2 – A Bioinformatical approach to RNA-Seq data
Depending on the scientific question of interest, the analysis of RNA-seq data will need different and sometimes very complex approaches, some of which tend to be very computationally heavy, such as aligning millions of reads to a reference genome or applying statistical models to test for differential expression of thousands of genes and respective exons, in order to answer questions such as which genes are being differentially expressed, or which isoforms are being enriched. This can be solved by using a bioinformatics approach, based on specialized algorithms for finding, matching and counting patterns in files with large volumes of data as fast and accurately as possible.
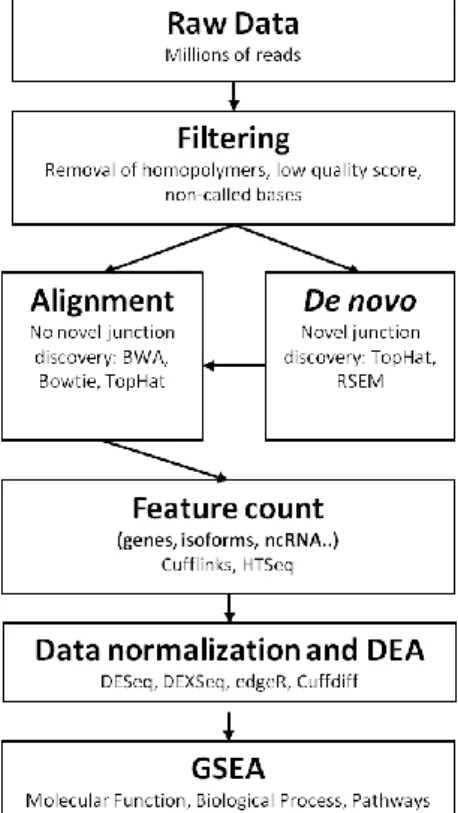
An RNA-seq data analysis requires several key steps: quality filtering of raw reads, mapping the reads to a reference genome, removing duplicate reads, quantifying genetic features, and finally comparing them between different experimental treatments (Figure 2). As mentioned before, RNA-seq data is biased by several errors introduced during either library preparation or due to the sequencing technique4,5,6,8 which need to be filtered. Starting
3
out with the raw reads produced by one of the various existing NGS technologies, the first step is to filter out uncalled nucleotides, reads with a low Quality Score (QS), and reads with long homopolymers, which can bias the quantification of gene expression. Unidentified or uncalled bases are seen in reads as nucleotides tagged as N, identifying a position where it was not possible to accurately determine which nucleotide is being featured. Quality scores, or Phred scores9, measure the probability of a base call being correct and are defined by the equation
, where e is the estimated probability of the base call being wrong, meaning the higher the QS, the more accurate the nucleotide identification is. For example, if during the filtering process the QS is locked to values between 30 and 40, the probability of each base call being correct is at least 99.9% (QS=30) and at most 99.99% (QS=40). A higher or lower degree of stringency may be applied to reads based on the quality score, depending on the biological question. Lastly, homopolymers are a long repetition of the same nucleotide, usually covering 50% or more of the total read, which not only create noise during the base calling step, but are also ambiguous when aligning to a reference genome due their lack of a distinctive pattern, despite some of them being present in the actual transcriptome (ie: not caused by sequencing errors or library preparation errors).
Figure 2 – A typical analysis pipeline for NGS data.
The second step consists of taking the filtered reads and determining their genomic coordinates by mapping them to a reference genome, using next generation aligners. There are two main types of next generation aligners: one uses algorithms based on hash tables
4
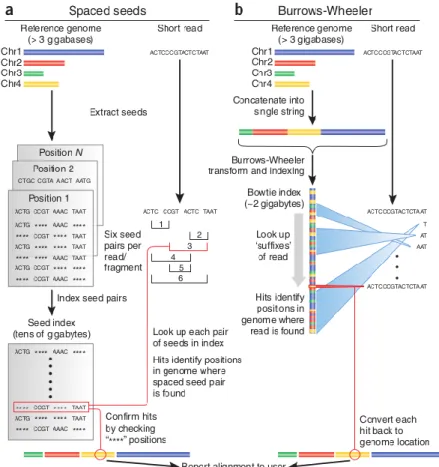
(e.g. BLAST, SOAP, MAQ) and the other uses algorithms based on suffix tries (e.g. Bowtie, BWA, SOAP2). Depending on the experimental design and/or biological question, these two algorithms have several different implementations to better suit the intended approach (reviewed in Li, 201010). Suffix tries algorithms based on the Burrows-Wheeler transform (BWT) for suffix tries are the most used algorithms for RNA-seq data mapping. In comparison with traditional algorithms11 (Figure 3a), BWT based aligners use a different data structure to store the seeds, called tries, which store all the suffixes of a sequence and compress them using an FM-index, a structure based on the BWT (Figure 3b). This results in multiple identical sequences that need to be aligned only once, increasing the alignment speed.
Figure 3 – Comparison between two different approaches for aligning short sequencing reads to a genome. Image taken from from Trapnell & Salzberg12. a) Spaced seed index approach b) Burrows-Wheeler Transform based approach.
Overall, software based on spaced seed indexing tends to be more sensitive but needs a large amount of memory and is less time efficient (30 fold slower)13. As an example, it takes 50GB+ of RAM to store a hash table of a human genome in memory, whereas software that uses algorithms based on the BWT can fit the same genome in under 2GB of memory. Having access to a server or computer grid capable of handling information on the scale needed by spaced seed software to store hash tables is restricted to most researchers and because of this, BWT based aligners are the preferred approach for a small server such
5
as the one being used in the analysis featured on this thesis. A well known example of this type of software is the Burrows Wheeler Aligner14 (BWA), a widely used aligner which provides a cost-effective alignment of long reads (up to 1 Megabase) and allows for gapped alignment and nucleotide mismatches, but not reads that span splice junctions (Figure 4).
Figure 4 – Differences between aligning reads to the genome and the transcriptome. Represented in green are reads that can only be recognized by aligners that allow for detection of splice junctions. The reads’ sequence contains part of two exons that have an intron separating them on the genome, which needs to be taken into account when aligning against the genome. The blue lines represent reads whose alignment spans only part of one exon and therefore aren’t affected by intronic sequences when aligning to the genome.
Other software has been developed to address the limitations of the previous aligners, expanding their capabilities. One such example is TopHat15, which takes RNA-Seq reads and compares them to the supplied reference genome in order to identify exon-exon splice junctions, based on the mapping provided by Bowtie13, another BWT short read aligner which does not recognize reads overlapping splice junctions. With TopHat, reads are initially mapped by Bowtie to a reference genome, creating 2 files: one with mapped reads and another with unmapped reads. The unmapped reads are collected by TopHat and used to create a seed table index which allows the software to align them by taking into consideration that they can span splice junctions. This also allows for novel transcript discovery by aligning the raw data against the genome without giving any reference about intron/exon locations.
The third step comes in as an addition to the filtering step, as some sources of bias can only be detected after the reads have been mapped to the genome. As mentioned previously, during the RNA-Seq protocol, the RNA/cDNA is randomly fragmented, greatly lowering the probability of one of the generated fragments being exactly the same as another. If the same exact fragment is observed, it most probably indicates a duplication error, also known as PCR duplication, which results from overextending the number of PCR cycles needed during the amplification step, meaning the amplification process went beyond the point of saturation, resulting in duplicated fragments, or due to a high variance in fragment size, which results in an over-representation of smaller, more quickly amplified fragments. To detect them, specialized software such as SAMTools16 and Picard17 contain a feature that searches and filters out identical reads and/or reads that align in the exact same chromosomal coordinates.
Mapping the reads to the genome provides little information about the transcript abundance, and in order to extract information from the mapped reads, scripts have been
6
developed to count the number of reads mapping to the features contained in a given reference. This means you can count all reads which, for example, align against every known gene on a specific genome, compare their expression levels between two RNA-Seq libraries with different conditions (e.g.: control library vs disease library) and perform a differential expression analysis to better understand what qualifies as a condition-specific gene/isoform/other feature expression or simple biological variation. This step uses one of the numerous differential expression analysis (DEA) packages available (edgeR18, DESeq19, DEXSeq20, Cuffdiff21, SAMSeq22, among others) to find which genes, isoforms or other features are being differentially expressed between conditions. Choosing the software will depend on the amount and type of data you have (reviewed in Soneson & Delorenzi23). Typically, these packages also contain some sort of data normalization process to reduce bias between different sized libraries and different gene lengths.
Finally, further data analysis can be performed with a gene set enrichment analysis (GSEA), which determines in which biological processes, molecular functions and pathways the DE genes/isoforms/etc are involved. With this information one can narrow down which pathways are being affected/triggered by the disease/treatment and derive some biological insight from the analysis.
1.3 – Disease models
Disease models play an important role in assessing which systems and pathways are affected by a certain disease. A commonly used model is Drosophila melanogaster, an organism that has been shown to have a great number of highly conserved genes when compared to humans24. It also has a complex nervous system, an essential characteristic for an effective study of neurodegenerative disorders at a molecular level25,26. Due to these features, human disease models can be easily generated in Drosophila through the use of small hairpin RNA (shRNA) expression vectors to target the Drosophila homologue of the disease causing gene in a tissue specific or organism wide manner, making it a very reliable and flexible approach to modelling disease. It can be used to create stable transgenic Drosophila mutant lines that can be used to address the impact of loss of function mutations on, for example, the central nervous system (CNS).
1.4 – Spinal Muscular Atrophy
Spinal Muscular Atrophy (SMA) is the second most common autosomal recessive disorder in humans, which presents itself by causing a degeneration of motor neurons33, leading to an atrophy of the muscles and subsequently, respiratory insufficiency, paralysis and death. Its cause is known to be associated to the reduction of expression of the SMN (Survival of Motor Neuron) protein, due to a loss of function by the Survival of Motor Neuron
7
1 gene – SMN1 – via deletions or, more rarely, missense mutations. This protein is known to have an important function in the assembling process of spliceosomal small nuclear ribonucleoproteins (snRNPs), but a link between its function and the degeneration of motor neurons has not yet been successfully established34. Nevertheless, it has been hypothesized that changes in pre-mRNA splicing mechanisms induced by a reduction of SMN expression affect other unknown genes, necessary for the survival of neuronal cells and neuromuscular junctions35.
In humans, there are two SMN producing genes – SMN1 and SMN2 – which differ by a single nucleotide substitution in exon 7 (position 840, C to T), and are located in chromosome 5 in the telomeric and centromeric region, respectively. Even though this substitution is translationally silent, it prompts an alternative splicing event on SMN2, which skips exon 7 and causes about 85% of the proteins produced by SMN2's transcripts to be truncated, making it unable to compensate for the lack of SMN production in the event of a loss of function by SMN1. This implies that while the disease manifests itself due to SMN1 loss of function, its severity is dependent on the number of existing SMN2 gene copies, which determine how much functional, full-length SMN protein is being expressed.
On the other hand, D. melanogaster only has one SMN gene copy (Smn - chr 3L 16573498-16574647) and knocking down its expression results in lethality at the larval stage. Therefore, in order to mimic a human SMN1 loss of function, RNA interference (RNAi) is used to target the fly’s Smn expression and reduce it to mimic SMN2 levels of expression. Previously existing studies on the cause of SMA have been based in null mutant models36,37 where the SMN gene is disabled across all tissues, incurring in larvae lethality and thus not emulating the same conditions as a mild human SMA phenotype. By using a tissue specific driver to target only SMN production on the CNS, one can create specimens that more accurately profile the changes caused by this disease38.
1.5 – Objectives
The work presented in this thesis aims to investigate how the genetic program of motor neurons is affected by the decrease of SMN expression, using RNA-Seq libraries from two disease models. The first one is an RNAi D. Melanogaster model that targets and lowers SMN expression in the central nervous system (CNS). The second model is based on iPS cell cultures differentiated from human SMA patients and healthy individuals. Furthermore it aims to assess the similarity between D. melanogaster and H. sapiens models, which should contribute with some insights regarding the usefulness of D. melanogaster’s models for the study of SMA disease.
8
2 – Materials & Methods
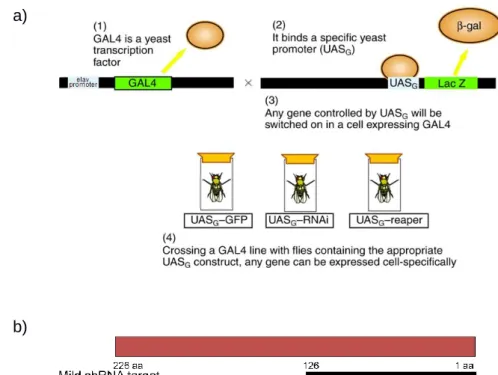
SMA D. melanogaster models, tissue preparation, RNA extraction and sequencing. Briefly, Drosophila transgenic RNAi models were developed by Dr. D. Van Vactor’s group (HMS, US) using a binary system that uses the offspring obtained from a cross of two transgenic fly lines. The first line contained the neuron-specific elav promoter upstream of the yeast GAL4 transcription factor coding sequence, while the second line had an integrated copy of the pWIZ vector with an intron-spliced hairpin transcript that produces a double stranded RNA for Smn, fused to the yeast upstream activator sequence (UAS) that is bound by GAL4 (Fig 5). Consequently, the offspring presents a neuronal-specific down-regulation of SMN, where elav was used as a tissue specific GAL4 driver39. In essence, GAL4 is only expressed where elav is active (neuronal cells) and the RNAi is only transcribed when GAL4 is present. A parallel cross using a fly line containing an integrated copy of the empty pWIZ vector was used to generate a control wild-type (WT) strain for these studies.
Figure 5 – The elav-GAL4 model. a) The elav-GAL4 construct (modifed image from Dow, Julian A T40
) b) Representation of the Smn gene area targeted by C24.
Additionally, a null allele of Smn (Df(3L)SmnX7) was used to generate a more severe knockdown of Smn levels, combining a 50% reduction of expression across all tissues with the neuronal specific Smn RNAi line (C24/X7)38. In total, four strains were used: w; P{w+mC=GAL4-elav.L}3 (Bloomington), w; P{UAS-PIWZ }15, w; P{UAS-SmnRNAi-C24}, and w; Df(3L)SmnX7, P{UAS-SmnRNAi-C24}/TM6B, Dfd-YFP to create the wild-type and mutants, via crosses (Figure 6).
a)
9
Figure 6 – Drosophila lines used in this study. Details the crosses made to obtain the studied genotypes (WT,C24 and X7/C24)
The central nervous system (CNS) of approximately 200 late third instar larvae was dissected in order to generate one biological replicate of the corresponding genotype. Dissected CNS samples were quickly frozen in TriPure Isolation Reagent (Roche Diagnostics GmbH, Mannheim, Germany) and pooled before performing total RNA extraction as described in Amaral et al. 201441. In total, six biological replicates from WT flies, seven biological replicates from C24 flies and 4 biological replicates from X7/C24 flies were generated. mRNA-libraries were generated from an average 10g of total RNA and prepared using the TruSeq RNA Sample preparation protocol (Illumina, USA). In summary, after two cycles of poly-A selection, RNA was fragmented to an average length of 300 bp and then converted into cDNA by random priming. The cDNA was then converted into a molecular library in order to generate paired-end RNA-seq libraries of 100 bp using the HiSeq2000 (Illumina, USA).
RNA-seq libraries of human iPSC-derived motor neuron cultures. Human motor neuron samples were produced by Dr Lee Rubin’s group (Harvard Medical School) from retroviral
generated iPSCs derived from type I SMA patient fibroblasts and control healthy fibroblasts as described in42. Furthermore, iPSCs derived from fibroblasts of the same healthy donor with an integrated shRNA vector targeting SMN1 were used in parallel to generate in vitro differentiated motor neurons (shSMN2). Total RNA was extracted and paired-end RNA-seq libraries were prepared as described. A total of 3 NS, 3 SMAiPS and 3 shSMN2 100bp RNA-seq libraries were RNA-sequenced using
the HiSeq2000 (Illumina, USA).
Filtering, alignment and annotation. (See Figure 7 for the workflow) Raw data was analysed with FastQC to assess and visualize library's overall quality. Reads with homopolymers longer than 50 nt (>=50% of the read), non-called bases (tagged as N) and quality scores lower than 30 (QS < 30) were discarded using an in-house Perl script. The trimming of the first 10 nucleotides from each read (Appendix IV - Protocol 1) was made
10
using an in-house script in Python. Read alignment was made using the Burrows Wheeler Aligner v.0.6.1 (BWA) aln and sampe commands, allowing for only one mismatch and a distance of 200 nucleotides between read pairs, (Appendix IV - Protocol 2). Another aligner was also used TopHat9 using two modes, one with the novel junction discovery feature on and another with novel junction discovery off. The genome assembly used for D. melanogaster was the BDGP5, and for H. sapiens was the GRCh37.71. SAMTools' “rmdup” feature16 was used to remove potential PCR duplicates (Appendix IV - Protocol 2). Finally, gene counts were made with HTSeq's “count” feature in union mode43. In order to identify
GAL4 transcripts, all reads were mapped to GAL4 gene (Gene ID 855828; accession NC_001148.4 - Saccharomyces cerevisiae S288c) using BWA14 with the same previously described alignment parameters (Appendix IV – Protocol 3).
Figure 7 – Worfklow used for the analysis of the RNA-Seq libraries in both humans and flies.
Differential expression analysis and pathway enrichment. Data normalization was made using a size factor approach and tested for differential expression analysis by using bioconductor’s DESeq44 package, which encodes an algorithm based on the binomial negative model. DESeq was also used to for the biological assessment of libraries by correlating gene expression and variance values between libraries. Cuffdiff21 was also used to test for differential expression of gene counts derived from the TopHat alignment. Out of the various available differential expression analysis softwares, DESeq uses one of the most statistically conservative methods and thus is less prone to find false positive results when performing differential expression tests23. Isoform DEA was made with DEXSeq20, DESeq's equivalent for studying isoform expression. Clustering analysis was performed using the heatmap function from the ggplot package (default parameters) and correlation plots were generated using the lattice package in R environment45. Gene set enrichment analysis was
11
performed using “GOstats”46, a bioconductor R package, in conjunction with other bioconductor packages, including “org.Dm.eg.db”47, ”org.Hs.eg.db”48, “KEGG.db”49, “GO.db”50, “biomaRt”51 and “multtest”52.
Co-expression of ortholog genes between different models. Using BioMart53 and the
HGNC54 database, a list of human/fly ortholog genes holding a HUGO ID was obtained. From this list, all genes that were previously identified as DE on both species were selected and used to generate a list of ortholog DE genes present in both species (Figure 8). Finally, a gene set enrichment analysis was performed using the GOstats R package46 in order to understand which GO terms were being enriched by the DE ortholog genes. Note that only genes which were equally up-regulated or down-regulated in both species were used for the GSEA.
Figure 8 – Pipeline for the analysis of co-expression of a) D. melanogaster and H. sapiens ortholog genes and b) M. musculus and H. sapiens ortholog genes
GC content assessment between introns and exons. GC content for each library was quantified using an in-house python script which counts and separates reads according to the percentage of GC content. All read counts were normalized according to library size and the ratio between the GC content in aligned introns/genes across conditions was calculated.
12
3 – Results & Discussion
3.1 – D. melanogaster model
To study the effects of SMN’s down-regulation on Drosophila’s CNS we analysed three distinct phenotypes. This analysis had the aim of uncovering which genes, exons and related pathways are affected by this down-regulation in this model and how it related to other studies using different Drosophila models, as well as its similarity with human SMA patients and it followed the pipeline described in methods, which includes data quality filtering of the generated datasets, alignment to a reference genome, differential expression analysis of genes and exons, and finally gene set enrichment analyses.
3.1.1 – Quality assessment of mRNA-seq libraries derived from the CNS of fly larvae The datasets used in this study originated from three successive rounds of sequencing. The first sequencing batch is comprised of four biological replicates of CNS samples from a mild Smn knock-down mutant (C24) and three replicates of wild-type CNS (WT). The second batch contains three C24 and three WT replicates and the third batch has four biological replicates of the severe Smn knock-down mutant (X7/C24).
In the first batch/pilot run, we obtained an average of 100 million raw reads per library
(Appendix I – D. melanogaster), 80% of which passed the initial quality filtering process. On average, 90% of the filtered reads were aligned to the genome using BWA, and ~75% of them were counted as part of a protein coding gene. After filtering, nearly 90% of the transcriptome was covered, with a sequencing depth of 500X and with an average of 11400 protein coding genes expressed, out of a total of 13872. In addition to the alignments made with BWA, we also used TopHat in this study, as it is one of the most widely used and well regarded softwares for alignment. Results show however, that in comparison with BWA and, despite TopHat having mapped an additional 5% of quality approved reads, the proportion of pairs that were accurately mapped was 20% less. Since TopHat has a lower coverage, this lead to the decision of using BWA as the preferred aligner to produce results for the downstream analysis.
We also observed that the percentage of read duplicates in C24 3 and WT 3 were much higher in comparison to the other replicates, indicating a problem in the library generation step, probably due to PCR saturation. As previously mentioned, PCR duplication is an issue that can lead to a skewed downstream analysis, since it introduces bias in gene expression by changing their expression levels due to the high number of read duplicates, which are being mapped as regular reads and counted as part of the gene expression levels.
13
phenotype, we performed a hierarchical clustering analysis and a correlation analysis, based on the whole-genome expression profiles. Results show that samples did not cluster according to phenotype (Figure 9), nor did the correlation values show consistency between libraries. For example, the WT1 dataset shows a higher correlation to the C24 libraries than to the WT 2 library. Given the technical complexity involved in isolating larvae CNS samples for RNA-seq profiling, we hypothesized that the presence of non-CNS tissue might be the major cause of the observed discrepancies, and that the Imaginal Discs (ID) could represent the largest source of contamination due to their proximity to the CNS at the studied larval stage.
Figure 9 – Clustering and correlation analysis of the first sequencing batch. C24 1 to 4 represent the datasets generated for the mild Smn knockdown mutant, while WT 1 to 3 represent the control. a) Clustering between all samples from the first sequencing batch based on stabilized variance. The plot shows that the datasets are clearly not clustering according to phenotype; b) Correlation plot between all samples from the first sequencing batch, based on gene expression values normalized by DESeq (the higher the value, the higher the correlation is between libraries).
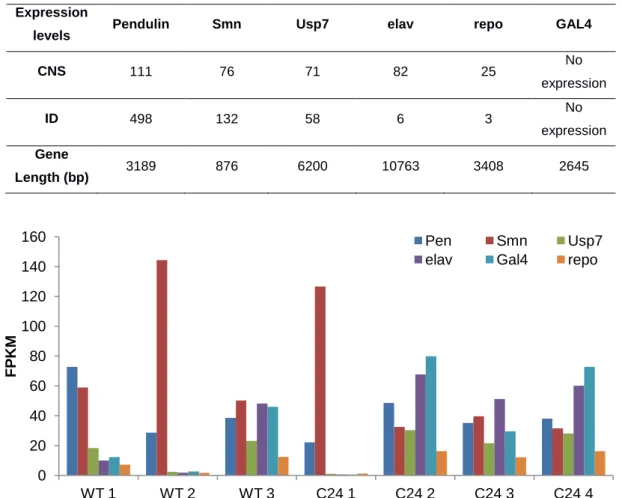
We further hypothesized that by selecting a set of key marker genes it could possible to identify mRNA-seq libraries that were displaying levels of gene expression closest to the expected for CNS derived samples. Using FlyBase's high-throughput expression data55, we selected five genes: two tissue specific genes (elav, repo) and three ubiquitous genes (Pen, Usp7 and the RNAi target gene, Smn). elav has a neuronal specific expression while repo is reported has having a CNS glial cell specific expression. Although ubiquitous, Pen has a higher expression in the imaginal discs than on the CNS and Usp7 is evenly expressed across most tissues. Additionally, the transgene driver GAL4 was also selected to be included in this profile. GAL4’s expression is regulated by the presence of elav and is not present on wild type D. melanogaster (Table 2). Smn, elav, repo, Pen and Usp7 expression
14
levels were obtained for all libraries by quantifying the paired-end reads aligned to the Drosophila genome with HTSeq and then normalized for gene length. GAL4 expression levels were quantified by aligning the RNA-Seq libraries to a “one-gene genome” created from the GAL4 gene fasta sequence and counting the uniquely aligned reads. A comparison of the expression levels of these six genes across all libraries from the first sequencing batch (Figure 10) confirmed the hypothesis that several libraries display a non-neuronal expression pattern (namely WT 1 and 2 and C24 1), giving a basis for excluding these from the dataset, as well as defining criteria for control of biological origin for further sequencing rounds.
Table 1 – Gene expression levels of the benchmarking genes described in Flybase’s high-throughput expression database and their respective gene length for the central nervous system (CNS) and imaginal discs (ID). Note that GAL4 is a yeast gene introduced for the purpose of the experiment and does not have any kind of gene expression in a regular fly. The values represent the modENCODE’s expression level measure: very low expression (1-3), low (4-10), moderate (11-25), moderately high (26-50), high (51-100), very high (101-1000) and extremely high expression (>1000)
Expression
levels Pendulin Smn Usp7 elav repo GAL4
CNS 111 76 71 82 25 No expression ID 498 132 58 6 3 No expression Gene Length (bp) 3189 876 6200 10763 3408 2645
Figure 10 – Benchmarking genes’ expression values for the first sequencing batch libraries, normalized for library size and gene length. WT 3 and C24 2-4 gene expression values correspond to neuronal tissue expression. All other samples (WT 1, WT 2, and C24 1) display almost no elav expression (neuron specific gene). WT 2 and C24 1 also display very high levels of SMN, expected from tissue derived from imaginal discs.
We also observed that GAL4 expression levels did not follow elav's expression levels in samples C24 3 and WT 3, the two libraries that had been previously observed as having a
0 20 40 60 80 100 120 140 160 WT 1 WT 2 WT 3 C24 1 C24 2 C24 3 C24 4 F P KM Pen Smn Usp7
15
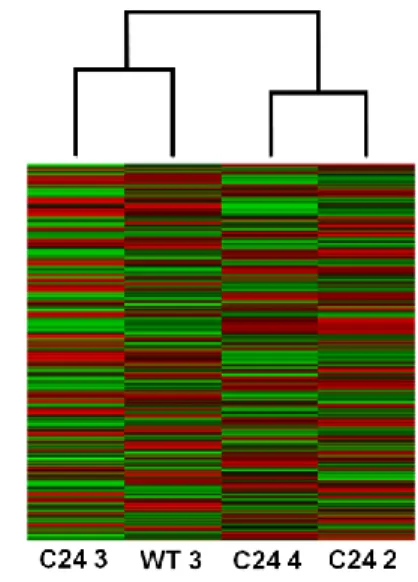
higher amount of PCR duplicates. In fact, when performing the clustering analysis with the samples that passed the tissue specific analysis, these two samples did not cluster as expected, showing a clear separation between libraries according to the amount of duplicates (Figure 11). These results supported the final decision that the pilot sequencing round did not provide data with sufficient quality for performing a differential expression analysis and that therefore a new sequencing round would have to be performed.
Figure 11 – Clustering analysis of the four libraries that passed the benchmarking gene assessment. Samples are being clustered according to the amount of PCR duplicates present on each dataset rather than by phenotype (~60% in C24 3 and WT 3, ~40% in C24 4 and C24 2).
3.1.2 – Characterization of the transcriptome of the CNS of neuronal Smn knockdown Drosophila lines modelling a mild SMA phenotype
A second batch of data was produced containing three new replicates of CNS samples from wild type and C24 larvae. In this batch, an average of 101,7 million raw reads were obtained per library (Appendix I – D. melanogaster), 84,5% of which passed the initial quality filtering process. On average, 91,4% of the filtered reads were aligned to the genome using BWA, and ~76,7% of them were counted as part of a protein coding gene. After filtering, nearly 90% of the transcriptome was covered, with a sequencing depth of 500X and with an average of 11824 protein coding genes expressed, out of a total of 13872. PCR duplication accounted for an average of 28% of the uniquely aligned reads, much less than the duplication rates found on the first sequencing batch.
The gene panel described in the previous section, used to evaluate library quality regarding their tissue of origin was also used to assess this sequencing batch. In this batch, all samples present the same kind of expression pattern previously found to be indicative of neuronal tissue, suggesting that these samples presented a much smaller degree of contamination from neighbouring tissues (Figure 12). However, the clustering analysis failed once more to classify these libraries according to their origin, with C24 6 and WT 5 being
16
clustered separately from the other libraries (Figure 13).
Figure 12 – Expression values of the benchmarking genes from the second sequencing batch and the first sequencing batch samples that passed the test.
Figure 13 – Clustering analysis of the second sequencing batch. As seen, C24 6 and WT 5 are not clustering according to phenotype.
Following these observations, we decided to investigate if these samples were being affected by a slightly higher presence of other non-neuronal tissues when compared to the other libraries. As before, using the public repository of RNA-seq data in Flybase, we quantified the gene expression levels which are exclusive to the neuronal system, as well as genes that display a high expression in other tissues (imaginal discs, carcass, fat body, salivary glands and digestive system) but have low to no expression in the neuronal system. Results (see Appendix II) showed that WT 5 has higher expression levels on genes present in the imaginal discs, digestive system, carcass and salivary glands but not on the CNS. C24 6 on the other hand, had lower expression levels for CNS specific genes though it
0 20 40 60 80 100 120 140 WT 4 WT 5 WT 6 C24 2 C24 4 C24 5 C24 6 C24 7 F P KM Pen Smn Usp7
17
maintained the same expression levels as the other samples on the non-CNS tissues. These altered levels of gene expression however, were not considered to be enough to skew the downstream analysis since both libraries passed the assessment for neuronal specific gene expression with almost the exact same expression pattern of the other replicates, suggesting both libraries should not be discarded. After the tissue-specific gene assessment, we performed a principal component analysis (PCA) with all the approved libraries from both sequencing batches (Figure 14). Again, results showed C24 6 and WT 5 as possible outliers, though a clear separation between WT and C24 can be observed.
Figure 14 – Transcriptome profiling of the second sequencing batch. a) Principle Components Analysis (PCA) plot and b) Hierarchical clustering of the second sequencing batch libraries and the viable C24 replicates from the first sequencing batch.
Considering the apparent differences between the libraries from the second sequencing batch, we decided to perform two DE analysis, one using all six libraries (3x3 analysis), and another using only the two replicates for each condition that displayed good results in both the clustering analysis and the tissue-specificity assessment (2x2 analysis). Results show a relatively small number of significantly DE genes (adj-p > 0,05) in both approaches: 78 genes in the 3x3 analysis, 209 in the 2x2 analysis, 61 of which are common. Unexpectedly, neither analysis identified the shRNA target, SMN, as differentially expressed showing only a slight change in gene expression levels (Table 2).
Table 2 – SMN’s expression fold change between WT and C24 libraries. Using three replicates for each condition (3x3) and removing the two replicates that did not clustering according to phenotype (2x2).
Approach SMN fold change (log2) Significant? (adj-p < 0,05)
3x3 -0,13 no
2x2 -0,19 no
Two possible reasons might explain this outcome. The first one is that SMN’s expression
levels in the C24 libraries were overestimated due to a bias caused by the assignment of
18
shRNA derived reads to the SMN gene. As previously explained, the shRNA knockdown of SMN is mediated by the expression of an antisense transcript corresponding to approximately half of the endogenous transcript (see Figure 5b). Therefore, we decided to investigate if a bias in the SMN read coverage towards the region complementary to the shRNA was observed. For this purpose, we used the results from the second sequencing batch to plot the distribution of all reads aligned to Smn across its chromosomal location in order to see if there was a significant difference in read distribution between the area targeted by the shRNA, C24, and the area that is not targeted by C24. If true, we also hypothesized that it would be possible to observe a difference in gene expression between WT and C24 in the area not targeted by the shRNA. Results indicate this is not the case
(Figure 15a), suggesting that shRNA expression did not interfere with the target gene's quantification. This quantification of SMN’s read coverage revealed that it is higher in the transcript body and decreasing towards the ends. This is what is expected in RNA-seq libraries generated from RNA fragmentation, as described in the methods section (Figure 15b). We therefore concluded that the shRNA used in this study was not biasing the estimation of SMN expression levels.
a)
19
Figure 15 – SMN read distribution. a) Distribution of the reads aligned to the SMN gene in the second sequencing batch by their chromosomal location. The grey area indicates C24’s target and the black arrow indicates Smn’s start site; b) Taken from Wang et al.3
- Read distribution along a gene according to the type of fragmentation used in the library preparation.
The second possibility was based on a lack of a significant reduction of SMN expression in C24 libraries, probably due to the shRNA not having an impact on SMN expression as great as expected. To test this, we perfoemed a blind DE analysis by doing a DEA to random combinations of the data set: three 2x2 and three 3x3. Results show an average of 20 DE genes in the 3x3 analysis and an average of 14 DE genes in the 2x2 analysis with none of them overlapping either WTxC24 gene DEAs. These results suggested thatthe DE genes found on the WTxC24 DEAs are not a result of random biological variation across all samples but of the SMN-dependent variation found between the two conditions (WT and C24).
Having dismissed both possibilities, we put forth a third hypothesis based on the fact that the central nervous system is a complex tissue comprised of several cell-types, including glial cells. These cells do not express elav, which is necessary to activate the expression of the shRNA that targets Smn and down-regulates its expression levels. Since the C24 shRNA model has been shown to work in studies where its expression is ubiquitous38, the presence of the glial cells in these libraries coupled with the tissue specific driver implemented in this fly model could explain why SMN levels are not being significantly affected, as the SMN expression stemming from the glial cells is not being targeted by the shRNA, masking the down-regulation caused on neuronal cells. At this point however, it was not possible for us to determine if the presence of glial cells had a significant impact in the expression of SMN without a phenotype where Smn is ubiquitously down-regulated.
3.1.3 - Characterization of the CNS transcriptome of Drosophila lines with neuronal Smn knockdown on a heterozygous null background
Since the previous results lead us to the hypothesis that the effect of the shRNA on SMN expression levels proves to be difficult to detect in a complex tissue such as the CNS, the creation of new libraries derived from a more severe SMA D. melanogaster model would be required to further understand the effects of SMN down-regulation on the CNS transcriptome. To that effect, a third sequencing batch was produced, including four replicates of the severe SMA Drosophila model (X7/C24). This model presents a null mutation of the Smn gene (X7) in heterozygosity, over which the neuronal specific C24 shRNA was introduced.
In this third batch we obtained an average of 100,7 million raw reads per library
(Appendix I – D. melanogaster), 86% of which passed the initial quality filtering process. On average, 92,2% of the filtered reads were aligned to the genome using BWA, and 75,5% of
20
them were counted as part of a protein coding gene. After filtering, nearly 90% of the transcriptome was covered, with a sequencing depth of 500X and with an average of 11771 protein coding genes expressed, out of a total of 13872. PCR duplication accounted for an average of 30% of the uniquely aligned reads (similar to what we found in the second sequencing batch) except for the fourth replicate (named X7/C24 D), which was flagged for having a much higher percentage of duplicates (~50% of the mapped reads flagged as duplicates). We believe this may have been caused by a lower cDNA input used for X7/C24 D which lead us to remove this library from the downstream analysis, followed by an excessive number of PCR cycles which saturated the sample, producing an mRNA-seq library with low transcript complexity (see Appendix I – D. melanogaster). All the other samples passed the hierarchical clustering assessment and showed a clear separation between conditions when compared with the WT libraries from the second batch (Figure 16). Furthermore, the tissue specific analysis showed that all four samples displayed a gene expression pattern corresponding to CNS tissue (Figure 17).
Figure 16 – Transcriptome profiling of the X7/C24 dataset (third sequencing batch). a) Hierarchical clustering between X7/C24 and WT (2nd batch); as seen, X7/C24 D is clearly not clustering according to phenotype. b) PCA plot comparing the WT libraries from the second batch and the X7/C24 libraries that passed the quality filtering step. A clear separation between both phenotypes can be observed.
21
Figure 17 - Expression values of the benchmarking genes from the second sequencing batch and third sequencing batch samples, normalized for gene length and library size. All X7/C24 datasets present a neuronal tissue gene expression.
As seen below (Figure 18), we also observed unusual increase of GC content in mRNA-seq libraries derived from the severe SMA Drosophila model in reads containing between 19 and 40% GC content. Since introns have been shown to have a lower GC content than exons56, we hypothesized the origin of this peak could be related with an increased intron retention caused by Smn’s down-regulation due to its function on snRNP assembly. Alternatively, it could be related with a contamination by another species, such as bacteria, which are known to have widely varied levels of GC content57. To test this, we analysed the alignment percentage in the 19-40% GC content area in all three conditions (WT, C24 and X7/C24) using the datasets from the second and third sequencing batch, and we searched for reads from this interval that aligned to all known Drosophila introns in order to assess the ratio between introns and reads mapped to genes.
Figure 18 – Read GC content distribution for a) WT and b) X7/C24. The blue line represents the theoretical distribution curve, whereas the red line represents the actual GC count content found on the libraries.
Focusing on the abnormal peak formed in the X7/C24 libraries, the mean read distribution between 19 and 40% total GC content was as follows: 95% of the reads on the interval were aligned to the genome in both WT and X7C24, and 68,8% of those had a gene
0 20 40 60 80 100 120 140 160 WT 4 WT 5 WT 6 C24X7 A C24X7 B C24X7 C C24X7 D F P KM Pen Smn Usp7
elav Gal4 repo
22
feature in the X7/C24 dataset, versus 69,8% in the WT. These results dismiss the possibility of contamination from other species, as the remainder 5% of non-aligned reads would not cover for the observed read increase.
To assess for retained introns, we searched within the reads with 19-40% GC contents for reads that overlap with known Drosophila introns. Results showed that the ratio between reads that featured introns and reads that featured protein coding genes was constant between conditions and GC content percentage (Figure 19) leading us to the conclusion that the extra peak in the 19-40% GC content area was not caused by an increase of intron retention, as no significant changes were being observed across conditions.
Some studies suggest the differences in GC content distribution are related to library preparation, especially due to PCR duplication58. Considering PCR duplication accounts for an average of 30% of the datasets studied here, we believe that the origin of the peak may be related to library preparation. As mentioned before, results also showed that this peak did not seem to be affecting the alignment results, suggesting the downstream analysis would not be impaired.
Figure 19 – Intron feature/protein coding feature ratio for the second and third sequencing batch libraries on reads with 19-40% of GC content.
In order to identify differences in gene expression values in the X7/C24 libraries, we compared them to the WT libraries of the second sequencing batch via a DEA with DESeq. Results show a list of 2844 DE genes (adj-p < 0,05), including the hallmark gene Smn (log2 fold change: -1,15) as expected. To assess which pathways were being affected by the gene expression changes found, we performed a GSEA for the X7/C24 DE gene list. Results show 393 significantly enriched biological process (BP) pathways (adj-p < 0,05) with an emphasis on pathways related to neuronal processes, splicing, RNA processing and protein assembly (Table 3), all of which are results that are in agreement with the functions attributed to Smn