3(1), 68-76, 2014
Family-owned and non family-owned SMEs: empirical evidence of survival
determinants
Paulo Maçãs Nunes*1 • Zélia Serrasqueiro1 • Jacinto Vidigal da Silva2 1
Management and Economics Department, University of Beira Interior and CEFAGE Research Center, Évora University, Portugal
2
Management Department, Évora University and CEFAGE Research Center, Évora University, Portugal
Received: 29 January 2014 Revised: 28 April 2014 Accepted: 20 May 2014
Abstract
Using probit regressions and on the basis of two research samples: 1589 family-owned SMEs and 485 non family-owned SMEs, this paper analyzes if there are significant differences between family-owned SMEs and non family-owned SMEs for determinants of survival. The empirical evidence obtained shows the existence of significant differences between these two types of firms for the determinants of survival. In the context of family-owned SMEs, the empirical evidence obtained allows us to conclude that: size, age and R&D expenditure are neither positive nor restrictive determinants of survival; cash flow and labour productivity are positive determinants of survival; and, debt, interest paid and risk are restrictive determinants of survival. In the case of non family-owned SMEs, size, age, cash flow, debt and R&D expenditure are positive determinants of survival, with interest paid, risk and labour productivity being neither positive nor restrictive determinants of survival.
Keywords: family-owned SMEs, non family-owned SMEs, panel data, probit regressions, survival
JEL Classification Codes: C23, G32, L21, L26
1. Introduction
SMEs are, particularly, important in European economies for stimulating employment and economic growth (IAPMEI, 2008). In general, family-owned firms have special importance in European countries, because these firms represent an important share of the total number of firms, and, are, consequently, of great importance for increased employment and economic growth in these countries as a whole (Nordqvist, 2012).
Various studies (Agarwal and Audretsch, 2001; Cabral and Mata, 2003; Esteve-Pérez and Mañez-Castillejo, 2008; Siriopoulos and Lalountas, 2008; Holmes et al., 2010; Vaona, 2010;
* Corresponding author. E-mail: macas@ubi.pt.
Citation: Maçãs Nunes, P., Z. Serrasqueiro and J. Vidigal da Silva (2014) Family-owned and non family-owned SMEs: empirical evidence of survival determinants, Economics and Business Letters, 3(1), 68-76.
Giovannetti et al., 2011; Maçãs Nunes and Serrasqueiro, 2012) have analyzed the factors influencing firm survival. However, the specific approach focusing on the determinants factors of the survival of family-owned firms, in general, and family-owned SMEs, in particular, has been neglected in the literature.
Considering the importance of family-owned SMEs, in developed countries, this paper intends to contribute to fill the knowledge gap, in empirical studies that have specifically analyzed the survival determinants of these firms. Additionally, the survival determinants of family-owned SMEs will be compared with those of non family-owned SMEs.
Seeking to reach that objective, we select two samples of SMEs: 1) 1589 family-owned SMEs; and 2) 485 non family-owned SMEs. We use probit regressions as the estimation method. The dependent variable is a dummy variable with the value of 1 if firms are present in the market, and the value of 0 if they have leaved the market. As independent variables, we use various survival determinants used in the literature1: 1) size; 2) age; 3) cash flow; 4) debt; 5) interest paid; 6) R&D expenditure; 7) risk; and 8) labour productivity.
This paper contributes to the literature by showing that the survival determinants of family-owned SMEs are considerably different from those of non family-family-owned SMEs. The survival of family-owned SMEs is increased particularly by cash flow and labour productivity, and, it is, especially, restricted by debt, interest paid and risk. The survival of non family-owned SMEs is increased by size, age, debt, R&D expenditure and cash flow. However, cash flow has less importance for the survival of non family-owned SMEs than for that of family-owned SMEs.
After this introduction, the paper is structured as follows: 1) section 2 presents the methodology used, namely the database, variables and estimation method; 2) section 3 presents the results; and finally 3) section 4 presents the conclusions and implications.
2. Methodology
2.1. Database
This study uses the SABI (Analysis System of Iberian Balance Sheets) database from Bureau van Dijks for the period 2000-2009.
As our subject of analysis is SMEs, we select firms based on the European Union recommendation L124/36, (2003/361/CE). According to this recommendation, a firm is considered an SME when it meets two of the following three criteria: 1) fewer than 250 employees; 2) annual total assets under 43 million Euros; and 3) business turnover under 50 million Euros.
Given that our objective is to analyze the determinants of SME survival, we consider SMEs surviving in the market during the period of analysis (2000-2009) and SMEs leaving the market during that period (2000-2009). Additionally, we also consider SMEs that enter the market during the period (2000-2009).
As stated by López-Gracia & Sánchez-Andújar (2007), there is no consensus about the criteria for defining a family firm. Various criteria are used: 1) based on the people who effectively manage firms or who have effective decision-making authority (Filbeck & Lee, 2000); 2) based on the people who own the firm capital (Donckels & Lambrecht, 1999; Littunen & Hyrsky, 2000); and 3) based on the possibility of transferring business ownership to next generation (McConaughy & Phillips, 1999).
For the selection of family firms, we are limited by the information available on the database used (SABI). To classify firms, we follow the criterion of López-Gracia &
1 As, for example, in: Cabral & Mata (2003), Holmes et al. (2010), Giovannetti et al. (2011), Maçãs Nunes &
Andújar (2007), based on the ownership firm. We consider as family-owned firms the firms with a shareholder who may be an individual or family, owning more than 50% of the total shares, and the remaining shares being relatively diluted. Consequently, the reamining firms of the research sample are considered as non family-owned firms. The adoption of that criterion, while used in the literature, has the disadvantage of not considering important criteria in classifying family-owned and non family-owned firms, such as those associated with firm management and succession. According to Chua et al. (1999), the characteristics related to firm management, ownership control and intended succession should, simultaneously, be considered to define family firms. For these authors, when only adopting the criterion of ownership control, firms must be classified as family-owned firms and non family-owned firms instead of family firms and non-family firms. Use of this criterion implies a limitation for the current paper, given that the results are suitable for family-owned firms and non family-owned firms, but they cannot be generalized to family firms and non-family firms.
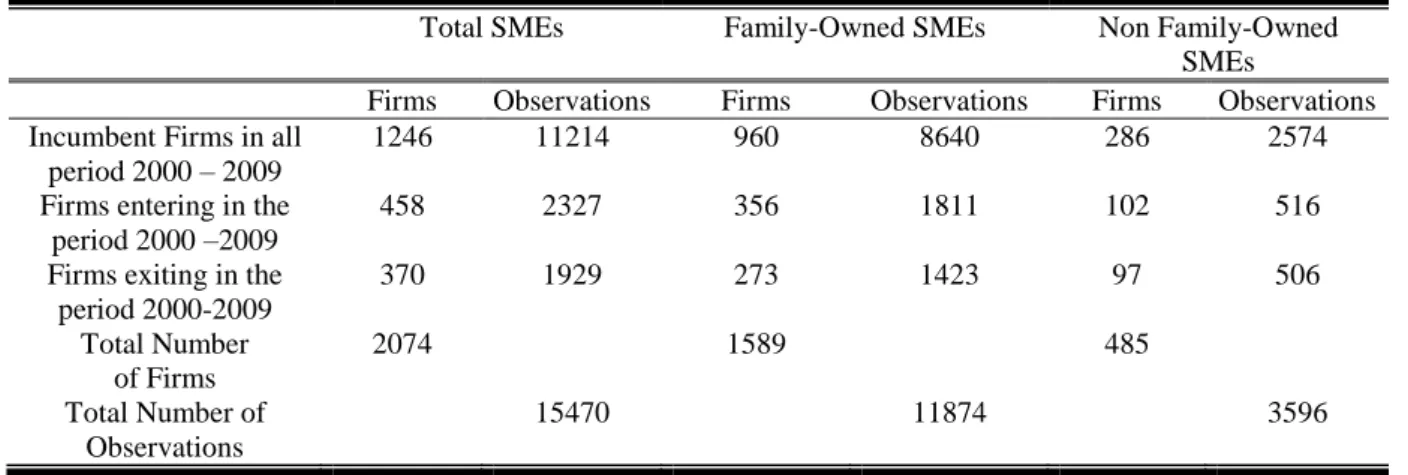
After applying the criteria described above, the following samples of family-owned and non family-owned SMEs were selected: 1) 1589 family-owned SMEs, corresponding to 11874 observations; and 2) 485 non family-owned SMEs, corresponding to 3596 observations.
The final sample composition is presented in the following table.
Table 1: Sample structure
Total SMEs Family-Owned SMEs Non Family-Owned
SMEs
Firms Observations Firms Observations Firms Observations Incumbent Firms in all
period 2000 – 2009
1246 11214 960 8640 286 2574
Firms entering in the period 2000 –2009
458 2327 356 1811 102 516
Firms exiting in the period 2000-2009 370 1929 273 1423 97 506 Total Number of Firms 2074 1589 485 Total Number of Observations 15470 11874 3596 2.2. Variables
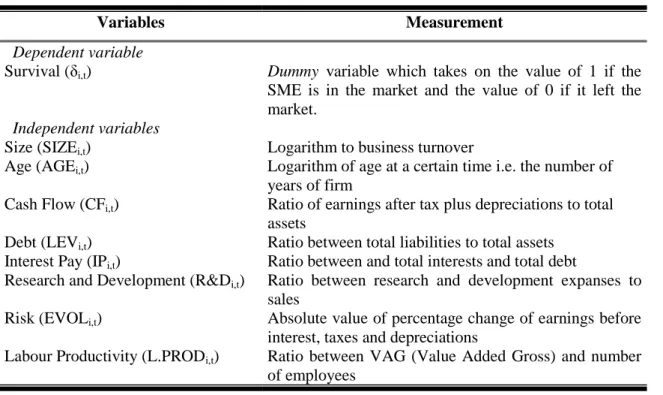
As dependent variable, we consider a dummy variable with the value of 1 if SMEs are in the market, and the value of 0 if they have leaved the market. As independent variables, we use variables measuring firm characteristics, namely size, age, cash flow, debt, interest paid, expenditure on research and development, risk and labour productivity. The following table presents the variables used, together with their corresponding measures2.
2 Monetary variables are deflated according to inflation in Portugal. We construct a price index from 2000 to
Table 2: Variables and Measurement
Variables Measurement
Dependent variable
Survival (δi,t) Dummy variable which takes on the value of 1 if the
SME is in the market and the value of 0 if it left the market.
Independent variables
Size (SIZEi,t) Logarithm to business turnover
Age (AGEi,t) Logarithm of age at a certain time i.e. the number of
years of firm
Cash Flow (CFi,t) Ratio of earnings after tax plus depreciations to total
assets
Debt (LEVi,t) Ratio between total liabilities to total assets
Interest Pay (IPi,t) Ratio between and total interests and total debt
Research and Development (R&Di,t) Ratio between research and development expanses to
sales
Risk (EVOLi,t) Absolute value of percentage change of earnings before
interest, taxes and depreciations
Labour Productivity (L.PRODi,t) Ratio between VAG (Value Added Gross) and number
of employees
2.3. Estimation Methods
We use probit regressions to estimate the relationships between the determinants and survival of family-owned SMEs and non family-owned SMEs. The regressions to estimate can be presented as follows: t i t S t i t i t i t i t i t i t i t i t i z d S PROD L EVOL D R IP LEV CF AGE SIZE , , 8 , 7 , 6 , 5 , 4 , 3 , 2 , 1 0 , . & ) Pr( (1)
where: Ss are sector dummy variables3; dt are annual dummy variables; and zi,t is the error. Seeking to test the possible differences between owned SMEs and non family-owned SMEs for the determinants of survival, we use a methodology similar to that of Watson & Westin (1975) and Patuelli et al. (2010). Initially, we estimate a probit regression with all family-owned SMEs and non family-owned SMEs and all independent variables, this being the unrestricted model. Then, we estimate a probit regression with all family-owned and non owned SMEs, with two dummy variables with the values of 1 and 0 for family-owned SMEs and non family-family-owned SMEs, which are multiplied by the independent variables, this being the restricted model. The null hypothesis to test is: H0: ßiFOW= ßiNFOW=ßi.
Aiming to compare the two models, just as Watson & Westin (1975) and Patuelli et al. (2010), we use the likelihood ratio. This statistic can be presented as follows:
λ =2(Logum-Logrm) (2)
where Logum is the log of the likelihood of the unrestricted model and Logrm is the log of the likelihood of the restricted model. The value of λ is asymptotically distributed as a χ2
with a number of degrees of freedom equal to the number of restrictions.
3 Just as Blanco-Mazagatos et al. (2007), we consider the following sector dummy variables: 1) agriculture; 2)
3. Results
This section presents the descriptive statistics and correlation matrices of the variables used in the study. Then, we go on to present the results of the relationships between determinants and survival in family-owned SMEs and non family-owned SMEs as well as the results of the test of possible differences between family-owned SMEs and non family-owned SMEs for the determinants of survival.
3.1. Descriptive statistics and correlation matrices
The following table presents the descriptive statistics of the variables used in this study.
Table 3: Descriptive statistics
Family-Owned SMEs Non Family-Owned SMEs Mean
Difference Variables Firms Obs Mean St. Desv. Firms Obss Mean St. Desv.
SIZEi,t 1589 11874 14.9718 1.4718 485 3596 15.1424 1.6177 -6.02** AGEi,t 1589 11874 2.34451 0.2509 485 3596 2.58912 0.2802 -51.90** CFi,t 1589 11874 0.06718 0.1575 485 3596 0.06082 0.1514 2.50* LEVi,t 1589 11874 0.68828 0.2019 485 3596 0.72001 0.2190 -8.63** IPi,t 1589 11874 0.04391 0.0571 485 3596 0.05844 0.0681 -12.77** R&Di,t 1589 11874 0.00901 0.0331 485 3596 0.01138 0.0398 -3.57** EVOLi,t 1589 11874 1.60934 5.1829 485 3596 1.84658 5.7264 -2.11* L.PRODi,t 1589 11874 19.8312 62.789 485 3596 18.4309 60.9812 0.40
Note: Note: We use t statistical test to test the mean difference.
Based on the t-test of the differences between the means of family-owned SMEs and non family-owned SMEs, we can conclude that, on average, family-owned SMEs have greater levels of cash flow and labour productivity than do non family-owned SMEs. On average, non family-owned SMEs are larger, older, and have higher levels of debt, interest paid and R&D expenditure than do family-owned SMEs.
Tables 4 and 5 below, present the correlation matrices for family-owned SMEs and non family-owned SMEs, respectively.
According to Gujarati & Porter (2010), when the correlation coefficients between independent variables are above 50%, the problem of collinearity becomes significant. Observing the correlation coefficients between the independent variables used, for both family-owned and non family-owned SMEs, in no circumstances the correlation coefficients are above 50%. Therefore, we can conclude that the problem of collinearity between explanatory variables will not be particularly relevant in this study.
Table 4: Correlation matrix – family-owned SMEs
SIZEi,t AGEi,t CFi,t LEVi,t IPi,t R&Di,t EVOLi,t L.PRODi,t
SIZEi,t 1 AGEi,t 0.1520** 1 CFi,t 0.0891** -0.0716** 1 LEVi,t 0.0209* -0.0894** -0.3471** 1 IPi,t 0.0082 0.0265** -0.2123** 0.1686** 1 R&Di,t 0.0378** 0.0677** 0.0781** 0.0122 0.0098 1 EVOLi,t -0.1019** -0.0102 -0.0106 0.0588** 0.0976** 0.0051 1 L.PRODi,t 0.0105 0.1288** 0.2516** 0.0671** -0.0056 0.1150** -0.0233* 1
Notes: 1. ** Statistical significant at 1% level; * Statistical Significant at 5% level.
Table 5: Correlation matrix – non family-owned SMEs
SIZEi,t AGEi,t CFi,t LEVi,t IPi,t R&Di,t EVOLi,t L.PRODi,t
SIZEi,t 1 AGEi,t 0.1671** 1 CFi,t 0.1192** -0.1299** 1 LEVi,t 0.0544** 0.2785** -0.3871** 1 IPi,t 0.2144** -0.1133** -0.2776** 0.1112** 1 R&Di,t 0.0212 0.2482** 0.1561** -0.0120 0.0790** 1 EVOLi,t -0.0089 -0.0076 -0.0717** 0.0302 -0.0085 0.0071 1 L.PRODi,t 0.0819** 0.0311 0.2091** -0.0108 -0.0897** 0.0862** -0.1301** 1
Notes: 1. ** Statistical significant at 1% level.
3.2. Survival determinants
We test the differences between family-owned and non family-owned SMEs for the relationships between determinants and survival, comparing the restricted and unrestricted models described in Section 2.3. Estimation Methods4. The value of the λ statistic is 76.68, with 8 degrees of freedom equal to the number of restrictions in the restricted model, this value being statistically significant at 1% level. Based on this value, we reject the null hypothesis (H0: ßiFOW= ßiNFOW=ßi) of equality of the estimated parameters, which measures
the relationships between determinants and survival in owned SMEs and non family-owned SMEs. This result justifies the estimation of the relationships between determinants and survival in family-owned SMEs and non family-owned SMEs.
In probit regressions, the comparison between estimated parameters, related to different samples, is not sufficient. In fact, given that the models are not linear, the magnitude of each estimated parameter is influenced by the values and coefficients of all the independent variables. For a correct comparison of the impact of the independent variables on the probability of survival in family-owned SMEs and non family-owned SMEs, it is necessary to estimate the elasticity of each independent variable. In this paper, these elasticities measure the percentages of variation of the survival probability of owned and non family-owned SMEs, for an increase of 1% in each independent variable. The elasticities were
4
calculated on the basis of the mean values of the independent variables. The results of the estimated coefficients and elasticities are presented in the following table.
Table 6: Survival analysis – Family-owned SMEs and non family-owned SMEs
Dependent Variable: Pr(δi,t)
Independent Variables
Family-Owned SMEs Non Family-Owned SMEs
Estimated Coefficients Elasticities Estimated Coefficients Elasticities
SIZEi,t 0.02178 (0.03612) 0.12784 0.14818** (0.03897) 0.60433 AGEi,t 0.03992 (0.04019) 0.14742 0.16711** (0.05019) 0.55534 CFi,t 0.59712** (0.12219) 0.43521 0.20112* (0.09894) 0.09182 LEVi,t -0.07812* (0.03801) -0.17824 0.20177** (0.067169) 0.38171 IPi,t -0.07641** (0.01890) -0.25162 -0.01541 (0.01603) -0.05617 R&Di,t 0.05612 (0.13929) 0.10293 0.35612** (0.10192) 0.51913 EVOLi,t -0.05491** (0.01448) -0.36344 0.01024 (0.01344) 0.08173 L.PRODi,t 0.01663** (0.00482) 0.31909 0.00544 (0.00761) 0.07108 CONS -0.01456 (0.02909) 0.00891 (0.02435) Pseudo R2 0.3451 0.3789 Firms 1589 485 Observations 11874 3596
Notes: 1. Standard errors in parenthesis. 2. ** Statistical significant at 1% level; * Statistical Significant at 5% level; 3. The estimates include sectoral dummy variables, but not show. 4. The estimates include time dummy variables but are not show.
Based on the estimated parameters, and above all on the elasticities, we can conclude that: 1) size, age, debt and R&D expenditure are of greater relative importance for increased survival of non family-owned SMEs than do for family-owned SMEs; 2) cash flow and labour productivity are of greater relative importance for increased survival of family-owned SMEs than do for non family-owned SMEs; and 3) interest paid and risk are of greater relative importance for diminished survival of family-owned SMEs than do for non family-owned SMEs.
Firstly, the empirical evidence indicates that the scale effect conferred by size and the reputation effect conferred by age are more relevant for the survival of non family-owned SMEs than for that of family-owned SMEs. Smaller, younger family-owned SMEs have greater possibilities of survival than non family-owned SMEs. Secondly, the terms in accessing finance affect, particularly, the survival of family-owned SMEs. Debt, interest paid and risk are determinants with a higher restrictive effect on the survival of family-owned SMEs than in the case of non family-owned SMEs. When internal finance is insufficient, access to external funding can imply particular difficulties for the survival in family-owned SMEs, compared to the case of non family-owned SMEs. Thirdly, R&D expenditure is more important in the activities of non family-owned SMEs than in those of family-owned SMEs. Non family-owned SMEs may manage R&D expenditure more efficiently than family-owned SMEs. Fourthly, labour productivity is more relevant for increased survival of family-owned SMEs than for that of non family-owned SMEs. This result indicates, firstly, that the labour factor, and its corresponding productivity, may be more important in the activities of family-owned SMEs, and secondly, that human resource management may be more efficient in family-owned SMEs than do in non family-owned SMEs.
4. Conclusion and implications
Using probit regressions and based on two samples: 1) 1589 family-owned SMEs; and 2) 485 non family-owned SMEs, this paper analyze the differences between family-owned SMEs and non family-owned SMEs for the determinants of survival. The empirical evidence obtained shows the existence of significant differences between these two types of firms for the determinants of survival.
The empirical evidence obtained allows us suggest important measures to support family-owned SMEs and non family-family-owned SMEs as well as owners/managers of these type of firms, to increase their chances of survival. In the case of family-owned SME, considering their particular difficulties in managing debt and financial charges, it is suggested to central and local authorities as well as business associations to make available direct financial support to this type of SMEs with special difficulties in funding good investment opportunities. It is, also particularly, relevant that family-owned SME owners/managers build up trusting relationships with creditors for improving the terms of credit. In addition, it is suggested that central and local authorities, and business associations, become active agents, in providing technical support for R&D investment in family-owned SMEs. The owners/managers of this type of firm should also manage this kind of investment more efficiently, promoting R&D investment as a positive determinant of survival of family-owned SMEs. As for non family-owned SMEs, considering that greater size and greater age are particularly important for increased likelihood of survival, it is suggested that local and central authorities and business associations give financial support to smaller and younger SMEs with good investment opportunities. Considering that labour productivity is not a determinant increasing the likelihood of survival of non family-owned firms, collaboration between trade union associations and the owners/managers of this type of SME is particularly recommended to improve efficiency in human resource management, so that employee productivity can become a determinant increasing the likelihood of survival.
Acknowledgements. We are extremely grateful to the anonymous referee for the excellent suggestions made for revising the paper. These suggestions were particularly important in improving the paper considerably. We are grateful for financial support of Portuguese FCT – Project PTDC/EGE-GES/116004/2009.
References
Agrawal, R. and Audretsch, D. (2001) Does entry size matter? The impact of the life cycle and technology of firm survival, The Journal of Industrial Economics, 49(1), 21-43. Blanco-Mazagatos, V., Quevedo-Puente, E. and Castrillo, L. (2007) The trade-off between
financial resources and agency costs in the family business, Family Business Review, 20(3), 199-213.
Cabral, L. and Mata, J. (2003) On the evolution of the firm size distribution: facts and theory, American Economic Review, 93(4), 1075-1090.
Chua, J., Chrisman, J. and Sharma, P. (1999) Defining the family business by behaviour, Entrepreneurship Theory and Practice, 23(4), 19-39.
Donckels, R. and Lambrecht, J. (1999) The re-emergence of family-based enterprises in East Central Europe: what can be learned from family business research in the Western World?, Family Business Review, 12(2), 171-188.
Esteve-Pérez, J. and Mañez-Castillejo, J. (2008) The resource-based theory of the firm and firm survival, Small Business Economics, 30(3), 231-249.
Filbeck, G. and Lee, S. (2000) Financial management techniques in family businesses, Family Business Review, 13(3), 201-216.
Giovannetti, G., Ricchiuti, G. and Velucchi, M. (2011) Size, innovation and internationalization: a survival analysis of Italian firms, Applied Economics, 43(12), 1511-1520.
Gujarati, D. and Porter, D. (2010) Essentials of Econometrics, 4th ed, New York: McGraw – Hill International.
Holmes, P., Hunt, A. and Stone, I. (2010) An analysis of new firm survival using a Hazard function, Applied Economics, 42(2), 185-195.
IAPMEI (2008) Sobre as PMEs em Portugal, Instituto de Apoio à Pequena e Média Empresa: Lisboa.
Littunen, H. and Hyrsky, K. (2000) The early entrepreneurial stage in Finnish family and nonfamily firms, Family Business Review, 13(1), 41-54.
López–Gracia, J. and Sánchez–Andújar, S. (2007) Financial structure of the family business: evidence from a group of small Spanish firms, Family Business Review, 20(4), 269-287. Maçãs Nunes, P. and Serrasqueiro, Z. (2012) Are young SMEs` survival determinants
different? Empirical evidence using panel data, Applied Economics Letters, 19(9), 849-855.
McConaughy, D. and Phillips, G. (1999) Founders versus descendants: the profitability, efficiency, growth characteristics and financing in large, public, founding family-controlled firms, Family Business Review, 12(2), 123-132.
Nordqvist, M. (2012) Understanding strategy processes in family firms: exploring the roles of actors and arenas, International Small Business Journal, 30(1), 24-40.
Patuelli, R., Vaona, A. and Grimpe, C. (2010) The German East-West divide in knowledge production: an application to nanomaterial patenting, Tijdschrift voor Economische en Sociale Geografie, Royal Dutch Geographical Society KNAG, 101(5), 568-582.
Siriopoulos, C. and Lalountas, D. (2008) Firm survival and time aggregation bias, Applied Financial Economics Letters, 4(5), 351-354.
Vaona, A. (2010) A survival analysis approach to the duration of Union membership in Italy, Applied Economics Letters, 17(11), 1089-1093.
Watson, P.L. and Westin, R.B. (1975) Transferability of disaggregate mode choice models, Regional Science and Urban Economics, 5(2), 227–249.